CC Sculptoris: A superhumping intermediate polar
Abstract
We present high speed optical, spectroscopic and Swift X-ray observations made during the dwarf nova superoutburst of CC Scl in November 2011. An orbital period of 1.383 h and superhump period of 1.443 h were measured, but the principal new finding is that CC Scl is a previously unrecognised intermediate polar, with a white dwarf spin period of 389.49 s which is seen in both optical and Swift X-ray light curves only during the outburst. In this it closely resembles the old nova GK Per, but unlike the latter has one of the shortest orbital periods among intermediate polars.
keywords:
binaries: close – novae, cataclysmic variables – stars: oscillations – stars: individual: CC Scl1 Introduction
CC Scl was listed as RX J2315.5-3049 in the ROSAT X-ray catalogue (Voges et al. 1999), later identified with a 17.3 magnitude star, classified as a cataclysmic variable (CV) (Schwope et al. 2000), and found in the Edinburgh-Cape Survey where it became EC 23128-3105 (it is also in the 2MASS catalogue as 2MASS J23153185-3048476). Its nature was confirmed when it was seen to rise in an outburst to magnitude 13.4 on 8 July 2000 (Stubbings 2000) followed by another about 100 days later. The latter was observed by Ishioka et al. (2001) who suspected two apparent superhumps with a separation of 0.078 d. However, later photometric and spectroscopic observations made in quiescence (Augusteijn 2000; Chen et al. 2001; Tappert, Augusteijn & Maza 2004; Augusteijn et al. 2010) gave an orbital period of 0.0584 d (1.402 0.005 h). Large amplitude flickering was noted and an occasional shallow narrow eclipse-like dip just after maximum light. Spectroscopic features included strong H and He i lines, with substantial strength of He ii 4686. Despite the last mentioned a classification simply as a dwarf nova was generally agreed upon.
Ishioka et al. (2001) noted that at 9 d duration the apparent superoutburst of CC Scl was unusually brief: d is more to be expected of a short orbital period system. Following the two outbursts in 2000, CC Scl has had only seven outbursts reported by the AAVSO since (probably all rising to about the same maximum brightness), and only one outburst detected by the Catalina Real-Time Transient Survey (Drake et al. 2009) in the past 6 years – the superoutburst of November 2011 discussed in this paper. Our observations were triggered by the CRTS announcement on 3 Nov 2011; PAW and BW were on the second night of a scheduled photometric observing run.
In Sect. 2 we describe our optical observations of CC Scl and analyse these to find persistent periodicities. In Sect. 3 we show the Swift X-ray satellite observations that were obtained and in Sect. 4 we discuss the results and compare them with other CVs, in particular the very similar behaviour of Nova Persei 1901 (GK Per).
2 Optical observations of CC Scl
The data were taken using a new instrument called SHOC (Sutherland High-speed Optical Camera; Gulbis et al. 2011b). The instruments were designed based on MORIS at NASA’s 3-m Infrared Telescope Facility on Mauna Kea, Hawaii (Gulbis et al. 2011a). The primary components are (i) a high quantum efficiency ( 90% from roughly 480 nm to 700 nm), low read noise, low dark current, frame-transfer camera; (ii) a control computer capable of recording data at high rates, and (iii) a GPS for accurate timing. SHOC uses an Andor iXon X3 888 UVB camera. The UVB designation indicates a back-illuminated CCD with UV phosphor, elevating the quantum efficiency to approximately 35% below 380 nm, and an uncoated fused silica window. The camera has a selection of readout amplifiers including conventional and electron-multiplying (EM) modes, each having multiple preamplifer gain settings.
For these observations, SHOC was mounted below the filter wheel on the 40-inch (1.0-m) reflector at the Sutherland site of the South African Astronomical Observatory (SAAO). The field of view was 2.9 arcmin 2.9 arcmin, and the data were binned 2x2 for a plate scale of 0.34′′/pix. The 1 MHz EM mode was employed with an EM gain of 20 and a preamplifier gain of 7.5 /ADU. These settings have an effective read noise on the order of 1 /pix. The camera was thermoelectrically cooled at C, resulting in a dark current of less than 0.001 /pix/sec.
| Run | Date of obs. | HJD first obs. | Length | tin | V |
|---|---|---|---|---|---|
| (+2450000.0) | (h) | (s) | (mag) | ||
| S8119 | 2011 Nov 03 | 5869.24749 | 2.80 | 1 | 13.4 |
| S8121 | 2011 Nov 04 | 5870.23977 | 2.75 | 1 | 13.6 |
| S8123 | 2011 Nov 05 | 5871.23970 | 3.34 | 4 | 13.8 |
| S8124 | 2011 Nov 06 | 5872.24102 | 5.05 | 4 | 14.2 |
| S8126 | 2011 Nov 07 | 5873.24092 | 4.56 | 4 | 14.2 |
| S8128 | 2011 Nov 08 | 5874.25021 | 4.52 | 4 | 14.1 |
| Run | Date of obs. | HJD first obs. | Length | tin | V |
|---|---|---|---|---|---|
| (+2450000.0) | (h) | (s) | (mag) | ||
| H01 | 2011 Nov 04 | 5870.49069 | 6.27 | 30 | 13.6 |
| H02 | 2011 Nov 05 | 5871.48644 | 6.38 | 45 | 13.9 |
| H03 | 2011 Nov 06 | 5872.48561 | 6.39 | 45 | 14.3 |
| H04 | 2011 Nov 07 | 5873.48613 | 6.38 | 45 | 14.2 |
| H05 | 2011 Nov 08 | 5874.48708 | 6.34 | 45 | 14.2 |
| H06 | 2011 Nov 09 | 5875.51221 | 5.73 | 45 | 15.6 |
| H07 | 2011 Nov 10 | 5876.49337 | 6.13 | 90 | 16.3 |
| H08 | 2011 Nov 11 | 5877.49508 | 6.08 | 90 | 16.5 |
| H09 | 2011 Nov 12 | 5878.52106 | 5.39 | 90 | 16.6 |
| H10 | 2011 Nov 13 | 5879.49426 | 5.81 | 120 | 16.6 |
| H11 | 2011 Nov 14 | 5880.49137 | 5.75 | 120 | 16.8 |
| H12 | 2011 Nov 15 | 5881.49045 | 5.75 | 120 | 16.6 |
| H13 | 2011 Nov 16 | 5882.49037 | 5.74 | 120 | 16.8 |
All the measurements were made without any optical filter, have been calibrated by using known UV-rich standard stars and corrected for atmospheric extinction in the usual manner. A log of the South African (SA) observational runs is given in Tab. 1; we were fortunate in having six consecutive clear nights, which provided excellent coverage of CC Scl.
In addition we have an extensive set of light curves obtained by FJH at the Remote Observatory Atacama Desert (ROAD) in Chile, using a commercially available CCD camera from Finger Lakes Instrumentation, an FLI ML16803 CCD. The Microline (ML) line of CCD cameras is a lightweight design which can hold a variety of CCD chips. The full frame Kodak KAF-16803 image sensor used together with the 40 cm Optimized Dall Kirkham (ODK) f/6.8 telescope from Orion Optics UK gives a field of view of nearly 48 arcmin x 48 arcmin, and the data were binned 3x3 for a plate scale of /pix to keep the amount of data recorded to a reasonable value. The download speed was 8 MHz, the preamplifier gain 1.4 /ADU. The camera was thermo-electrically cooled to a temperature of C. All the measurements are made with a photometric V filter. The log of these observations is given in Tab. 2.
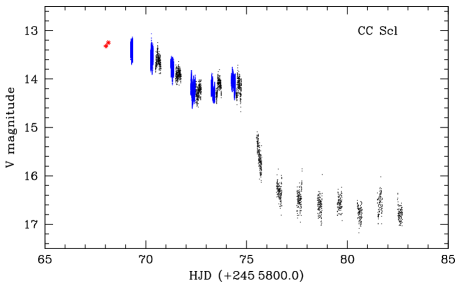
The outburst light curve of CC Scl, combined from the CRTS, SAAO and Chile observations, is shown in Fig. 1. The early ‘plateau’ part of the curve lasted at least 7 days (HJD 2455868 – 75); there is no record of when the outburst commenced but we suggest in Sect. 2.2 that it probably occured on 2 November (HJD 2455868). The rapid decay phase lasts only about 2 days, but there is a slow reduction after that (probably due to the post-outburst cooling of the white dwarf) to the CRTS long-term quiescent magnitude of 16.8. These are compatible with the total of 9 days recorded by Ishioka et al. (2001), and provides a range of outburst of 3.6 mag, so the duration and amplitude are unusually small for a short orbital period superoutbursting CV.

The full set of SAAO light curves, all taken during the outburst, is shown in Fig. 2 and those obtained in Chile during outburst in Fig. 3. It is obvious in the suite of light curves that there are both slow variations on time scales min in the earliest runs, and a very prominent s modulation later on the plateau. We first examine the evidence for orbital and superoutburst periods in our entire data set.

2.1 Modulations at orbital time scales.
To search for any modulation at the known orbital period we look at the quiescent ROAD photometry (Chile), starting with 11 November (runs H08-H13, Tab. 2). The Fourier transform (FT) of these 6 nights is shown in Fig. 4; the dominant frequency is a superhump and its harmonics, which we analyse below. To detect the orbital modulation we prewhiten at the superhump fundamental and its second harmonic (see below), which reveals a probable very weak orbital modulation, seen in the lower panel of Fig. 4. The indicated period is 1.383 ( 0.001) h at an amplitude of 40 mmag, very close to the Chen et al. (2001) spectroscopic period which was based on very limited observations. The amplitude of the variations in the light curve during outburst (Fig. 2, and Sect. 2.2) will obscure any shallow eclipse as occasionally seen in earlier observations (Chen et al. 2001). The individual light curves in quiescence are too noisy to see such a shallow eclipse.


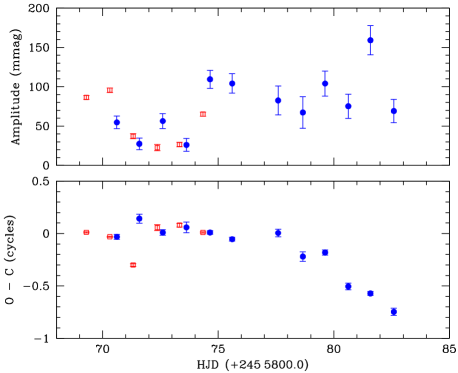
Strong superhumps are present throughout the outburst and quiescent light curves. In studies of superhumps the notation used for components in the amplitude spectra of light curves is usually for the orbital frequency and for the precession frequency of the elliptical disc. The superhump frequency is then , and harmonics, together with sum and difference frequencies, are commonly seen. Our FT for the runs during superoutburst (runs H01-H05 in Tab. 2, see also the lower panel of Fig. 8) shows a strong signal at a period of 1.443 h, which, combined with the orbital period of 1.383 h gives a precession period for the disc of 1.4 d. During quiescence for the week immediately after superoutburst we again find a dominant signal at the superhump period, now 1.430 h (Fig. 4), implying that the precession period has lengthened to 1.8 d. But in addition to there are now peaks at , and . In well-studied superoutbursts frequencies such as and higher orders are often detected (e.g. IY UMa: Patterson et al. 2000a; DV UMa: Patterson et al. 2000b), but is not detectable. However, it does appear in some (helium-transferring) AM CVn stars (e.g. HP Lib: Patterson et al. 2002; AM CVn: Skillman et al. 1999). We have no explanation of why this orbital sideband of the superhump frequency appears only in CC Scl among H-rich CVs. The average profiles of the three signals seen in Fig. 4 are shown in Fig. 5.
The 6 nights after outburst (runs H08-H13, Tab. 2) show an alteration of mean brightness (Fig. 1). A sine curve fit to these nights produces a period of 1.96 d and amplitude of 0.17 mag. This is generated by beats between the 1.430 h 88 mmag superhump and 1.383 h 40 mmag orbital modulation, i.e. the [= ] frequency.
In superoutbursting dwarf novae (SU UMa stars) it has previously been reported that superhumps persist for several days after outburst, as “late superhumps”, with period similar to that during outburst, but shifted in phase by (e.g. DV UMa: Patterson et al. 2000a). But this may be quite rare because most “late superhumps” appear after a switch to a shorter period (or a steadily changing phase) without any phase discontinuity (e.g. SDSS J0137: Pretorius et al. 2004; ‘Stage C’ in Kato et al. 2009; V344 Lyr: Wood et al. 2011). This behaviour is seen in CC Scl (Fig. 6). We have omitted the run H07 from this plot as no definite superhump was detectable.

2.2 Modulations at the 390 s time scale
Fourier transforms of all of the outburst light curves, with the exception of the first (on 3 November 2011), show a prominent peak at 389.5 s previously unreported from this object. On 3 Nov the first harmonic of this fundamental period is quite strongly present. The FTs of the Sutherland individual runs are shown in Fig. 7. An FT for all of them combined and one for the suite of Chilean outburst runs is given in Fig. 8. It is interesting to see how the latter observations, acquired with a 40 cm aperture and despite the modulation being invisible to the eye in the light curves (Fig. 3), show the 390 s signal with great prominence - a valuable consequence of the lengths of the runs being twice those of the Sutherland ones.

None of the FTs show any orbital sidebands to the fundamental period, and as the optical and X-ray periods (see Sect. 3) are identical we conclude that the modulation arises from the rotation period () of a magnetic white dwarf primary, which puts CC Scl into the intermediate polar (IP) class of CVs (see Chapter 7 of Warner (1995)). An explanation for the absence of the fundamental period on the first night of our observations is then available by analogy with the model of the outburst properties of the IP XY Ari (Hellier, Mukai & Beardmore 1997): on the first night the outburst had started only about a day before and the wave of increased mass transfer through the disc had not yet reached the inner regions, leaving two accretion zones optically visible, but by the second night the radius of the magnetosphere that was keeping the inner parts of the disc open had been reduced by increased gas flow, obscuring the lower accretion zone on the white dwarf. The shallow eclipses seen in quiescence (Sect. 1) show that CC Scl is of the moderately high inclination required for this explanation. Note, however, that there are occasional weak signals at the first harmonic during the outburst (Figs. 7 and 8), but this could arise from a slightly non-sinusoidal profile to the fundamental signal, rather than direct viewing of the second accretion pole.
From the combined sets of observations we find the following ephemeris for maximum light of the 390-s modulation
2.3 Optical spectroscopy during superoutburst
During run S8124 (see Tab. 1) simultaneous spectroscopy with the Cassegrain spectrograph on the 74-in reflector of the SAAO was obtained. Over a two hour period (HJD 2455872.279 - 2455872.364), eleven 600-s spectra were recorded. For these observations grating 7 was used with a slit width of , giving a wavelength coverage of 3800 – 7738 Å at 2.28 Å per pixel. Relative flux corrections were made using the spectrophotometric standard LTT 9293 and absolute calibrations were performed based on the simultaneous observations obtained with the SHOC camera (see Tab. 1).
The combined spectrum is shown in Fig. 9 and shows, besides the double-peaked Balmer emission lines, strong He ii 4686 Å emission as well as numerous double-peaked He i lines. All the identified lines are indicated by the vertical markers in Fig. 9. Compared with the spectrum of CC Scl in quiescence (Chen et al. 2001; Tappert et al. 2004), the He ii line has been greatly enhanced, becoming about half instead of 10% the intensity of H, and the 4650 Å C iii/N iii blend which is not definitely detectable in quiescence, is clearly present on the blue wing of 4686 Å. Although more commonly associated with magnetic CVs, these enhancements can occur in superoutbursts of ordinary dwarf novae (e.g. Z Cha: Honey et al. 1988). All the lines are doubled, which indicates a large inclination and is compatible with the presence of the shallow eclipses in quiescence.
In early studies of IPs an important clue to their structure was given by the orbital modulation of emission line strengths and their components – e.g. the V/R ratio of the doubled lines. The V/R ratio is a relative measurement of the equivalent widths on either side of the rest wavelength of the line. Through modelling the velocity-amplitude of the observed S-wave in the emission lines as originating from the disc-stream impact region, it proved the existence of an accretion disc impacted on its rim by an accretion stream, as in non-magnetic CVs (e.g. FO Aqr: Hellier, Mason & Cropper 1990; AO Psc: Hellier, Cropper & Mason 1991). Our spectra show these same characteristics, seen in H, H and He II (Fig. 10), but our time resolution is insufficient to allow folding on spin phase, which was a direct way of demonstrating rotation of the accreting magnetospheres in the FO Aqr and AO Psc analyses.


3 Swift observations
Although the Swift satellite (Gehrels et al. 2004) was designed for the study of gamma-ray bursts, its rapid-response capabilities also make it ideal for following other transient sources such as novae and cataclysmic variables. There are three instruments onboard Swift: the wide-field BAT (Burst Alert Telescope; Barthelmy et al. 2005), which covers 15 – 350 keV; and the narrow-field instruments: the XRT (X-ray Telescope; Burrows et al. 2005) spanning 0.3 – 10 keV; and the UVOT (UV/Optical Telescope; Roming et al. 2005) with filters covering 1700 – 6500 Å. Swift Target of Opportunity observations were requested shortly after CC Scl was found to be in a superoutburst, these were continued until it ended. Here we present results from the XRT and UVOT, CC Scl was not bright enough to have been detected by the BAT. Swift has an orbital period of 1.6 h, source visibility constraints prevent continuous observations longer than 0.5 h; for these reasons Swift has reduced sensitivity to the orbit and superhump periods of CC Scl.
Swift observed CC Scl between JD 2455873 – 81, starting 5 days after outburst if this occurred on Nov 2; Tab. 3 lists the observations obtained. All XRT data were in photon counting mode (which provides two-dimensional imaging, and is typically used for sources with count rates below count s-1, while the UVOT was operated in event mode and the data collected using the uvw2 filter (central wavelength of 2246 Å; FWHM of 498 Å). Version 3.8 of the Swift software, corresponding to HEASoft 6.11 (released 2011-06-07), was used, together with the most recent version of the Calibration Database. In our XRT analysis we used only grade 0 events to avoid pile-up.
| Seg. | Start time | End time | Time since | Exp. |
|---|---|---|---|---|
| No. | (UTC) | (UTC) | first obs. (ks) | time (ks) |
| 001 | 07 Nov at 15:57 | 16:22 | 0 | 1.48 |
| 002 | 08 Nov at 11:11 | 16:23 | 69.2 | 5.45 |
| 003 | 09 Nov at 00:12 | 00:36 | 116.1 | 1.40 |
| 004 | 09 Nov at 02:03 | 02:10 | 122.8 | 0.38 |
| 005 | 09 Nov at 03:09 | 03:33 | 126.7 | 1.43 |
| 006 | 09 Nov at 04:56 | 05:22 | 133.2 | 1.54 |
| 007 | 10 Nov at 00:03 | 00:26 | 202.0 | 1.27 |
| 008 | 10 Nov at 01:38 | 02:02 | 207.7 | 1.44 |
| 009 | 10 Nov at 03:18 | 03:43 | 213.7 | 1.50 |
| 010 | 10 Nov at 04:50 | 05:15 | 219.2 | 1.48 |
| 011 | 11 Nov at 00:12 | 02:13 | 289.7 | 3.04 |
| 012 | 11 Nov at 13:06 | 14:58 | 336.1 | 2.96 |
| 013 | 12 Nov at 00:11 | 02:11 | 375.3 | 2.31 |
| 014 | 12 Nov at 13:07 | 15:10 | 422.6 | 3.10 |
| 015 | 13 Nov at 00:16 | 02:17 | 462.7 | 2.98 |
| 016 | 13 Nov at 13:10 | 15:12 | 509.0 | 2.74 |
| 017 | 14 Nov at 00:21 | 02:22 | 549.4 | 2.88 |
| 018 | 14 Nov at 13:12 | 15:16 | 595.6 | 2.86 |
| 019 | 15 Nov at 00:27 | 02:27 | 636.1 | 2.74 |
| 020 | 15 Nov at 11:42 | 13:44 | 676.6 | 2.73 |

3.1 X-ray spectral analysis
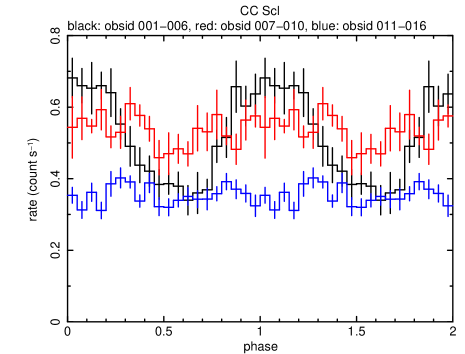
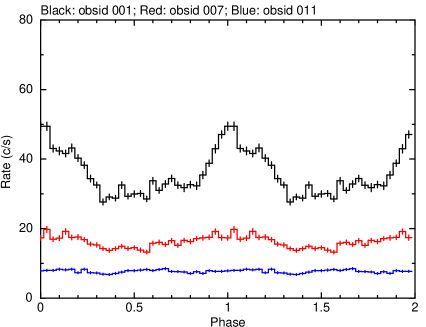
Fig. 11 shows the Swift X-ray and UV light curves, these can be compared with the optical light curve in Fig. 1. The X-rays show a general declining trend, while the UV evolution more closely matches that in the optical, declining sharply around JD 2455875. The X-ray hardness ratio ( keV/ keV) is shown in Fig. 12, there is a marked spectral softening around the time of the sharp optical-UV decline.

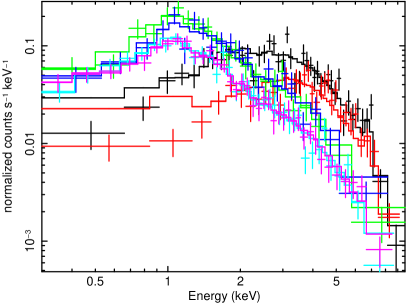
Time-resolved X-ray spectra were created, both for each observation (at late times, observations were merged to improve the signal-to-noise), and covering the minimum and maximum 0.2 cycles of the spin modulation (Section 2.2) before and after the sharp optical-UV decline. These can all be well fitted with a solar abundance, partially covered cooling flow model (see Tabs. 4 and 5, and Fig. 13). Simpler models do not fit or are physically inappropriate. The cooling flow model (mkcflow in xspec) has a distribution of emission measure against temperature which is the inverse of the bolometric luminosity for optically thin plasma emission, and is commonly used to represent the shocked accretion column as it cools and settles onto a magnetic white dwarf. In this model the lower and upper temperatures were fixed at 0.1 and 30 keV respectively; no interstellar absorption was needed.
| Seg. | Covering | C-stat/dof | |
| No. | ( cm-2) | fraction | |
| 001 | 2.77 | 0.97 0.01 | 308/393 |
| 002 | 4.37 | 659/674 | |
| 003 | 3.16 | 0.98 0.01 | 335/397 |
| 004 | 1.86 | 0.97 | 157/167 |
| 005 | 3.40 | 0.98 0.01 | 267/381 |
| 006 | 2.80 | 0.98 0.01 | 276/342 |
| 007 | 0.60 | 285/320 | |
| 008 | 0.71 | 0.79 0.06 | 341/377 |
| 009 | 0.43 | 292/333 | |
| 010 | 0.49 | 0.60 0.10 | 272/358 |
| 011 | 0.24 | 369/381 | |
| 012-013 | 0.61 | 0.61 0.07 | 463/479 |
| 014-015 | 0.14 | 0.48 | 457/482 |
| 016-017 | 0.65 | 0.53 0.07 | 441/467 |
| 018-020 | 0.57 | 395/489 |
| Seg. | min/ | Covering | C-stat/dof | |
|---|---|---|---|---|
| No. | max | ( cm-2) | fraction | |
| 001-006 | max | 3.94 | 395/420 | |
| 001-006 | min | 7.64 | 0.981 0.004 | 259/314 |
| 007-010 | max | 0.25 | 0.65 | 194/214 |
| 007-010 | min | 0.52 | 0.77 0.08 | 181/217 |
| 011-020 | max | 0.10 | 0.66 | 350/363 |
| 011-020 | min | 0.44 | 0.55 0.07 | 332/375 |


The good fits we have achieved demonstrate that the intrinsic emission of CC Scl is not significantly changing its spectral distribution during the observations. However, both the absorption column and covering fraction show a clear decline coincident with the optical-UV flux decline (see Fig.14). This change in absorption has a substantial effect on the fraction of the intrinsic flux that we see. In Fig. 15 we show the bolometric flux ( keV) light curve of CC Scl created by removing the effect of this changing absorption, a decline in luminosity by a factor at the time of the optical-UV decline is clearly evident. Tab. 5 and Fig. 13 show that CC Scl is always more absorbed at the time of the observed flux minimum in the spin cycle, but that this effect is much stronger when the outburst was at its brightest.
3.2 389.5 s modulation
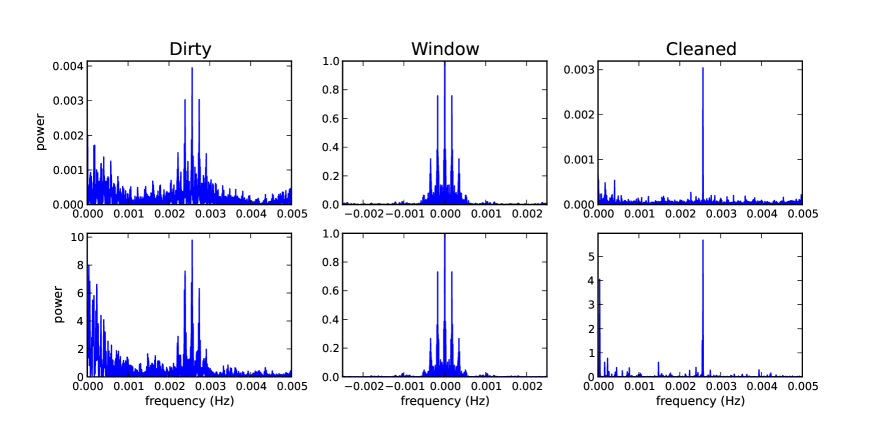
We used the CLEAN procedure (Robert, Lehar & Dreher 1987; Norton, Beardmore & Taylor 1996) to generate power spectra of the observed X-ray and UV count rates binned at 50 and 5 s respectively and de-trended with a second order polynomial. The upper panels of Fig. 16 show the results for the first six X-ray observations; the lower panels plot the UVOT results for data up to observation segment 010. There is a very clear detection of the 389.5 s modulations during these time intervals. The period is measured from the X-ray clean power spectrum to be s, while the UV value is s. Both values are consistent with the period measured more precisely in the optical data. The evolution of the X-ray pulse is illustrated by Fig. 17, which shows how the modulation fraction declined before the observed count rate. Fig. 18 shows three epochs of UVOT data folded on the optical ephemeris, revealing an initial fractional amplitude similar to that seen in X-rays, although this declines along with the flux eventually falling to a much greater extent than is seen in the X-ray count rate (the UV decline is much more consistent with the bolometric X-ray flux decline seen in Fig. 15 however). As is also the case in X-rays, the 389.5 s modulation is not detected at late times in the UV.
Consistent with the phase resolved spectral fits, the plot of the hardness ratio as a function of 389.5 s phase in Fig. 19 clearly demonstrates the characteristic IP behavior: the source is harder when fainter. Both the X-ray and UV modulation profiles peak at the time of the optical maximum (like AO Psc, but unlike PQ Gem; Evans & Hellier 2005a), suggesting a common origin in all bands, and thus that the accretion curtains are obscuring the hot accretion column across the entire spectrum at this time.

We know that a viscous accretion disk must be present in CC Scl because we see superhumps, it therefore follows that the 389.5 s period must be the spin period of the magnetic white dwarf. While it is possible for X-rays to show an orbital beat of the spin period rather than the spin period itself, this is very rare and can only happen if the white dwarf accretes from a structure fixed in orbital phase. Although V2400 Oph can show this behavior (Buckley et al. 1995), this system is supposed not to have a viscous disk (Hellier & Beardmore 2002); thus we conclude that in CC Scl s.
There is a strong decline in the spin-modulated flux fraction in both X-rays and UV as the luminosity of CC Scl decreases from outburst to quiescence. As discussed in Sect. 2.2, these changes can be due to a higher accretion rate during the outburst forcing the inner disc radius in towards the white dwarf, blocking the lower accretion pole so that we can see the light curve modulated at the white dwarf spin period. Then, when the accretion rate decreases again, the inner disc radius moves back out, meaning that we can see the lower pole, the emission from which is in anti-phase with the upper pole and effectively cancels the modulation (e.g. Hellier et al. 1997). The view to the lower pole could also be blocked in outburst if the disk were to thicken at this time.
4 Discussion
4.1 CC Scl as an Intermediate Polar
The list of definitely confirmed IPs (Mukai 2011) contains thirty-five members, to which we can now add CC Scl. Only five of those in Mukai’s catalogue have h, i.e. are below the ‘orbital period gap’; CC Scl is thus an addition to this rare group. There are, however, two additional very short systems that should be given full IP status: V455 And (Matsui et al. 2009; Silvestri et al. 2012) and WZ Sge (Warner & Pretorius 2008). In Tab. 6 we list their properties, clustered into three groups: the slow rotators with , intermediate with / and those with /.
CC Scl is only the second example of the middle group (see Mukai (2011) for a complete plot of versus in which the rarity of low systems is clearly visible). The first two groups represent respectively spins that are near equilibrium with angular momentum transferred directly from near to the inner Lagrangian point by strong magnetic fields, or, for weaker fields, after passage through an accretion disc which acquires angular momentum more appropriate to the circularisation radius (King & Wynn 1999). We deduce from this that the white dwarfs in HT Cam and CC Scl have magnetic moments significantly lower than those in the first four systems, and that V455 And and WZ Sge are lower still.
| Star | Porb (h) | (s) | / | (d) |
| SDSS J2333+15 | 1.385 | 2500 | 1.99 | - |
| V1025 Cen | 1.41 | 2147 | 2.36 | discless |
| DW Cnc | 1.44 | 2315 | 2.24 | |
| EX Hya | 1.64 | 4022 | 1.47 | |
| CC Scl | 1.38 | 389 | 12.8 | 9 |
| HT Cam | 1.43 | 515 | 10.0 | 3 |
| V455 And | 1.35 | 67.6 | 72 | 17 |
| WZ Sge | 1.36 | 27.8 | 176 | 25 |
Tab. 6 also notes dwarf nova-like outburst durations of the group of short periods IPs (none reported in SDSS J2333+15). V1025 Cen is believed to have a sufficiently strong field that no standard disc forms - instead mass transfer takes place through a centrifugally supported torus which does not suffer the standard disc instability. DW Cnc, EX Hya, and HT Cam have very brief infrequent outbursts, also unlike standard dwarf novae, which probably result from intermittent storage of gas just outside the magnetically defined inner edge of the accretion disc (Spruit & Taam 1993); therefore CC Scl is the only member of the middle group which has almost canonical disc instabilities, even though of slightly short durations for superoubursts. V455 And and WZ Sge have only superoutbursts.
The magnetosphere of the white dwarf in CC Scl will produce an inner disc radius of cm, which is and , where the notation and equations 2.61, 2.83a, 7.17 of Warner (1995) have been used. Thus about 40% of the outer disc of CC Scl is available for regular dwarf nova outbursts (but only % of the outer disc of HT Cam). This may account for (a) the shorter than normal superoutbursts in CC Scl (there is less mass to drain out) and (b) the extremely short outbursts in HT Cam. These formulae do not apply to the longest group in Tab. 6 because the structure of what amounts to an accretion torus rather than a truncated disc is not known - but the effect evidently is to allow only very short-lived outbursts, and this may be what is happening in HT Cam as well.
From analysing X-ray spectra, Evans & Hellier (2005b) find that EX Hya, V1025 Cen and HT Cam are the only IPs that have low surface density accretion curtains in quiescence (with cm-2), implying a low rate of mass transfer in these systems, as is expected for CVs below the period gap. For CC Scl our X-ray spectra show cm-2 at spin minimum in outburst and quiescence, perhaps suggesting a higher accretion rate even though it too has an orbital period below the gap. Taking the quiescent luminosity of CC Scl from the latter part of Fig. 15, we have erg s-1, where is the distance in kpc. Considering the accretion rate to be , and assuming a white dwarf mass of 0.6 M⊙, we find the accretion rate to be M⊙ yr-1. The high Galactic latitude of CC Scl () suggests , but without a better measure we cannot decide whether the accretion rate in CC Scl is high for its orbital period (for example EX Hya, with close to that of CC Scl, has an accretion rate of M⊙ yr-1, Beuermann et al. 2003), and thus cannot test the absorption – accretion rate relation suggested by Evans & Hellier.
4.2 Comparison with GK Per
GK Per was Nova Persei 1901, one of the brightest novae of the twentieth century. It fell to its pre-eruption brightness after about 11 years, but since 1966 it has shown dwarf nova outbursts with an amplitude of 2 to 3 mag roughly every 3 years. In addition, it is established as an IP from a 351.3 s modulation in hard X-rays during outbursts (Watson, King & Osborne 1985), which is of low amplitude or absent during quiescence. However, it is seen at low amplitude in the photometric U band, even during quiescence, but is less coherent at longer wavelengths and better described as quasi-periodic near 380 s (Patterson 1991). During outbursts the GK Per spectral lines stay in emission, rather than changing to broad absorption lines as in normal dwarf novae.
The similarities to CC Scl are marked, but one way in which GK Per differs totally from CC Scl is that it has an orbital period that is one of longest known for normal CVs: it is 1.997 d, deduced from spectroscopy. This implies a large separation of components and a very large disc radius, of which only a small part of the central region is swept clear by the rotating magnetosphere of the primary. An effect of the large is that it is difficult to make photometric observations that show any orbital brightness modulation, and even more difficult to see superhumps, if they exist. The possibility of superhumps arises because the secondary in GK Per is a subgiant reduced in mass through evolution and consequent mass transfer. The estimated mass ratio in GK Per is (Morales-Rueda et al. 2002), so using the formulae and for the quiescent outer disc radius and the 3-to-1 resonance radii, respectively (Warner 1995), we have for , and therefore the outer radius of the disc has only to expand by 20% (to take up the angular momentum released by infalling matter) during a dwarf nova outburst for the disc to start evolving into an elliptical shape. The precession period of the disc for is , i.e. d in GK Per. Although there have been no obvious superoutbursts among the dwarf nova outbursts in GK Per, the 2006 outburst (Evans et al. 2009) was noted as unusually long ( d), and we note that there were three maxima spaced about 30 d apart, which might be evidence for an effect of . At d the duration of most of the GK Per outbursts is too short for a -d periodicity to be properly established.
The X-ray, spectral and photometric similarities between GK Per and CC Scl suggest that the latter might have had a classical nova eruption sometime in the past few hundred years. There is no detectable nova shell in the availableç direct images, and GALEX images do not show any resolvable shell. An HST snapshot to look for H emission nebulosity could be justified.
4.3 Superoutbursts in intermediate polars
Superoutbursts among IPs have been considered rare, perhaps even non-existent, e.g., Patterson et al. (2011) have recently assessed the literature and conclude that although several IPs have dwarf nova outbursts, “no confirmed superhumpers are known to be magnetic”. Nevertheless there are a couple of examples that might qualify: Patterson et al. (2011) themselves cite TV Col and RX0704 as possible cases, but WZ Sge, the most extreme of the SU UMa stars, with outstanding superoutbursts and superhumps, has rapid oscillations ( s) that appear in optical and X-rays and which have been interpreted with an IP model (e.g. Warner, Livio & Tout 1996; Warner & Pretorius 2008). To this we can now certainly add CC Scl, as an unambiguous example of a superhumping IP, and from our earlier discussion GK Per could be a candidate. It is not clear from the long-term light curve of CC Scl (which, apart from the 2011 outburst, is very poorly sampled) whether all the outbursts except the latest are ordinary ones or whether they are superoutbursts. With two outbursts only 100 d apart it would be unusual to find they are both superoutbursts, but there is no sign in the light curve of a clear division in outburst ranges, and the fact that the only one (and of the usual maximum brightness), monitored with sufficient time resolution, turns out to have superhumps suggests that they all could be superoutbursts.
The question raised by CC Scl is why it alone, among the short orbital period IPs that have dwarf nova outbursts, is able to generate an elliptical disc and associated superhumps. The answer presumably lies in whatever limits outbursts in the other systems to only a couple of days in length - as a result there probably isn’t sufficient time to get the eccentric mode fully excited.
Acknowledgments
PAW and BW acknowledge support from the University of Cape Town (UCT) and from the National Research Foundation (NRF) of South Africa. This work was completed during a visit by PAW to the University of Southampton, which was funded by an ERC advanced investigator grant awarded to R Fender. APB, PAE, JPO and KLP acknowledge financial support from the UK Space Agency. AG acknowledges support from the NRF. We thank Andrea Dieball for looking in the GALEX archive at the position of CC Scl. We thank the Swift PI and team for their support of these Target of Opportunity observations. This paper uses observations made at the South African Astronomical Observatory.
References
- [1] Augusteijn T., 2000, vsnet-campaign, 544.
- [2] Augusteijn T., Tappert C., Dall T., Maza J., 2010, MNRAS, 405, 621
- [3] Barthelmy S.D., et al. 2005, Space Science Review, 120, 143
- [4] Beuermann K., Harrison Th.E., McArthur B.E., Benedict G.F., Gänsicke B.T., 2003, A&A, 412, 821
- [5] Buckley D.A.H., Sekiguchi K., Motch C., O’Donoghue D., Chen A.-L., Schwarzenberg-Czerny A., Pietsch W., Harrop-Allin M.K., 1995, MNRAS, 275, 1028
- [6] Burrows D.N., et al. 2005, Space Science Review, 120, 165
- [7] Chen A., O’Donoghue D., Stobie R.S., Kilkenny D., Warner B., 2001, MNRAS, 325, 89
- [8] Drake A.J., et al., 2009, ApJ, 696, 870
- [9] Evans P.A., Hellier C., 2005a, in Hameury J.-M., Lasota J.-P., eds., ASP Conf. Ser. Vol. 330, The Astrophysics of Cataclysmic Variables and Related Objects. Astron. Soc. Pac., San Francisco, p. 165
- [10] Evans P.A., Hellier C., 2005b, MNRAS, 359, 1531
- [11] Evans P.A., Beardmore A.P., Osborne J.P., Wynn G.A., 2009, MNRAS, 399, 1167
- [12] Gehrels N., et al., 2004, ApJ, 611, 1005
- [13] Gulbis A.A.S., et al., 2011a, PASP, 123, 461
- [14] Gulbis A.A.S., O-Donoghue D., Fourie P., Rust M., Sass C., Stoffels J., 2011b, EPSC-DPS Joint Meeting, 1173
- [15] Hellier C., Beardmore A.P., 2002, MNRAS, 331, 407
- [16] Hellier C., Cropper M., Mason K.O., 1991, MNRAS, 248, 233
- [17] Hellier C., Mason K.O., Cropper M., 1990, MNRAS, 242, 250
- [18] Hellier C., Mukai K., Beardmore A.P., 1997, MNRAS, 292, 397
- [19] Honey W.B., Charles P.A., Whitehurst R., Barrett P.E., Smale A.P., 1988, MNRAS, 231, 1
- [20] Ishioka R., Kato T., Matsumoto K., Uemura M., Iwamatsu H., Stubbings R., 2001, IBVS No. 5023
- [21] Kato T., et al., 2009, PASJ, 61, S395
- [22] King A.R., Wynn G.A., 1999, MNRAS, 310, 203
- [23] Matsui K., et al. 2009, PASJ, 61, 1081
- [24] Morales-Rueda L., Still M.D., Roche P., Wood J.H., Lockley J.J., 2002, MNRAS, 329, 597
-
[25]
Mukai K., 2011,
http://asd.gsfc.nasa.gov/Koji.Mukai/iphome/iphome.html - [26] Norton A.J., Beardmore A.P., Taylor P., 1996, MNRAS, 280, 937
- [27] Patterson J., 1991, PASP, 103, 1149
- [28] Patterson J., Kemp J., Jensen L., Vanmunster T., Skillman D.R., Martin B., Fried R., Thorstensen J.R., 2000a, PASP, 112, 1567
- [29] Patterson J., et al., 2000b, PASP, 112, 1584
- [30] Patterson J., et al., 2002, PASP, 114, 65
- [31] Patterson J., et al., 2011, PASP, 123, 130
- [32] Pretorius M.L., Woudt, P.A., Warner B., Bolt G., Patterson J., Armstrong E., 2004, MNRAS, 352, 1056
- [33] Roberts D.H., Lehar J., Dreher J.W., 1987, AJ, 93, 965
- [34] Roming P.W.A., et al., 2005, Space Science Review, 120, 95
- [35] Schwope A.D., et al, 2000, AN, 321, 1
- [36] Silvestri N.M., Skzody P., Mukadam A.S., Hermes J.J., Seibert M., Schwartz R.D., Harpe E., 2012, AJ, in press
- [37] Skillman D.R., Patterson J., Kemp J., Harvey D.A., Fried R.E., Retter A., Lipkin Y., Vanmunster T., 1999, PASP, 111, 1281
- [38] Spruit H.C., Taam R.E., 1998, ApJ, 402, 593
- [39] Stubbings R., 2000, vsnet-outburst 245.
- [40] Tappert C., Augusteijn T., Maza J., 2004, MNRAS, 354, 321
- [41] Voges W., Aschenbach B., Boller T., Bräuninger H., Briel U., Burkert W., 1999, A&A, 349, 389
- [42] Warner B., 1995, Cataclysmic Variable Stars, Cambridge Univ. Press, Cambridge
- [43] Warner B., Pretorius M.L., 2008, MNRAS, 383, 1469
- [44] Warner B., Livio M., Tout C.A., 1996, MNRAS, 282, 735
- [45] Watson M.G., King A.R., Osborne J., 1985, MNRAS, 212, 917
- [46] Wood M.A., Still M.D., Howell S.B., Cannizzo J.K., Smale A.P., 2011, ApJ, 741, 105