Long XMM observation of the Narrow-Line Seyfert 1 galaxy IRAS13224-3809: rapid variability, high spin and a soft lag
Abstract
Results are presented from a 500 ks long XMM-Newton observation of the Narrow-Line Seyfert 1 galaxy IRAS 13224-3809. The source is rapidly variable on timescales down to a few 100 s. The spectrum shows strong broad Fe-K and L emission features which are interpreted as arising from reflection from the inner parts of an accretion disc around a rapidly spinning black hole. Assuming a power-law emissivity for the reflected flux and that the innermost radius corresponds to the innermost stable circular orbit, the black hole spin is measured to be 0.988 with a statistical precision better than one per cent. Systematic uncertainties are discussed. A soft X-ray lag of 100 s confirms this scenario. The bulk of the power-law continuum source is located at a radius of 2–3 gravitational radii.
keywords:
accretion, accretion discs – black hole physics – line:profiles – X-rays:general1 Introduction
The X-ray emission from most Narrow-Line Seyfert 1 galaxies (NLS1) is characterised by a steep soft X-ray spectrum and rapid variability. The most extreme such objects are 1H 0707-495 and IRAS13228-3809, which both show a sharp drop above 7 keV in XMM Newton spectra (Boller et al 2002, 2003). 1H 0707-495 has been further studied several times with XMM, including a long 500 ks dataset in 2008 which revealed broad iron K and L lines and a soft lag of about 30 s (Fabian et al 2009; Zoghbi et al 2010, 2011). In contrast, IRAS13224-3809 only had 64 ks of XMM data (Ponti et al 2010; Gallo et al 2004), despite showing spectacular variability during ROSAT (Boller et al 1997) and ASCA (Dewangan et al 2002) observations. New observations totalling 500 ks have now been made with XMM in 2011 and reported here.
The unusual spectrum and 7 keV drop of both objects have been interpreted as due to either intervening absorption or strong relativistic blurring of a reflection component (Boller et al 2002, 2003; Fabian et al 2004). 1H 0707-495 dropped into a low state for about 2 months at the start of 2011 during which an XMM spectrum showed evidence for even more blurring. The results are consistent with the power-law component of the X-ray source lying within one gravitational radius of the central black hole (Fabian et al 2012). In the normal state, one third of this component extends to .
The combination of the above results with the reverberation lags in 1H 0707-495 and in over a dozen other sources (Emanoulopolous, McHardy & Papdakis 2010; Tripathi et al 2011; De Marco et al 2011, 2012; Zoghbi & Fabian 2011 and Zoghbi et al 2012) provides very strong support for the reflection model for the X-ray emission of Seyfert galaxies. In this model the primary power-law component lies above the inner accretion disc around the black hole and produces the X-ray reflection component by irradiation of the disc (see e.g. Fabian & Ross 2010). The soft lags are then the light travel time difference between the power-law and reflection components as detected by the observer. The new data presented in this paper are interpreted within the reflection model.
IRAS13224-3809 is a radio quiet (1.4 GHz flux of 5.4 mJy, Feain et al 2009) NLS1 at redshift . For a flat CDM cosmology with , its luminosity distance is 293 Mpc.
2 Observations and Data Reduction
IRAS 13224-3809 was observed for ks with the XMM-Newton satellite (Jansen et al 2001) from 2011 July 19 to 2011 July 29 (Obs. IDs 0673580101, 0673580201, 0673580301, 0673580401). We focus on the data from the EPIC-pn camera (Strüder et al 2001). The first observation was taken in full window imaging mode, and the following three in large window imaging mode. All of the data were reduced in the same way, using the XMM-Newton Science Analysis System (SAS v.11.0.0) and the newest calibration files.
The data were cleaned for high background flares, resulting in a final total exposure of 300 ks. The data were selected using the condition pattern . Pile-up effects were not significant in any of the observations.

The source spectra were extracted from circular regions of radius 35 arcsec, which were centered on the maximum source emission, and the background spectra were chosen from a circular region of the same size and on the same chip. The position of the background regions were chosen to avoid the Cu-K emission lines from the electronic circuits behind the pn CCD that contaminate the background at 8.0 and 8.9 keV. The response matrices were produced using rmfgen and arfgen in SAS.
The spectra from the four observations were merged before fitting using mathpha in FTOOLS, and the resulting combined spectrum was rebinned to contain a minimum of 20 counts per bin. Spectral fitting was performed using xspec v12.5.0 (Arnaud 1996). Quoted errors correspond to 90% confidence level. Energies are given in the rest frame of the source. Quoted abundances refer to the solar abundances in Anders & Grevesse (1989).
3 Lightcurve and Variability
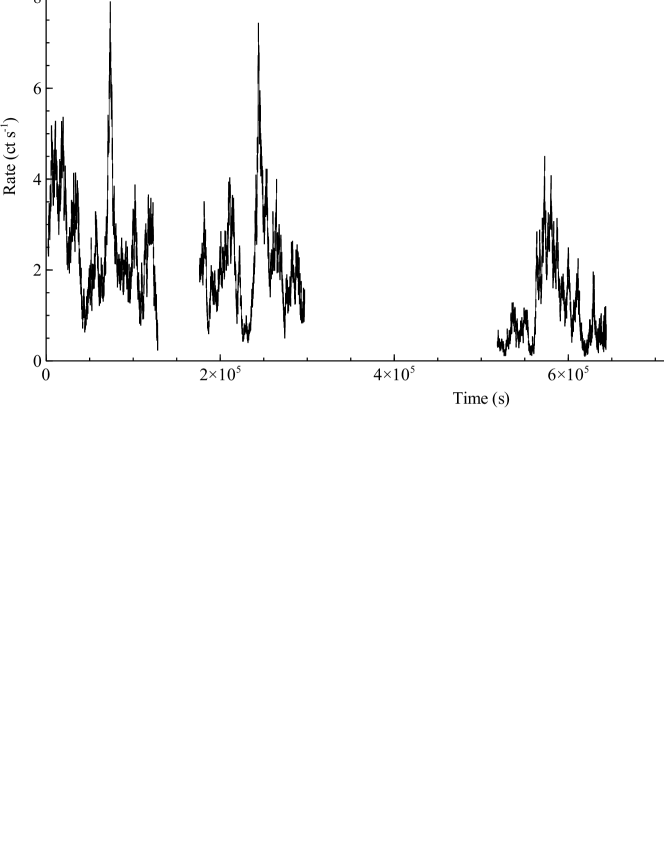
The lightcurve of the long XMM observation in 2011 is shown in Fig. 1. Start and stop dates are 2011 July 19 and 29. The source is clearly highly variable with several pronounced upward spikes of emission. The observation consists of 4 orbits of XMM, the first two of which are contiguous. Gaskell (2003) used ASCA data to show that the X-ray light curves can be lognormal, in the sense that a frequency histogram of log(count rate) is gaussian. We find that this is only a fair description of Orbit 1 and is a poor description of the Orbits 3 and 4.
The light curve is reminiscent of that seen with the ROSAT HRI, reported by Boller et al (1997). Observations were made every day for a month resulting in a total exposure of ks and mean observation length ks. 5 flares of emission were found rising above about 150 ct ks-1. Using webpimms (Mukai 1993) and a 0.1(0.2) keV blackbody model (see next Section for detailed spectrum) we find that 150 ct ks-1 corresponds to about 6(3.4) EPIC pn ct s-1. We see 3 flares above 6 pn ct and above 3.4 pn ct s-1 in 500 ks. The numbers depend on the precise spectral shape, but are similar enough to indicate that the behaviour of the source is similar to that in 1997.
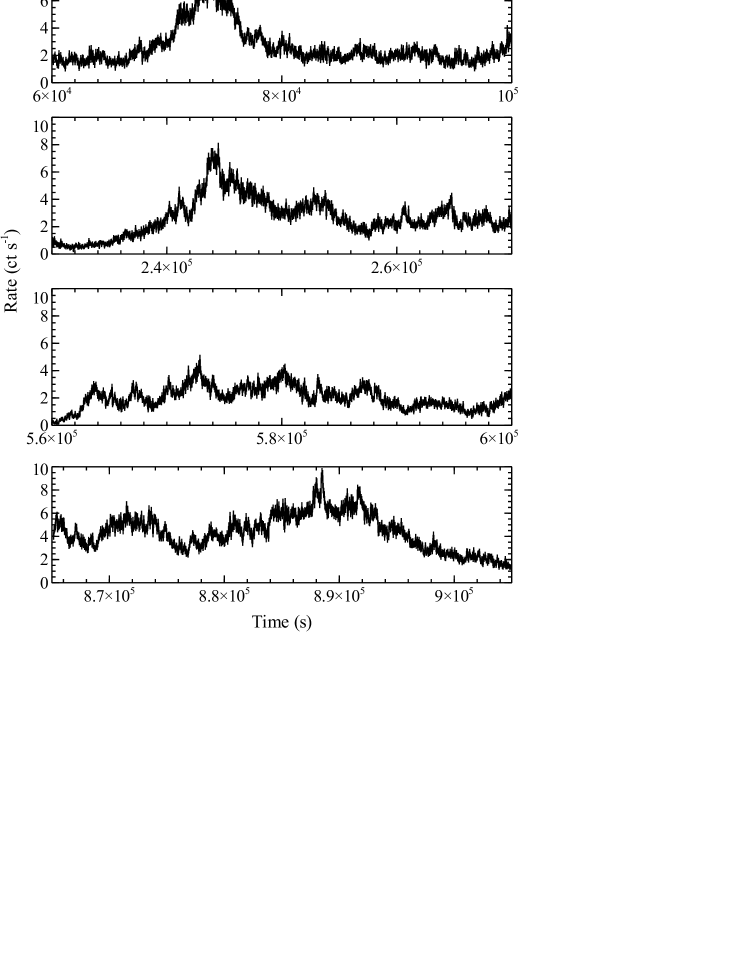
The bright spikes of emission are shown at higher time resolution in Fig. 2. The most rapid large rise occurs in Orbit 2, where the count rate jumps by by about 4.5 ct s-1 from s, i.e. 2000 s. Using the spectral model developed in Section 3, this corresponds to about s-2 in the 0.3–2 keV band. An even faster event occurs at the peak of Orbit 4 where the count rate jumps up and down by 3 ct s-1 in just a few 100 s. This means that active regions of the source at that time must be smaller than a few 100 light seconds in size. The rate of change of luminosity is thus approaching the value of s-2, especially if the energy band is extended down to 0.1 keV, which is the highest previously recorded, by Brandt et al (1999). That paper discusses the lower limit on the radiative efficiency required by the source in converting mass to energy to produce such a luminosity gradient (Fabian 1979); the efficiency must be high and approaching 50 per cent. This is difficult to envisage taking place without invoking non-spherical geometry and/or relativistic effects.
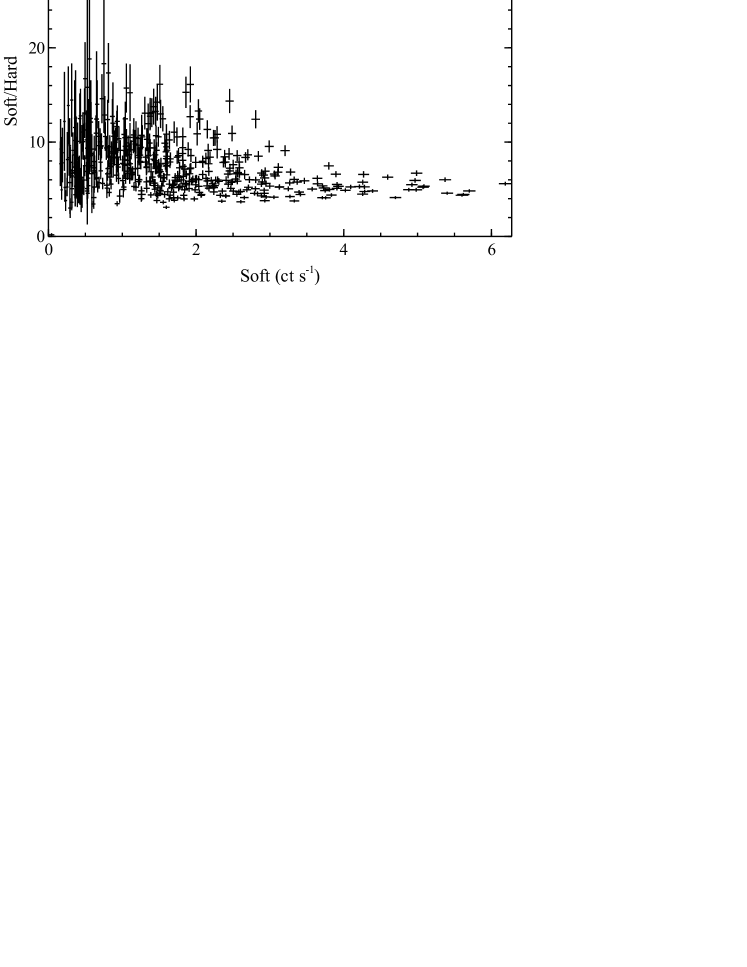
Light curves in both Soft (0.3–1 keV) and Hard (1–4 keV) bands are shown in Fig. 3, together with the Soft/Hard ratio and background count rate (note that the log of the background rate is shown as the values are mostly small). The pronounced large spikes in count rate show no strong spectral variation. A trend for the spectrum to be sometimes softer when the source is faint is apparent (Fig. 4). Orbit 3 shows considerable hardness ratio variations that do not seem to correlate with the count rate of either the source or background.
4 Spectral fits
Following the phenomeonological approach of Fabian et al (2009; see also Ponti et al 2010), we fit the spectrum over the 0.3–0.4 keV and 1.2–2.2 keV bands with a simple absorbed power-law plus blackbody model and then show the residuals to that model over the full 0.3–9 keV band (Fig. 4). Clear, broad emission residuals corresponding to the iron K and L bands are apparent. A good fit can be made over this range with that simple model plus two relativistically blurred lines, at 0.92 and 6.7 keV using the Laor model. The blurring parameters are tied between the two lines, yielding an inclination of deg and an emissivity index of 6.6. The equivalent width of the lines are 59.6 eV and 1.74 keV. Untying the parameters leads to a slightly better fit but unphysical energies (1.02 and 7.06 keV) and a lower inclination ( deg).
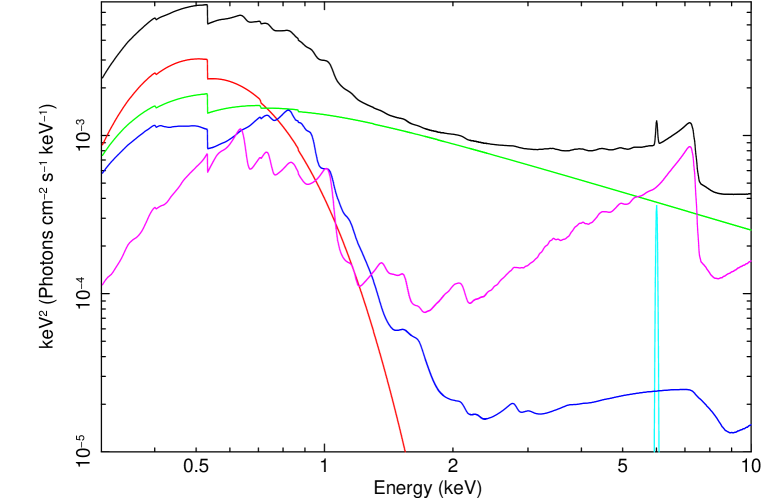
In practice we do not expect that the emission peaks are due to single lines but to line and absorption complexes in the reflection spectrum. We have therefore fitted the data with a physical model consisting of blackbody, power-law and two reflection components, one of high and the other of low ionization, similar to the best fitting model for 1H 0707-495. The motivation for the two ionization components is to model better a turbulent accretion disc. The model used is phabs*zphabs*(blackbody+ kdblur*(atable{reflionx.mod}+atable{reflionx.mod}), where the relativistic-blurring convolution model kdblur acts on the ionized reflection model reflionx of Ross & Fabian 2005)). The results of this fit are shown in Table 2 and Figs. 6 and 7.


| Component | Parameter | Value |
| Absorption | Galactic | |
| powerlaw | Photon index, | |
| Norm | ||
| relconv | Inclination, deg | |
| rg | ||
| Inner Index, | ||
| Outer Index, | ||
| Spin, | ||
| blackbody | temperature, keV | |
| Norm | ||
| extendx | Iron abundance / solar | |
| Ionization parameter, | ||
| Ionization parameter, | ||
| Norm1 | ||
| Norm2 | ||
| Redshift, | ||
We obtain the best spectral fit if the higher ionization component is replaced by a gaussian line at 0.86 keV (which is then relativistically blurred along with the lowly-ionized component). The need fro any absorption edge now disappears. This suggests that the spectral model we are using is incomplete. It is possible that the blackbody component is part of the disc emission and helps heat the disc, so increasing the collisional part of the Fe-L emission which, for a temperature of 0.3 keV (the peak of the blackbody) peaks between 0.8 and 0.9 keV. Generating the appropriate grids of models for this is beyond the scope of the present work.
4.1 The spin of the black hole
The spectral fit shown in Fig. 6 requires a steep emissivity profile from which, if identified as the innermost stable circular orbit (ISCO), means that the black hole is close to maximal spin. Fitting the spectrum with the blurring kernel reflconv (Dauser et al 2010) we find the spin to be (see also Table 1).
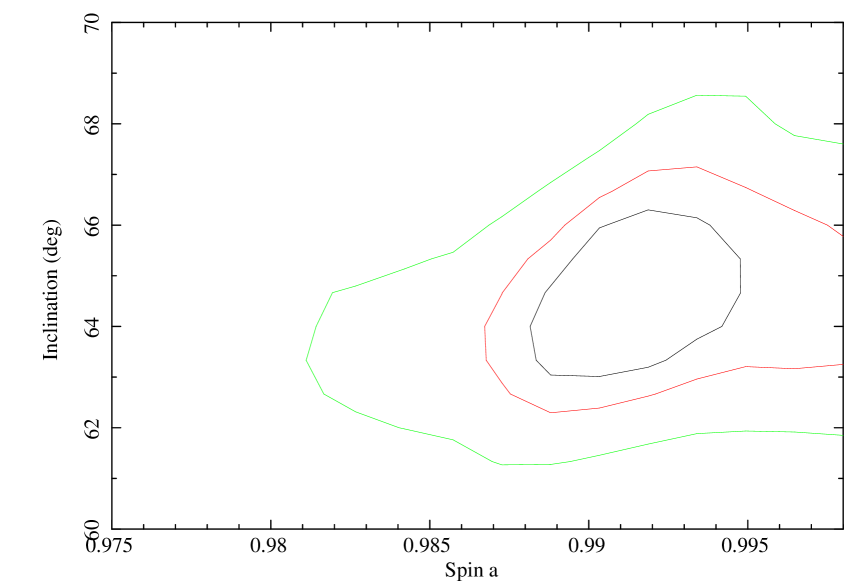
The value of spin is robust to changes in the model with differences in being less than one per cent in all models tried. A small improvement in is obtained by including a cold iron line (rest energy 6.4 keV); a slightly broad one with being preferred. Including a small edge at 1.15 keV produces a more significant drop in . This may indicate the presence of a hot wind, as found for 1H 0707-495 by Dauser et al (2012), or just be a deficiency in the model since it occurs where the reflection components are dropping steeply (particularly see Fig. 5). The variation of spin with inclination is shown in Fig. 8, where no strong correlation between these parameters is evident.
Although the statistical uncertainty on the measured spin is well below one per cent, there are larger systematic uncertainties which have yet to be determined. The most important is perhaps the implicit identification of the innermost radius of the reflector with the ISCO. Computations suggest that the uncertainty here is small and could be less than (Reynolds & Fabian 2008; Shafee et al 2008). The work of Schnittmann et al (2012) emphasises that emission from matter on plunge orbits is beamed mostly into the black hole. We note that the requirement for a low ionization component emphasises that the disc remains dense and thus thin within the final gravitational radius.
4.2 Inferring the position and size of the power-law source
The break in the emissivity profile at only indicates that the power-law source is close to the black hole, within a few gravitational radii, and thus must be small and confined within that radius (e.g. Wilkins & Fabian 2011, 2012).
Confirmation that the source is very close to the black hole comes from the reflection fraction. This is the ratio of the reflection components to the power-law component, normalized so that unity corresponds to a reflector subtending sr. This is not straightforward to calculate for a high source since the reflionx model does not tabulate the total flux, but only that above 0.1 keV (the flux at lower energies is of course included in the computations). We assess the reflection fraction by comparing the ratio of the amplitude of the Compton hump around 30 keV of the low ionization reflection component to the power law with that predicted by the pexrav model. The result is a reflection fraction of about 15, which is a strong indication of light bending close to the black hole (Martocchia & Matt 1996; Miniutti & Fabian 2004).
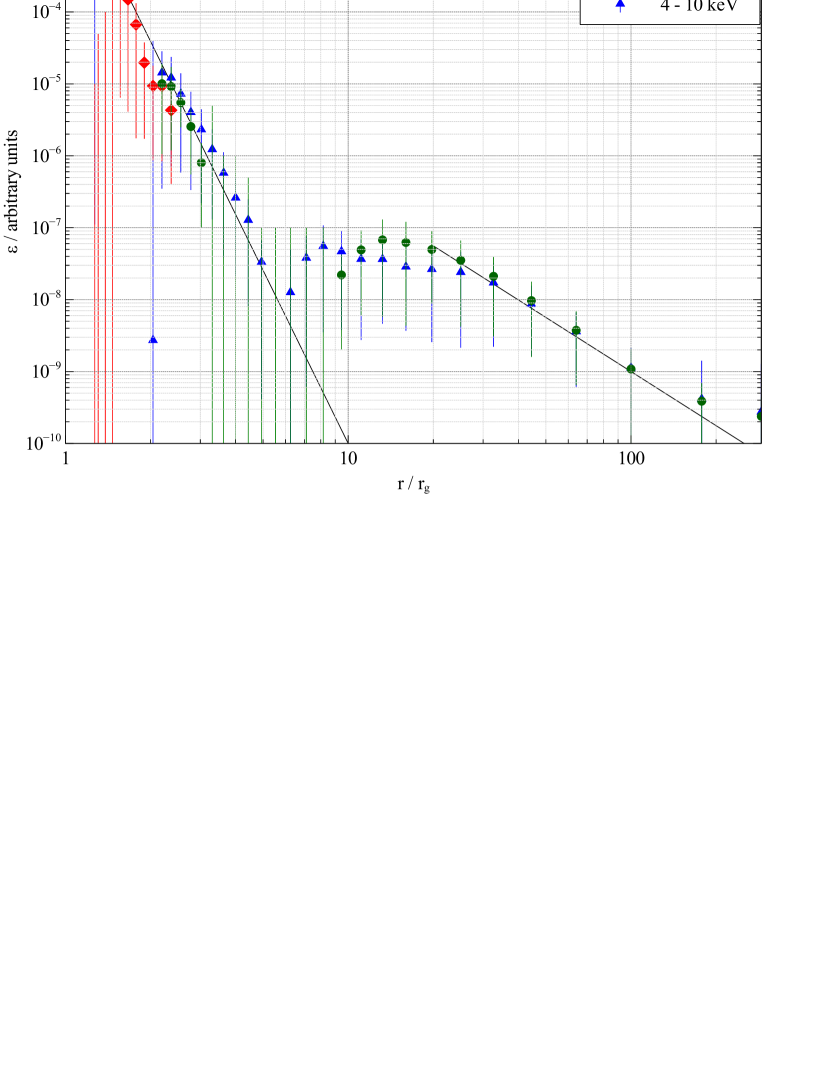
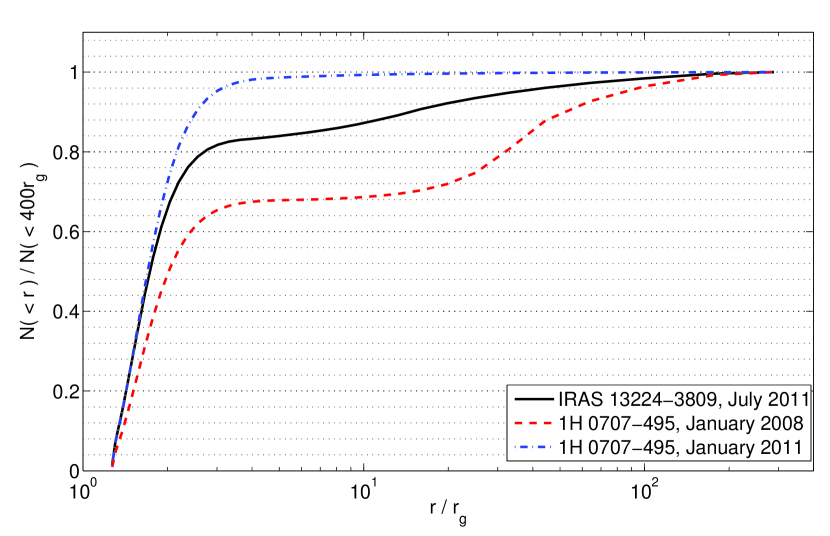
The emissivity profile has been determined in more detail by fitting the spectrum above 3 keV by the sum of relativistically-blurred emission profiles from contiguous radii of the disc (see Wilkins & Fabian 2010 for more details; the energy range is restricted to the Fe-K band as the Fe-L band consists of many overlapping emission lines). The result (Fig. 9, top panel) indicates a triple power-law emissivity profile, which integrates to show where the observed photons originate from on the disc (Fig. 9, lower panel). 80 per cent of the photons are reflected within about with the remaining 20 per cent mostly coming from within .
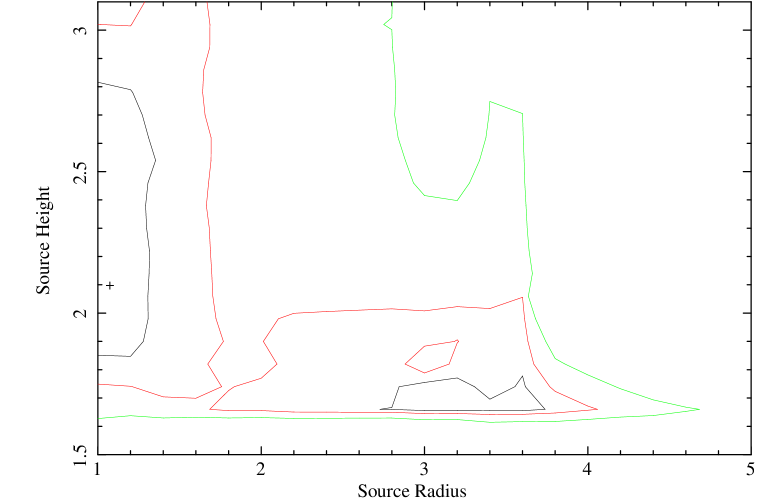
Motivated by this, in order to estimate the size and location of the major primary X-ray source, we generated a grid of emissivity profiles for a range of cylindrical X-ray source regions of varying radial extent and at varying heights above the plane of the accretion disc using the high speed GPU-based general relativistic ray tracing code of Wilkins & Fabian 2012. The grid consists of sources extending between 1 and radially, the bases of which are between 1.0 and above the plane of the accretion disc. Initially, the thickness of the source is set to be .
These emissivity profiles were then fitted to the profile of the Fe-K emission line using a modified version of the KDBLUR convolution model, leading to the constraints shown in Fig. 10. These fits imply the source is either radially extended to at a height of or extended out to around at a height of .
The integrated emissivity profile of IRAS 13224-3809 is compared with the normal and low state profiles of 1H 0707-495 in Fig. 9. It appears to be sandwiched between the two. This could be either due to the source always having two primary emission components, one compact as shown in Fig. 10 the second a more extended component, or to the source varying in size with time, the larger source likely being associated with the brighter phases. This will be investigated in later work.
5 Rapid variability and the soft lag
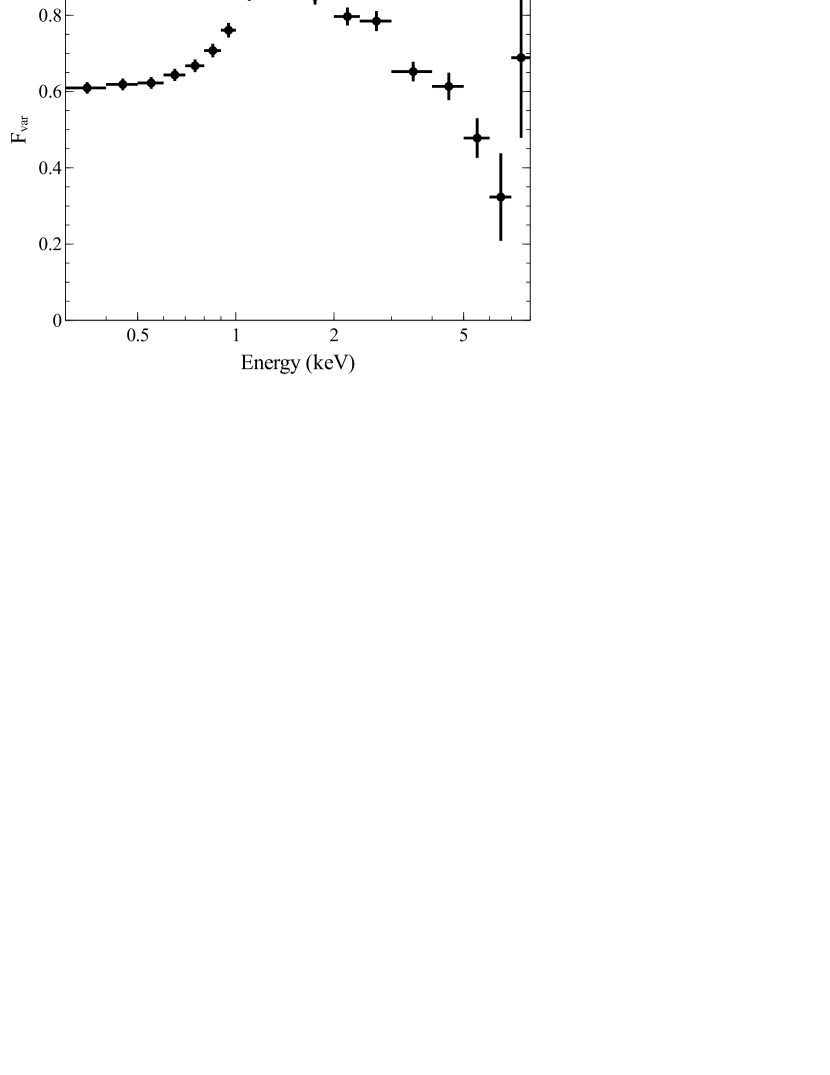
The fractional RMS variability spectrum, computed according to the prescription of Edelson et al (2002), is shown in Fig. 11. It resembles that of many other sources in which reflection is present, resembling a combination of variable power-law and reflection components. The amplitude of the variability of the power-law component needs to be greater than that of the reflection in order that the broad Fe-K line appears inerted in this Figure.
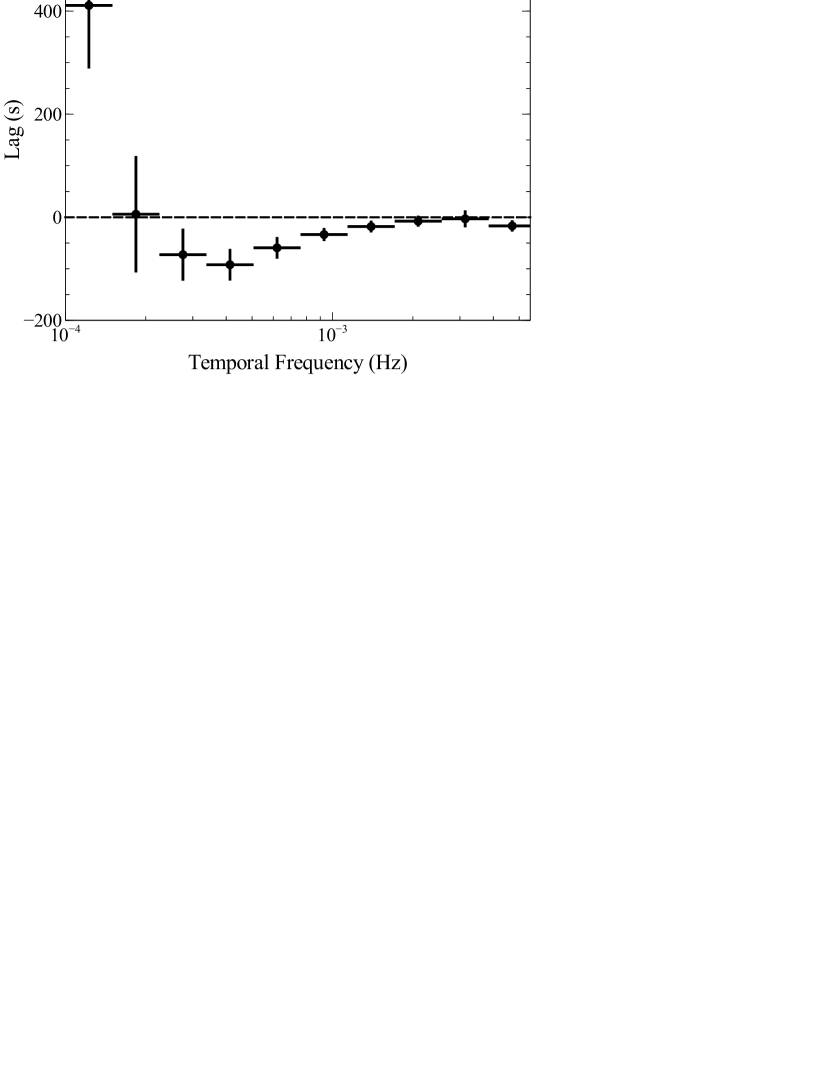
Using the light curves of the four orbits, we compute the Fourier phase lag between the hard and soft energy bands, following the technique described in (Nowak 1999). The background-subtracted light curve segments range in length from s to s with 10 s bins. The soft band is defined from 0.3 – 1 keV, where the soft-excess dominates the spectrum. The hard band, 1.2 – 5 keV, is dominated by emission from the power law continuum. From the Fourier transforms of the hard and soft band light curves, and respectively, we compute their phase difference, , where denotes complex conjugate. We convert this to a frequency-dependent time lag, . Using this sign convention, a negative lag means that the soft band light curve lags behind the hard band.
The results are show in the lag-frequency spectrum in Fig. 12. The hard flux lags behind the soft by hundreds of seconds at frequencies less than Hz. At frequencies . The light-crossing time of for a mass of is , so a total lag of 100 s or so is reasonable.
6 Discussion
IRAS 13224-3809 is remarkably similar in overall X-ray behaviour to 1H 0707-495. The variability of IRAS 13224-3809 may be the most extreme. We shall explore the behaviour of the source as a function of time and flux in more detail in later work.
The X-ray spectra of both sources require high iron abundance (). In recent work, Wang et al. (2012) have presented a strong correlation between metallicity, as measured by the Si iv O iv ] / C iv ratio, and outflow strength in quasars, as obtained via the blueshift and asymmetry index (BAI) of the C iv emission line. Their results indicate highly significant super–solar metallicity () for quasars with BAI. This results indicates that metallicity likely plays an important role in the formation and acceleration of quasar outflows as expected, for instance, if quasar outflows are predominantly line–driven.
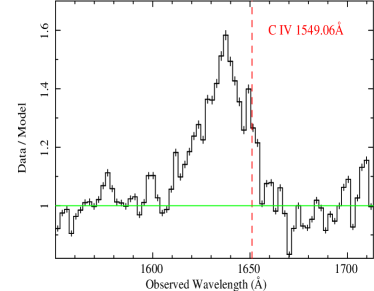
As mentioned above, both IRAS 13224–3809 and 1H 0707–495 are characterised by extremely blueshifted C iv emission lines with almost no contribution at rest wavelength. Their UV spectra indicate that BAI in both sources, as shown in Fig. 13. If the metallicity–BAI correlation of Wang et al. (2012) extends or saturates above their largest observed BAI (), one infers that IRAS 13224–3809 and 1H 0707–495 are characterised by . A strong indication for super–solar metallicity in both sources is consistent with the strong FeII lines in the optical spectra and was also inferred by Leighly (2004) via photoionisation modelling of the UV spectra.
A soft lag is detected, which is a direct prediction of the reflection modelling used for the source. With the many other lags now seen, this justifies the reflection spectrum approach. It is consistent with the spectral modelling which indicates that the bulk of the primary continuum emission source is only a few gravitational radii in size and distance from the black hole. The spin of the black hole is high and close to maximal. This may be the result of secular evolution dominating in Narrow-Line Seyfert 1 galaxies, as inferred by Orban de Xivry et al (2011).
Acknowledgements
ACF thanks the Royal Society for support. RCR thanks the Michigan Society of Fellows and NASA for support through the Einstein Fellowship Program, grant number PF1-120087. EK is supported by the Gates Cambridge Scholarship.
References
- [] Anders E., Grevesse N., 1989, GeCoA, 53, 197
- [] Arnaud K.A., 1996, ASPC, 101, 17
- [] Boller T., Brandt W.N., Fabian A.C., Fink H.H., 1997, MNRAS, 289, 393
- [] Boller T., Fabian A.C., Sunyaev R., Trümper J., Vaughan S., Ballantyne D.R., Brandt W.N., Keil R., Iwasawa K., 2002, 329, 1
- [] Boller T., Tanaka Y., Fabian A., Brandt W.N., Gallo L., Anabuki N., Haba Y., Vaughan S., 2003, MNRAS, 343, L89
- [] Brandt W.N., Boller T., Fabian A.C., Ruszkowski M., 1999, MNRAS, 303, L53
- [] Dauser T., Wilms J., Reynolds C.S., Brenneman L.W., 2010, MNRAS, 409, 1534
- [] De Marco B., Ponti G., Uttley P., Cappi M., Dadina M., Fabian A.C., Miniutti G., 2011, MNRAS submitted
- [] Dewangan G.C., Boller T., Singh K.P., Leighly K.M., 2002, A&A, 390, 65
- [] Edelson R., Turner T.J., Pounds K., Vaughan S., Markowitz A., Marshall H., Dobbie P., Warwick R., 2002, ApJ, 568, 610
- [] Emmanoulopoulos D., McHardy I.M., Papadakis I.E., 2011, MNRAS, 416, L94
- [] Fabian A.C., 1979, Proc. Roy. Soc., 366, 449
- [] Fabian A.C., Miniutti G., Gallo L., Boller T., Tanaka Y., Vaughan S., Ross R.R., 2004, MNRAS, 353, 1071
- [] Fabian A.C., et al 2009, Nature, 459, 540
- [] Fabian A.C., Ross R.R., 2010, Sp. Sci. Rev., 157, 167
- [] Fabian A.C. et al 2012, MNRAS, 419, 116
- [] Feain I.J. et al 2009, ApJ, 707, 114
- [] Gallo L., Boller T., Tanaka Y., Fabian A.C., Brandt W.N., Welsh W.F., Anabuki N., Haba Y., 2004, MNRAS, 347, 269
- [] Gaskell M., 2004, ApJ, 612, L21
- [] Jansen F., et al., 2001, A&A, 365, L1
- [Leighly & Moore(2004)] Leighly, K. M., Moore, J. R. 2004, ApJ, 611, 107
- [Leighly(2004)] Leighly, K. M. 2004, ApJ, 611, 125
- [] Martocchia A., Matt G., 1996, MNRAS, 282, L53
- [] Miniutti G., Fabian A.C., 2004, MNRAS, 349, 1435
- [] Mukai, K. 1993, Legacy 3, 21-31
- [] Nowak M. A. Vaughan B., Wilms, J., Dove J.B., Begeman M.C., 1999, ApJ, 510, 874
- [] Orban de Xivry G., Davies R., Scartmann M., Komossa S., Marconi A., Hicks E., Engel H., Tacconi L., 2011, MNRAS, 417, 2721
- [] Ponti G. et al 2010, MNRAS, 406, 2591
- [] Reynolds C.S., Fabian A.C., 2008, ApJ, 675, 1048
- [] Ross R.R., Fabian A.C., 2005, MNRAS
- [] Shafee R., Narayan R., McClintock J., 2008, ApJ, 676, 549
- [] Strüder L., et al., 2001, A&A, 365, L18
- [] Tripathi S., Misra R., Dewangan G., Rastogi S., 2011, ApJL 736, L37
- [Wang et al.(2012)] Wang, H., Zhou, H., Yuan, W., Wang, T. 2012, ApJ, 751, L23
- [] Wilkins D.R., Fabian A.C., 2010, MNRAS, 414, 1269
- [] Wilkins D.R., Fabian A.C., 2011, MNRAS, 424, 1284
- [] Zoghbi A., Fabian A.C., Uttley P., Miniutti G., Gallo L.C., Reynolds C.S., Miller J.M., Ponti G., 2010, MNRAS, 401, 2419
- [] Zoghbi A., Uttley P., Fabian A.C., 2011, MNRAS, 412, 59
- [] Zoghbi A., Fabian A.C., 2011, MNRAS. 418, 2642
- [] Zoghbi A., Fabian A. C., Reynolds C. S., Cackett E. M., 2012, MNRAS, 422, 129