Particle Scale Dynamics in Granular Impact
Abstract
We perform an experimental study of granular impact, where intruders strike 2D beds of photoelastic disks from above. High-speed video captures the intruder dynamics and the local granular force response, allowing investigation of grain-scale mechanisms in this process. We observe rich acoustic behavior at the leading edge of the intruder, strongly fluctuating in space and time, and we show that this acoustic activity controls the intruder deceleration, including large force fluctuations at short time scales. The average intruder dynamics match previous studies using empirical force laws, suggesting a new microscopic picture, where acoustic energy is carried away and dissipated.
pacs:
47.57.Gc, 81.05.Rm, 78.20.hbThe penetration of a dense granular material by a high-speed intruder occurs routinely in meteor and ballistic impacts. Many previous studies Euler1745 ; Poncelet1829 ; Allen1957 ; Forrestal1992 ; Tsimring2005 ; Katsuragi2007 ; Goldman2008 ; Goldman2010 , both recent and dating back to Euler and Poncelet, have used variations of a macroscopic force law:
| (1) |
Here, is the intruder depth relative to the top of the original, unperturbed surface (i.e., at initial impact), is the gravity force, characterizes hydrostatic effects, is often assumed constant, , and dots denote time derivatives. In Eq. (1), represents a coarse-grained collisional stress. We note that other effects, including a depth-dependent Coulomb friction term have been proposed Tsimring2005 ; Katsuragi2007 . Despite the success of extensive previous studies Euler1745 ; Poncelet1829 ; Allen1957 ; Forrestal1992 ; Tsimring2005 ; Katsuragi2007 ; Goldman2008 ; Goldman2010 ; Ciamarra2004 ; Ambroso2005 ; Bruyn2004 ; Walsh2003 ; Nelson2008 ; Newhall2003 ; Hou2005 , the connections between the local granular response, the microscopic processes responsible for dissipating kinetic energy, and the dynamics of the intruder are still subjects of debate, largely due to experimental difficulties in obtaining sufficiently fast data at small scales.
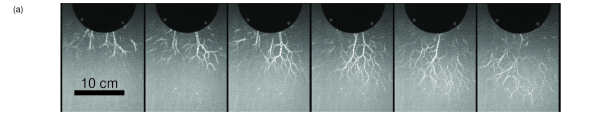
In this Letter, we address this issue experimentally by high-speed imaging of an intruder of mass, , which impacts a quasi-two-dimensional system of photoelastic particles (bidisperse, larger particle diameter ) at speeds m/s, yielding both the intruder dynamics and the force response of individual grains (Fig. 1). Here, as in many previous experiments, , where m/s is the granular sound speed, measured from photoelastic space-time plots, as in Fig. 1(b). The frame rates of capture the microscopic granular response. The primary intruder energy loss mechanism in these experiments is due to intense, intermittent acoustic pulses traveling at speeds along networks of grains, transmitting energy from the intruder into the medium. These pulses decay roughly exponentially with distance from the intruder. The force on the intruder is strongly fluctuating, due to the intermittency of the force network or acoustic activity, but the mean behavior is consistent with empirical models used previously Euler1745 ; Poncelet1829 ; Allen1957 ; Forrestal1992 ; Tsimring2005 ; Katsuragi2007 ; Goldman2008 ; Goldman2010 .
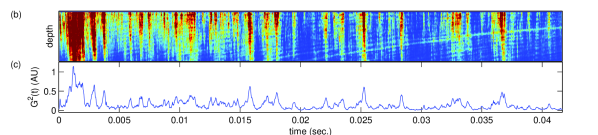
Experimental techniques.—The experimental apparatus consists of two thick Plexiglas sheets (0.91 m 1.22 m 1.25 cm), separated by a thin gap (3.3 mm) which is filled by photoelastic disks (thickness of 3 mm) of two different diameters (6 and 4.3 mm). These disks are cut from PS-1 material (Vishay Precision Group; bulk density of 1.28 g/cm3, elastic modulus of 2.5 GPa, and Poisson’s ratio of 0.38). Intruders are machined from a bronze sheet (bulk density of 8.91 g/cm3 and thickness of 0.23 cm) into disks of diameters of 6.35, 10.16, 12.7, and 20.32 (data for cm intruder used in images and time-series data shown here are typical for all ). These intruders are dropped from a height 2.2 m, through a shaft connected to the top of the thin gap containing the particles, producing an impact speed . Results are recorded with a Photron FASTCAM SA5, at a resolution of 256584 pixels ( pixels per ), at 40,000 frames per second. To locate and track the intruder, we use a circular Hough transform at each frame. Velocity and acceleration are calculated by numerical differentiation, with a low-pass filter, cutoff frequency of Hz ms ), applied with each derivative to reduce noise amplification. The frequency cutoff is as large as possible while maintaining a signal-to-noise ratio of 10:1. This yields intermediate time scale data for () and () which are still strongly fluctuating in time. Photoelastic images are normalized by a calibration image, taken before the intruder is dropped, to account for inhomogeneities in the light source. After this, the discrete gradient squared () of the image is computed by using the spatial variation of the image intensity ; the sum of the in a particular region measures the local force responseHowell1999 (i.e., beneath the intruder, as in Fig. 1). A static calibration covering the full range of encountered in any impact was performed by placing a weighted piston on a box of about 100 particles that are subject to the same light intensity as used in the experiments. As shown in Fig. 2(b), it is essentially linear.
Comparing to previous models.—An important question is whether the observed dynamics are consistent with existing models, i.e., Eq. (1). To address this, we consider the intruder trajectory and the filtered derivatives and . As noted, the derivatives, particularly , are strongly fluctuating, and these fluctuations are a physical aspect of the dynamics, as discussed below. Plots of versus data from different impacts with varying show good agreement, within fluctuations, with Eq. (1). This analysis yields and : a constant value for [i.e. ] after an initial transient at impact and , which is nearly linearly increasing in depth.
However, for any individual trajectory, we measure large fluctuations in (Fig. 2), on a scale that is comparable to the mean acceleration. These fluctuations are absent in the “slow-time” models discussed above, and their large amplitude is both a novel observation and a potential weak point of the models. That is, the braking of the intruder is not a smooth steady process but a series of events where the intruder is subjected briefly to large accelerations, followed by more quiescent periods that can be close to acceleration-free.
Connecting acoustic activity to intruder deceleration.—As noted, during an impact, we observe complex propagating force networks (known as force chains) generated intermittently at the leading edge of the intruder as it moves through the medium, as shown in Fig. 1(a), as well as in Supplemental Videos 1 and 2. To quantify the photoelastic response, we consider the angular region extending radially outward from the bottom half of the intruder over a length , forming a half-annulus. Figure 1(b) shows a space-time plot of the total photoelastic response in this region.
To relate the photoelastic activity to the acceleration fluctuations, we compare the total photoelastic response in the angular region immediately under the intruder to (Fig. 2). Photoelastic data are obtained at 40 kHz, which is about 500 times faster than the frequency cutoff for . Comparing to the photoelastic response requires time-filtering the photoelastic data such that the time scale matches that of . This gives a comparison at the intermediate time scale; a plot (Fig. 2) of and filtered data gives the same curve, showing that the two are virtually identical. For this comparison, we first normalized by a constant to obtain the optimum agreement between filtered and , but this normalization matches well with the static calibration of discussed above. (We used this double comparison to be sure that the static calibration matched well with the dynamics measurements.) We conclude that the large photoelastic events are the main force mechanism acting on the intruder. By inference, the energy loss for the intruder is tied to these acoustic events rather than, e.g., to frictional drag with the intruder.
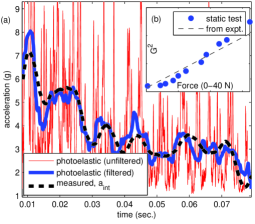
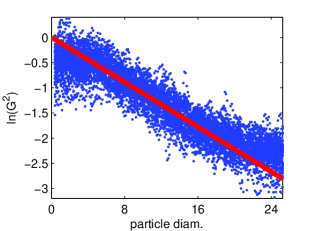
Acoustic dissipation.—Once the acoustic pulses have moved ahead of the intruder, there must be a loss mechanism of these disturbances within the material. Hence, it is important to examine how fast and how far the acoustic pulses propagate. To this end, we observe the photoelastic response in a long, thin angular slice, centered directly beneath the intruder with a width of , which extends 25 beneath the intruder. Space-time plots of the response in this region indicate a wave speed of about 325 m/s (1/10 of the sound speed in the bulk material from which the particles are cut). To determine the attenuation of the acoustic pulses, we plot normalized intensity versus depth. The normalization for each pulse is the cumulative photoelastic response over its full duration. The normalized photoelastic response averaged over multiple events shows an exponential decay (Fig. 3), with a decay length of 10 particle diameters, which is short enough that reflections from the bottom or sides of the container are not important. It is unclear which grain-scale interactions are responsible for this decay, but it could be explained by force-chain splitting, grain-grain friction, restitutional losses for each “collision,” or other dissipative mechanisms.
Fluctuation statistics and stochastic description.— Large fluctuations in the photoelastic response (Fig. 2) suggest a stochastic description, which captures mean behavior as well as short-time fluctuations. For example, one might modify Eq. (1) to
| (2) |
Here, is a multiplicative stochastic term, which should follow directly from microscopic physics and have a mean of unity. A multiplicative term is chosen here since rescaling by the mean photoelastic behavior yields a statistically stationary fluctuating term, as discussed below, and since fluctuations in dense granular systems often scale with the mean (as here).
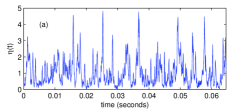
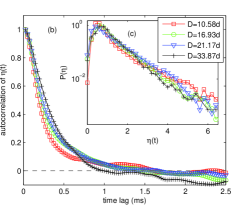
To experimentally characterize the fluctuations in Eq. (2), we write , where is the photoelastic time series used to measure force (e.g., bottom of Fig. 1) and is the mean behavior, obtained by fitting a low-order polynomial to . This yields a fluctuating term which appears statistically stationary throughout the duration of an impact, as shown in Fig. 4. Typically, has an autocorrelation decay time of 1 ms and a probability distribution function (PDF) that is nearly exponential. The PDF describes the likelihood of the large events which dominate the decelerating force. Such a PDF is typical for forces in static dense granular systems and is presumably related to the probability of generating force-chain-like structures.
Surprisingly, the fluctuation statistics show almost no dependence on intruder size. One might expect that the contact forces or force chains generated from two sufficiently separated points along the bottom of the intruder are uncorrelated. If so, increasing the intruder size would include more of these independent forces, which, by the central limit theorem, would yield smaller and more Gaussian-like fluctuations, regardless of the statistics of each one. However, this does not occur, suggesting a more subtle collective mechanism. One possibility is that spatially separated intruder-particle contacts often excite the same persistent force network.
Conclusion.—In this Letter, we present a new microscopic picture of the force on an intruder moving through a granular material, which focuses on acoustic activity and fluctuations due to the generation of force-chain-like pulses. We observe consistency with established impact force models but with substantial fluctuations in the measured deceleration of the intruder during the impact process. We have shown that the acceleration profiles, including these fluctuations, are a direct consequence of acoustic pulses transmitted along networks of particles. Other recent studies have indicated an important role for granular force networks in intruder impacts Kondic2012 and acoustic transmission Daniels2011 . The microscopic description presented here should also help connect granular impact experiments with differing microstructure, such as more dilute or compacted Goldman2010 ; Royer2005 or anisotropic (e.g., sheared) systems, or even more general experiments on granular flow around an obstacle. Strong force fluctuations suggest a stochastic model, which gives a natural way to separate the slowly varying macroscopic response from fast-time fluctuations. We believe that the granular sound speed is critical in our description, so we expect substantial differences when intruder speeds are close to sonic or even supersonic. This could be achieved by increasing intruder velocity or reducing the granular sound speed by using softer material. Also of interest is how these effects translate to three-dimensional systems or systems with a much larger ratio of intruder size to particle size.
This work has been supported by the U.S. DTRA under Grant No. HDTRA1-10-0021. We very much appreciate additional input from Dr. C. O’Hern and Dr. W. Losert.
References
- (1) L. Euler, Neue Grundsätze der Artillerie, reprinted in Opera Omnia. (Druck und Verlag Von B.G. Teubner, Berlin, 1922).
- (2) J. V. Poncelet, Cours de Mécanique Industrielle. (Lithographie de Clouet, Paris, 1829).
- (3) W. A. Allen, E. B. Mayfield, and H. L. Morrison, J. Appl. Phys., 28, 370 (1957).
- (4) M. J. Forrestal and V. K. Luk, Int. J. Impact Eng. 12, 427 (1992).
- (5) L. Tsimring and D. Volfson, in Proceedings of the International Conference on Powders and Grains (Taylor & Francis, London, 2005), Vol 2, pp. 1215-1223.
- (6) H. Katsuragi and D. J. Durian, Nature Phys. 3, 420 (2007).
- (7) D. I. Goldman and P. Umbanhowar, Phys. Rev. E 77, 021308 (2008).
- (8) P. Umbanhowar and D. I. Goldman, Phys. Rev. E 82, 010301(R) (2010).
- (9) M. P. Ciamarra, A. H. Lara, A. T. Lee, D. I. Goldman, I. Vishik, and H. L. Swinney, Phys. Rev. Lett. 92, 194301 (2004).
- (10) M. A. Ambroso, C. R. Santore, A. R. Abate, and D. J. Durian, Phys. Rev. E 71, 051305 (2005).
- (11) J. R. de Bruyn and A. M. Walsh, Can. J. of Phys. 82, 439 (2004).
- (12) A. M. Walsh, K. E. Holloway, P. Habdas, and J. R. de Bruyn, Phys. Rev. Lett. 91, 104301 (2003).
- (13) E. L. Nelson, H. Katsuragi, P. Mayor, and D. J. Durian, Phys. Rev. Lett. 101, 068001 (2008).
- (14) K. A. Newhall and D. J. Durian, Phys. Rev. E 68, 060301(R) (2003).
- (15) M. Hou, Z. Peng, R. Liu, K. Lu, and C. K. Chan, Phys. Rev. E 72, 062301 (2005)
- (16) D. Howell, R. P. Behringer, and C. Veje, Phys. Rev. Lett. 82, 5241 (1999).
- (17) L. Kondic, X. Fang, W. Losert, C. S. O’Hern, and R. P. Behringer, Phys. Rev. E 85, 011305 (2012).
- (18) K. E. Daniels, and E. T. Owens, Europhys. Lett. 94, 54005 (2011).
- (19) J. R. Royer, E. I. Corwin, A. Flior, M. L. Cordero, M. L. Rivers, P. J. Eng, and H. M. Jaeger, Nature Phys. 1, 164 (2005).