Alternative route to charge density wave formation in multiband systems
Abstract
Charge and spin density waves, periodic modulations of the electron and magnetization densities, respectively, are among the most abundant and non-trivial low-temperature ordered phases in condensed matter. The ordering direction is widely believed to result from the Fermi surface topology. However, several recent studies indicate that this common view needs to be supplemented. Here, we show how an enhanced electron-lattice interaction can contribute to or even determine the selection of the ordering vector in the model charge density wave system ErTe3. Our joint experimental and theoretical study allows us to establish a relation between the selection rules of the electronic light scattering spectra and the enhanced electron-phonon coupling in the vicinity of band degeneracy points. This alternative proposal for charge density wave formation may be of general relevance for driving phase transitions into other broken-symmetry ground states, particularly in multiband systems such as the iron based superconductors.
pacs:
71.45.Lr, 78.30.-j, 63.20.kd, 64.70.K-I Introduction
The common view of charge density wave (CDW) formation was originally posed in the work by Kohn Kohn:1959 . Using Kohn’s reasoning Kohn:1959 , the tendency towards ordering is particularly strong in low dimensions, because the Fermi surface has parallel parts, referred to as nesting. This nesting leads to a divergence in the Lindhard susceptibility, determining the magnitude and direction of the ordering vector QGruner:1994 . This divergence in the electronic susceptibility is conveyed to the lattice via the electron-phonon coupling, so that a phonon softens to zero frequency at Q and a static lattice distortion develops when the system enters the CDW state; a behavior known as the Kohn anomaly.
However, several publications raise the question as to whether nesting alone is sufficient to explain the observed ordering direction Q Mcmillan:1977 ; Varma:1983 ; Yao:2006 ; Kiss:2007 ; Johannes:2008 , particularly in dimensions higher than one. A central question is whether the selection of the CDW ordering vector is always driven by an electronic instability, or if the ordering vector could instead be determined by a lattice distortion driven by some other mechanism exploiting the role of the electron-phonon coupling. In the latter case, the selected ordering vector would not necessarily nest the Fermi surface. The importance of strongly momentum dependent electron-phonon coupling on CDW formation was pointed out in Refs. Mcmillan:1977, and Varma:1983, , where the relevance of the Fermi surface for determining the ordering vector was indeed found to decrease as the coupling strength increases. In a recent paper on inelastic x-ray scattering measurements on 2-NbSe2, acoustic phonons were observed to soften to zero frequency over an extended region around the CDW ordering vector Weber:2011 . The authors argue that this behavior is not consistent with a Kohn anomaly picture, where sharp dips are expected. Therefore, the phonon softening must be driven by another mechanism, which they identify as a wavevector-dependent electron-phonon coupling. In addition, previous studies on chromium Lamago:2010 and ruthenium Heid:2000 have also shown dips in phonon dispersions arising from such anisotropic electron-phonon matrix elements.
For exploring a possible relation between anisotropic electron-phonon coupling and CDW ordering selection, it is desirable to map out the coupling strength in momentum space. For certain types of phonons, the electron-phonon matrix element is proportional to the electron-photon matrix element from Raman spectroscopy. As a result, Raman spectroscopy, which efficiently projects out different regions of the Brillouin zone with different photon polarizations, can provide an indirect method for investigating the momentum-dependence of the electron-phonon coupling in a system.
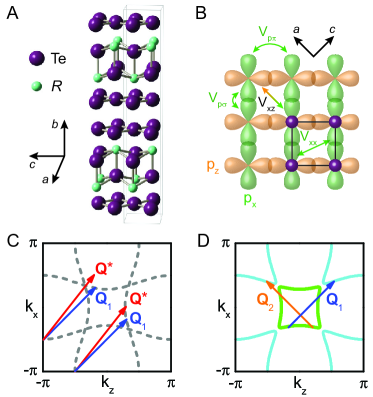
To set the stage for our discussion, we introduce the two-dimensional rare-earth tri-tellurides (Te3), as shown in Fig. 1A. Among them the prototypical ErTe3 (see Appendix A) undergoes a first CDW transition at K, followed by a second one at K and allows a robust access to its intrinsic CDW properties. The ordering vectors and are parallel to but incommensurate with the reciprocal lattice vectors and , respectively Ru:2006 ; Brouet:2008 ; Ru:2008a ; Yusupov:2008 ; Schmitt:2008 ; Lavagnini:2008 ; Lavagnini:2010 ; Pfuner:2010 ; Lazarevic:2011 ; Hu:2011 . The electronic properties of these layered CDW compounds can be modeled by considering a single Te plane [Fig. 1B and Appendix C: Supporting Information (SI)]. The two dominant hopping terms are and along and perpendicular to the overlapping or orbitals, respectively, leading to slightly warped Fermi surface planes (Fig. 1C). For this band structure, Yao and coworkers Yao:2006 studied the influence of band-filling and electron-phonon coupling strength on the charge ordering and established a strong coupling limit for the experimentally observed stripe-like CDW state. Additionally, Johannes and Mazin Johannes:2008 found that the Lindhard susceptibility has peaks of comparable size at the nesting vector predicted from the band structure, and at the CDW ordering vector , determined experimentally in Te3 Ru:2008a (Fig. 1C). This is quite similar to a recent observation in NbSe2 Kiss:2007 . The inclusion of a small but non-zero hopping term between and , , lifts the degeneracy at the intersection points of the two quasi 1D Fermi surfaces, as emphasized in Fig. 1D, and improves the agreement with the experimental Fermi surface, even though remains the best nesting vector Brouet:2008 . Therefore, mechanisms beyond purely electronic ones have been conjectured to play an important role in selecting the ordering vector and in density wave formation. These include orthorhombicity, the tendency towards phase separation and nematicity via the Coulomb interaction, strongly momentum dependent electron-phonon interaction due to peculiarities of the band structure, breakdown of the Coulomb screening and other competing instabilities, such as magnetism Yao:2006 ; Johannes:2008 ; Emery:1990 ; Marder:1990 ; Grilli:1991 ; Kivelson:2003 .
In this Research Report, we analyze data from Raman experiments and the related selection rules for ErTe3 and demonstrate that the lifting of band degeneracies enhances the light-scattering sensitivity and, concomitantly, the electron-phonon coupling at ordering vectors that do not coincide with those vectors predicted by nesting alone.
II Results
II.1 Fluctuation regime above the CDW transition temperature
We first display the low frequency Raman spectra above in Fig. 2. The narrow lines superposed on the continuum are the Raman-active phonons of the high-temperature phase Lavagnini:2008 . Instead of the expected flat continuum Kostur:1992 , strongly temperature dependent shoulders, emerging from the normal metallic response, are observed for K in the low-energy part of the spectra (Figs. 2A and B). These excitations have similar intensity in and polarization configurations (defined in the Appendix A), soften and get stronger upon approaching from higher temperatures. Above 300 K the spectra are essentially temperature independent as expected for a metal with an almost constant resistivity Ru:2008a .
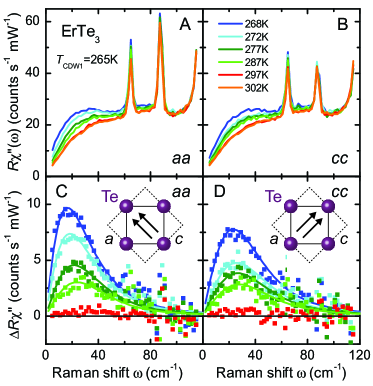
In Fig. 2C and D we show the strongly temperature dependent parts of the spectra alone which closely follow the prediction of Caprara and coworkers for the exchange of fluctuations Caprara:2005 . A fluctuation regime, suppressing below the mean field transition temperature and out of which the CDW state emerges, is expected to exist at temperatures well above , particularly in our case with a large ratio being approximately four times the canonical mean field value of 3.53 Gruner:1994 . Signatures of such CDW precursor effects were indeed observed by x-ray diffraction Ru:2008a and by optical (IR) spectroscopy Pfuner:2010 ; Hu:2011 . Here, we further reveal the nature and the symmetry properties of the fluctuations; our observations are compatible with the channel, which indicates the survival of the C4 rotational symmetry of the pseudo-tetragonal phase. [The in-plane lattice parameters are almost identical; therefore, the Te planes are essentially square (C4-symmetric), although the structure is fundamentally orthorhombic because of the glide plane between adjacent Te layers.] The survival of the C4 rotational symmetry excludes the presence of precursor effects due to nematic order, as, e.g., intensively debated in the cuprates Kivelson:2003 ; Benfatto:2000 , which would appear in symmetry.
II.2 CDW amplitude mode excitations and electron-phonon coupling strength
Immediately below the amplitude mode (AM) of the CDW pops up and gains intensity with decreasing temperature, shown as peak in Fig. 3. The AM appears in both polarizations, and , with an intensity ratio of 2:1. Upon further cooling the AM moves to higher energies, couples to phonons Lazarevic:2011 , and gains more than one order of magnitude in intensity Lavagnini:2010 . At the lowest temperature it saturates at (Fig. 3C, peak ). The relation Gruner:1994 at between the energy of the AM and the un-renormalized CDW phonon energy (, Ref. Lavagnini:2008, ) leads to . In contrast to superconductors is already in the strong coupling regime, since it is well beyond the threshold of 0.103, which separates nematic from stripe order Yao:2006 . As shown in the inset of Fig. 3C the second AM (peak ) is fully polarized and saturates at 38. Another mode (peak in Fig. 3C) with resolution-limited width appears at . The full analysis yields tetragonal symmetry, and the energy corresponds to the beat frequency of the two amplitude modes to within the experimental error. Microscopically, the coupling between collective states may result from eigenvector mixing or because the two condensates share common parts of the Fermi surface Littlewood:1981 ; Browne:1983 ; Tutto:1992 .
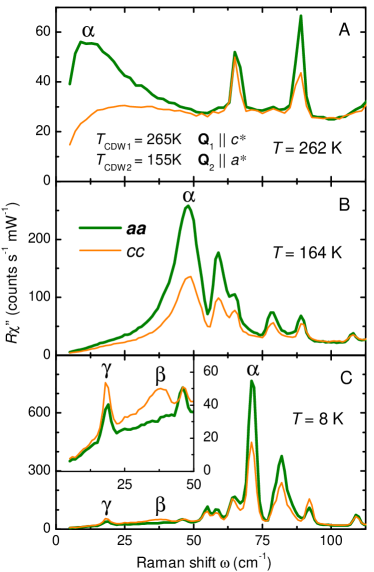
II.3 Temperature dependence and anisotropy of the CDW gap
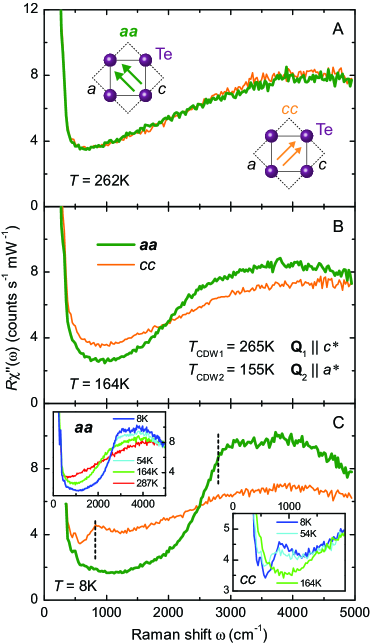
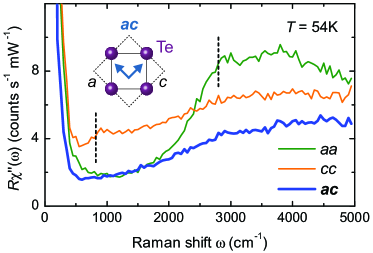
Fig. 4 depicts the electronic Raman response of ErTe3 at various temperatures below . The spectra at 262 K (Fig. 4A) are isotropic, rise almost linearly between 800 and 3500 and finally become flat. Upon lowering the temperature there is a transfer of spectral weight in the spectrum from low to high energies (Fig. 4B and C). At 8 K (Fig. 4C), there is a relatively weak new structure in the spectrum in the range 500-1200 . The insets in Fig. 4C highlight the temperature dependences of the and polarized spectra right above and below and , respectively. In either case, spectral weight is progressively suppressed below the gap edges and piles up above. As opposed to the AMs (Fig. 3), there is a full anisotropy without any leakage between the two orthogonal and directions, indicating that the crystal is single domain in the probed spot. Single domain areas were already observed in an earlier angle-resolved photoemission spectroscopy (ARPES) experiment on ErTe3 Moore:2010 . We identify the edges with twice the maximum gap energies of the first and the second CDW, and , respectively, in agreement with ARPES findings Moore:2010 .
II.4 Raman selection rules and anisotropic electron-lattice coupling
We now elaborate on the remarkable selection rules described in the preceding paragraph (Fig. 4) and relate them to hybridization effects of the band structure. In addition and more importantly, we demonstrate that the selection rules and the strong anisotropy of the electron-phonon coupling, which influences the CDW ordering, are intimately connected and just two sides of the same coin.
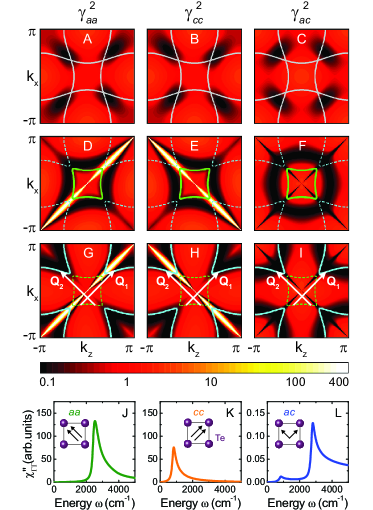
The electronic Raman response including the selection rules can be derived directly from the band structure and the momentum dependences of the CDW gaps using the formalism of Ványlos and Virosztek Vanyolos:2005 . The intensity of the light scattering for different polarization combinations (Raman vertices) are mainly determined by the curvature of the electronic dispersion, as described in detail in Ref. Devereaux:2007, . If we neglect hybridization (, see Fig. 1B), the Raman vertices are almost featureless with little highlights in particular regions of the Fermi surface, as illustrated in Fig. 5A-C for the , and polarizations. Upon including hybridization, the band degeneracy is lifted (Fig. 1D), and the two bands exhibit strong curvatures (Fig. 1D and Fig. 7 in SI). As a result, the vertices become highly focused along the diagonals of the Brillouin zone for parallel polarizations, as shown in Fig. 5D, E and G, H for both bands, because of nearly singular band curvature Mazin:2010a . This focusing enhances the light scattering precisely at the Fermi surface points connected by the CDW ordering wavevectors.
The focusing effect on the electronic spectra can be demonstrated directly via the weak-coupling Raman response [see SI, Eq. (C.2)]. We assume that at the two perpendicular CDWs with ordering vectors and have fully developed gaps and , respectively. The and vectors connect the corners of the electron pocket around the point with the corners of the hole pockets (Fig. 1 and Fig. 5). The response for the , , and polarization orientations is shown in Fig. 5J-L. No mixing can be observed in the spectra with parallel polarizations (panels J and K). In the configuration both gaps are in principle visible (panel L), but the expected intensity is three orders of magnitude smaller than in and and cannot be observed in the experiment (see Fig. 8 in SI).
As we do not include any other scattering mechanisms, phase space restricts the non-resonant creation of electron-hole excitations to points where the CDW mixes particles with wavevectors k and across the Fermi surface. Consequently, light scattering is enhanced where energy is gained due to the CDW gap opening at the Fermi surface (Fig. 5J-L). Raman scattering efficiently projects out the relevant parts of the Brillouin zone in such a multiband system, so that the signal is small at low energies below the gap edge but is significantly enhanced at twice the CDW gap (Fig. 5J-L), in agreement with our experiment (Fig. 4C).
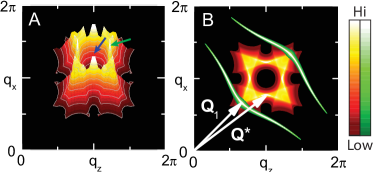
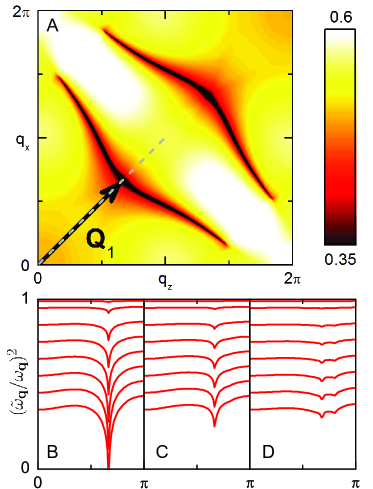
Obviously, the lifting of band degeneracies dramatically affects the Raman selection rules by locally enhancing the Raman vertex (Fig. 5) which is proportional to the inverse effective mass tensor Devereaux:2007 . Now we make use of an analogy between electron-phonon and electron-photon scattering, where the electrons scatter from a phonon rather than a photon and the electron-phonon coupling vertex replaces the Raman vertex Devereaux:1992 . In particular, for the case of stress phonons, the electron-phonon coupling vertex is given by the electronic stress tensor, which is proportional to the inverse effective mass tensor Shastry:1990 ; Einzel:2008 ; Miller:1967 ; Keck:1976 . As a result, for the system studied here, the electron-phonon coupling vertex, like the Raman vertex, is highly anisotropic in momentum space. While the Lindhard susceptibility is relevant for a momentum-independent electron-phonon coupling, in this case we must include the momentum dependent electron-phonon coupling vertex into the electronic susceptibility; we call this susceptibility (see Appendix B and Appendix C: SI) Varma:1977 . Fig. 6 illustrates the importance of including the electron-phonon coupling vertex, where we compare the real parts and of both susceptibilities. Whereas the Lindhard susceptibility has maxima of comparable height for several different ordering vectors (Fig. 6A) and therefore does not lead to an unambiguous selection of one of them, contributes to the instability at the proper location in q space and finally selects the experimentally observed ordering vector Q1 (Fig. 6B). Here, q is the difference of the momenta k and of a scattered electron. Furthermore, as noted by Yao et al. Yao:2006 , any enhancement of the averaged electron-phonon coupling strength (definition in SI) will drive the system further towards the observed order. These two effects conspire to minimize the dependence on model details.
III Discussion
The huge modulation of the Raman vertex indicates strong fluctuations of the charge density in the vicinity of the degeneracy points. These fluctuations manifest themselves in the Raman response above (Fig. 2) where the lattice still has the full C4 symmetry. Yao and coworkers showed in the framework of a Landau expansion of the free energy Yao:2006 that both charge fluctuations and electron-phonon coupling cooperate to drive the system towards the experimental ordering vector. The substantial charge fluctuations couple to and soften the phonon relevant for the CDW ordering. Taking into account the large electron-phonon coupling near the band degeneracy points (Fig. 5), the charge fluctuations actually renormalize the phonon frequency at the momenta rather than Q∗ (and the equivalent orthogonal vector). Below , the weak orthorhombicity along with the relatively large electron-phonon coupling Yao:2006 then tips the balance, and Q1 aligns along rather than . Finally, upon further lowering the temperature below aligns along since the Fermi surface along the direction is already fully gapped by the first transition Ru:2008a ; Moore:2010 .
Therefore, we identify two cooperating effects determining the overall selection of the ordering vector: (i) The system gains energy by gapping the band degeneracy points on the Fermi surface where the Raman selection rules indicate substantial fluctuations with fourfold symmetry above . (ii) Since the electron-phonon coupling vertex is proportional to the Raman vertex for stress phonons Shastry:1990 ; Miller:1967 , both quantities are enhanced near band degeneracies. For small hybridization and an electron-phonon coupling strength of the focussing effect may even be the most relevant contribution to the phonon renormalization, and thus the CDW formation, while it is only a correction for larger . Hence, while electron-phonon coupling is known to be important in CDW systems Mcmillan:1977 ; Varma:1983 ; Yao:2006 , we identify on a microscopic basis the focussing effect to be a more generic paradigm for multiband materials. As a future outlook, it seems particularly interesting to explore this novel scenario in the proximity of superconductivity, eventually competing or coexisting with CDW order. In fact, superconductivity at approximately appears in some of the rare earth tri-tellurides if the CDW is suppressed by applied pressure Hamlin:2009 ; Maple:2012 . Moreover, it would be intriguing to address in a wider context the effects of band hybridization in materials such as the iron-based superconductors Mazin:2010a , in which density-wave order and superconductivity interplay on a microscopic scale.
Acknowledgements.
We benefited from discussions with B. Moritz, R. G. Moore, and B. Muschler and thank T. Böhm for assistance. R.H. thanks the Stanford Institute for Materials and Energy Sciences, where part of the paper was completed, for its hospitality. A.F.K. and T.P.D. thank the Walther Meissner Institut for its hospitality. Financial support from Deutsche Forschungsgemeinschaft Grant HA 2071/5-1 and the Collaborative Research Center TRR 80 is gratefully acknowledged. L.D. acknowledges support by the Swiss National Foundation for the Scientific Research within the pool, ”Materials with Novel Electronic Properties” of the National Centres of Competence in Research network. E.A.N., A.F.K., T.P.D., J.-H.C., J.G.A., and I.R.F. acknowledge support from US Department of Energy, Basic Energy Sciences, Materials Sciences and Engineering Division Contract No. DE-AC02-76SF00515.References
- (1) W. Kohn, Phys. Rev. Lett. 2, 393 (1959).
- (2) G. Grüner, in Density Waves in Solids, edited by D. Pines (Addison-Wesley, Reading, MA, 1994).
- (3) W. L. McMillan, Phys. Rev. B 16, 643 (1977).
- (4) C. M. Varma and A. L. Simons, Phys. Rev. Lett. 51, 138 (1983).
- (5) H. Yao, J. A. Robertson, E.-A. Kim, and S. A. Kivelson, Phys. Rev. B 74, 245126 (2006).
- (6) T. Kiss et al., Nat. Phys. 3, 720 (2007).
- (7) M. D. Johannes and I. I. Mazin, Phys. Rev. B 77, 165135 (2008).
- (8) F. Weber et al., Phys. Rev. Lett. 107, 107403 (2011).
- (9) D. Lamago et al., Phys. Rev. B 82, 195121 (2010).
- (10) R. Heid, L. Pintschovius, W. Reichardt, and K.-P. Bohnen, Phys. Rev. B 61, 12059 (2000).
- (11) N. Ru and I. R. Fisher, Phys. Rev. B 73, 033101 (2006).
- (12) V. Brouet et al., Phys. Rev. B 77, 235104 (2008).
- (13) N. Ru et al., Phys. Rev. B 77, 035114 (2008).
- (14) R. V. Yusupov et al., Phys. Rev. Lett. 101, 246402 (2008).
- (15) F. Schmitt et al., Science 321, 1649 (2008).
- (16) M. Lavagnini et al., Phys. Rev. B 78, 201101 (2008).
- (17) M. Lavagnini et al., Phys. Rev. B 81, 081101 (2010).
- (18) F. Pfuner et al., Phys. Rev. B 81, 195110 (2010).
- (19) N. Lazarević, Z. V. Popović, R. Hu, and C. Petrovic, Phys. Rev. B 83, 024302 (2011).
- (20) B. F. Hu et al., Phys. Rev. B 84, 155132 (2011).
- (21) V. J. Emery, S. A. Kivelson, and H. Q. Lin, Phys. Rev. Lett. 64, 475 (1990).
- (22) M. Marder, N. Papanicolaou, and G. C. Psaltakis, Phys. Rev. B 41, 6920 (1990).
- (23) M. Grilli et al., Phys. Rev. Lett. 67, 259 (1991).
- (24) S. A. Kivelson et al., Rev. Mod. Phys. 75, 1201 (2003).
- (25) V. N. Kostur, Z. Phys. B 89, 149 (1992).
- (26) S. Caprara, C. Di Castro, M. Grilli, and D. Suppa, Phys. Rev. Lett. 95, 117004 (2005).
- (27) L. Benfatto, S. Caprara, and C. Di Castro, Eur. Phys. J. B 17, 95 (2000).
- (28) P. B. Littlewood and C. M. Varma, Phys. Rev. Lett. 47, 811 (1981).
- (29) D. A. Browne and K. Levin, Phys. Rev. B 28, 4029 (1983).
- (30) I. Tüttő and A. Zawadowski, Phys. Rev. B 45, 4842 (1992).
- (31) R. G. Moore et al., Phys. Rev. B 81, 073102 (2010).
- (32) A. Ványolos and A. Virosztek, Phys. Rev. B 72, 115119 (2005).
- (33) T. P. Devereaux and R. Hackl, Rev. Mod. Phys. 79, 175 (2007).
- (34) I. I. Mazin et al., Phys. Rev. B 82, 180502 (2010).
- (35) T. P. Devereaux, Phys. Rev. B 45, 12965 (1992).
- (36) B. S. Shastry and B. I. Shraiman, Phys. Rev. Lett. 65, 1068 (1990).
- (37) D. Einzel and L. Klam, J. Low Temp. Phys. 150, 57 (2008).
- (38) P. B. Miller and J. D. Axe, Phys. Rev. 163, 924 (1967).
- (39) B. Keck and A. Schmid, J. Low Temp. Phys. 24, 611 (1976).
- (40) C. M. Varma and W. Weber, Phys. Rev. Lett. 39, 1094 (1977).
- (41) J. J. Hamlin et al., Phys. Rev. Lett. 102, 177002 (2009).
- (42) M. B. Maple et al., EPJ Web of Conferences 23, 00012 (2012).
Appendix A Samples and experimental technique
Well characterized single crystals of ErTe3 were grown by slow cooling of a binary melt as described elsewhere Ru:2006 ; Ru:2008a . ErTe3 is a particularly well ordered system. In the - plane, the resistivity varies only slowly above and is very small in the limit Ru:2008a . The crystals were cleaved before being mounted into the cryostat.
The imaginary part of the Raman response is measured for various polarization combinations of incoming and scattered photons ( and ) referred to as , , and using Porto notation. Symbolic representations by two arrows in the Te plane are shown along with the spectra. Usually, more than one symmetry component is projected out at a given polarization . The pure symmetries correspond to specific eigenvectors in the case of phonons and to separate regions in the Brillouin zone for electron-hole excitations Devereaux:2007 . In this publication we show predominantly spectra with and polarizations which comprise and symmetry components in a tetragonal lattice and the symmetry on an orthorhombic lattice. In either case, the response has C2 symmetry.
For the experiments we made use of a solid state laser emitting at 532.3 nm (KLASTECH SCHERZO 300) for excitation. The absorbed laser power ranged from 1 to 2 mW to keep the local heating below 5 K in the m2 sized focus. The spectra were measured with a resolution of 2.5 at low energy and 20 at high energy. The Raman response is then obtained by dividing the measured spectra by the thermal Bose factor . is a constant which absorbs experimental factors and takes care of the units.
Appendix B Theory
As noted in the main text, the anisotropic electron-phonon coupling vertex must be included in the electronic susceptibility. For the case of stress phonons, the electron-phonon coupling and Raman vertices are related via Shastry:1990 ; Keck:1976 , where sets the strength of the overall electron-phonon interaction. We therefore define the projected electronic susceptibility as
| (1) |
where are the two bands and are the fully symmetric effective mass vertices derived in the SI. We consider only interband contributions which are generally accentuated by nesting as shown in Fig. 1C. Here we wish to explore how nesting and anisotropic electron-phonon coupling conspire to ultimately select the experimentally observed ordering vector . leads to a significant phonon-softening at the wavevector connecting the corners of the Fermi surface, where the band degeneracy is lifted. The effect is very sensitive to the hybridization parameter . Results for a set of hybridization parameters are shown in Fig. 9.
Appendix C Supporting information
C.1 Raman scattering and band structure
For the case of non-resonant light scattering, the Raman cross section in the limit of small momentum transfer is given in terms of correlation functions of an effective charge density Devereaux:2007 ,
| (2) |
where () creates (removes) an electron with momentum and spin in (from) band . In principle, the scattering amplitude depends on both the incoming (scattered) light polarizations and frequencies . However, in the limit where are much smaller than any relevant interband transition frequency, the scattering amplitude simplifies to the well known tensor of the inverse effective mass,
| (3) |
Thus the curvature of the bands and the light polarization orientations determine which carriers are involved in light scattering in different bands and regions of the Brillouin zone.
The tri-telluride band structure for the two bands cutting the Fermi level is well described by a tight binding model that only includes the Te and orbitals Brouet:2008 . All expressions in this paper are given for coordinates in the unit cell defined by the square lattice of Te atoms (Fig. 1B).
The real space Hamiltonian can be expressed as
| (4) | |||||
where creates an electron at site in orbital . It includes both nearest and next-nearest neighbor hopping matrix elements of one tellurium plane, as denoted in Fig. 1B. Fourier transforming Eq. (4) leads to the two bands , where and label the electron and the hole band, respectively,
| (5) |
With the Te-Te distance set to unity, the energies read
| (6) |
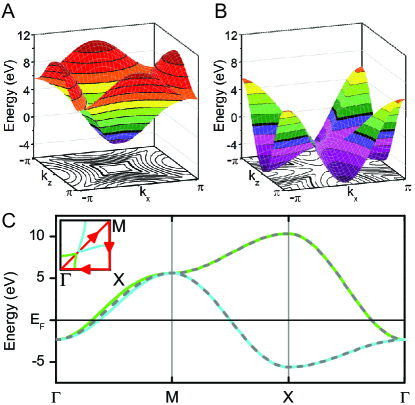
Using the experimental distances between the rare-earth and the Te ions of 4.34 and Å, respectively, the hopping matrix elements are eV. The diagonal hopping integrals are chosen to be eV. This parameter choice is motivated in order to most closely match the Fermi surfaces derived from angle-resolved photoemission spectroscopy (ARPES) Moore:2010 . The chemical potential is chosen to yield a filling of 1.6 electrons/band. Any small interaction (here we focus on inter-orbital hybridization ) leads to sharp corners in the electron and hole band, displayed separately in Fig. 7A and B, respectively. This hybridization thus lifts the band degeneracy along the Brillouin zone cut with respect to the case, as shown in Fig. 7C.
Finally, we shall note that a more accurately derived tight-binding representation would require the inclusion of further hopping matrix elements that could affect the overall curvature of the bands. Furthermore, another larger unit cell taking into account the Te double layers is usually considered for addressing the ARPES results Brouet:2008 . While these latter issues would allow a fine tuning of the calculations, we trust that this would not alter the main conclusion of our work, effectively based on a simplified tight-binding approach for a small unit cell.
C.2 Weak-coupling Raman response
The Hamiltonian for a system with two CDWs can be expressed in Nambu notation as , where
| (7) |
This Hamiltonian is defined in terms of the spinor where destroys an electron in band with momentum k and spin . The matrix is given by
| (14) |
where the diagonal elements correspond to the quasiparticle energies at , , and , and is the CDW gap. For Q and we use , , and cm-1 and cm-1, respectively. The expansion is truncated after the first harmonic although higher order terms should be included for the incommensurability of Brouet:2008 .
Computing the matrix Green’s function and taking into account the Raman vertices leads to the Raman response Vanyolos:2005 ; Devereaux:2007
Here, and are the external and internal Matsubara frequencies, respectively, , and Tr denotes the trace.
The Raman vertex is
| (22) |
with labeling the effective mass vertices [Eq. (3)] derived from [Eq. (5)]. Eq. (C.2) can be evaluated by diagonalizing the Green’s functions before calculating the trace, which simplifies the analytic structure of the expression and allows us to express the response as a sum of Lindhard-like terms.
C.3 Effect of near band degeneracies on the phonon spectrum
We recall that in a conventional electron-phonon coupling scenario, a divergence in the electronic susceptibility is translated into the phonon dispersion via the electron-phonon coupling Kohn:1959 . With increasing interaction , the phonon frequency of a branch is first renormalized in a wide range of momenta, then softens and finally exhibits a discontinuous derivative at wave vectors Q that nest the Fermi surface. A phonon that softens to zero frequency at a certain wave vector thus signifies the formation of a static lattice distortion, or CDW with that ordering vector.
The renormalized phonon frequency is given by Gruner:1994
| (23) |
where
| (24) |
is the electronic susceptibility. in Eq. (24) sets the overall strength of the electron-phonon interaction. The phonon renormalization is expected to be quite relevant in the tri-tellurides, since Raman experiments have established a strong connection between the CDW gap and lattice distortions Lavagnini:2008 .
We now examine the effect of charge fluctuations on the phonon renormalization. We start with the original proposal by Kohn, Kohn:1959 where the Lindhard susceptibility directly couples to the phonon propagator with a bare charge vertex,
| (25) |
Here, and label the bands. The effect of the normal charge susceptibility has been studied in some detail by several authors Yao:2006 ; Johannes:2008 . However, within this picture, the selection of the ordering vector is not pronounced; the maxima in the susceptibility are almost equally high for a large manifold of ordering vectors (Fig. 6A), supporting the conclusion that another mechanism is responsible for finally selecting the experimentally observed ordering vector .
We thus consider a generic coupling to stress phonons where the electron-phonon coupling vertex is determined by the inverse effective mass tensor, which is related to the Raman vertex via Shastry:1990 ; Keck:1976 . As a result, in regions of strong band curvature the electron-phonon coupling is large. We consider only interband contributions which are generally accentuated by nesting as shown in Fig. 1C. Using the mass density operator [Eq. (2)] we define the projected susceptibility for inter-band scattering transitions as
| (26) |
where are the two bands defined in Eq. (5) and are the fully symmetric effective mass vertices derived from these bands [Eq. (3)]. Note that this quantity is only symmetric in the larger momentum range and vanishes for . We use this susceptibility in our calculation of the renormalized phonon frequency [Eqs. (23) and (24)]. Here we have taken the bare phonon frequency to be independent of momentum, hence , as any mild momentum dependence will not affect the general behavior near .
The phonon frequency renormalized by is shown in Fig. 9A for small hybridization (i.e., with values of and 10 times smaller than those employed in Figs. 1D and 5) in order to emphasize the effect. Panels B-D further display the phonon softening along the Brillouin zone cut (dashed line in panel A) as a function of and . It is evident that the phonon frequency exhibits a significant softening at the wavevector connecting the corners of the Fermi surface, where the band degeneracy is lifted by hybridization. This predicted phonon renormalization remains to be experimentally confirmed by neutron or inelastic x-ray scattering (RIXS), since Raman scattering is limited to small momentum transfer . The focusing effect of the large curvature of the energy bands given by the mass tensor is very sensitive to the hybridization parameter (Fig. 9B-D). Nonetheless, our study has a model character pointing out the relevance of the projected susceptibility for interband scattering . The exact strength of the enhancement due to the at the experimentally observed ordering vector depends critically on the dispersion over the whole Brillouin zone Johannes:2008 which is left to a future study.