Mayfair London W1K 2NY, UK 44institutetext: Department of Physics, University of Cagliari, Italy 55institutetext: Linkalab, Complex Systems Computational Laboratory, 09129 Cagliari, Italy 66institutetext: Dipartimento di Ingegneria Elettrica ed Elettronica Università di Cagliari, Italy
Distributed Generation and Resilience in Power Grids
Abstract
We study the effects of the allocation of distributed generation on the resilience of power grids. We find that an unconstrained allocation and growth of the distributed generation can drive a power grid beyond its design parameters. In order to overcome such a problem, we propose a topological algorithm derived from the field of Complex Networks to allocate distributed generation sources in an existing power grid.
Keywords:
distributed generation, AC power model, complex networks, pagerank1 Introduction
Distributed Generation from renewable sources is having a deep impact on our power grids. The difficult task of integrating the stochastic and often volatile renewable sources into a the grid designed with a power-on-demand paradigm could perhaps solved leveraging on distributed storage [5]; nevertheless, massive and economic power storage is not yet readily available. In the meanwhile, power grids are nowadays required to be robust and smart, i.e. systems able to maintain, under normal or perturbed conditions, the frequency and amplitude variations of the supplied voltage into a defined range and to provide fast restoration after faults. Therefore, many studies have concentrated on the dynamic behaviour of Smart Grids to understand how to ensure stability and avoid loss of synchronization during typical events like the interconnection of distributed generation. The large number of elements present into real grids calls for simplifications like the mapping among the classic swing equations [23] and Kuramoto models [17, 18, 16] that allows to study numerically or analytically the synchronization and the transient stability of large power networks.
Even simple models [15] akin to the DC power flow model [25] show that the network topology can dynamically induce a complex size probability distributions of blackouts (power-law distributed), both when the system is operated near its limits [11] or when the system is subject to erratic disturbances [22]. New realistic metrics to assess the robustness of the electric power grid with respect to the cascading failures [26] are therefore needed.
Smart grids are going to insist on pre-existing networks designed for different purposes and tailored on different paradigms and new kind of failures are possible: therefore a careful transition is needed. One possible approach could be the use of advanced metering infrastructure (AMI) not only for implementing providers and customers services, but also to detect and forecast failures; nevertheless an ill-designed network will never be efficient.
Our approach will not concentrate on the instabilities but will focus instead on the condition under which, in presence of distributed generation, the system can either be operated or controlled back within its design parameters, i.e. it is resilient. It is akin in spirit to the approach of [13], that by applying DC power flow analysis to a system with a stochastic distribution of demands, aims to understand and prevent failures by identifying the most relevant load configurations on the feasibility boundary between the normal and problematic regions of grid operation.
To model power grids, we will use the more computational intensive AC power flow algorithms as, although DC flows are on average wrong by a few percent [24], error outliers could distort our analysis.
To model distributed renewable sources, we will introduced a skewed probability distribution of load demands representing a crude model of reality that ignores the effects like the correlations (due for examples to weather conditions) between different consumers or distributed producers .
2 Methods
2.1 AC Power Flow
The AC power flow is described by a system of non-linear equations that allow to obtain complete voltage angle and magnitude information for each bus in a power system for specified loads [19]. A bus of the system is either classified as Load Bus if there are no generators connected or as a Generator Bus if one or more generators are connected. It is assumed that the real power and the reactive power at each Load Bus are given, while for Generator Buses the real generated power and the voltage magnitude are given. A particular Generator Bus, called the Slack Bus, is assumed as a reference and its voltage magnitude and voltage phase are fixed. The branches of the electrical system are described by the bus admittance matrix with complex elements s.
The power balance equations can be written for real and reactive power for each bus. The real power balance equation is:
where is the number of buses, is the net real power injected at the bus , is the real part and is the imaginary part of the element and is the difference in voltage angle between the and buses. The reactive power balance equation is:
where is the net reactive power injected at the bus.
Real and reactive power flow on each branch as well as generator reactive power; the output can be analytically determined but due to the non-linear character of the system numerical methods are employed to obtain a solution. To solve such equations, we employ Pylon [2], a port of MATPOWER [1] to the Python programming language.
A requirement for the stability of the load and generation requirements is the condition that all branches and buses operate within their physical feasibility parameters; going beyond such parameters can trigger cascades of failures eventually leading to black outs [21].
In the present paper a topological investigation on the power grid has been developed in order to evaluate the effects of distributed generation on the voltage and power quality. Hence, a steady state analysis has been carried out and the transient phenomena connected to the power flow control have been neglected. Under this hypothesis the frequency variation connected to power flow control has been considered stabilized and the system has been considered characterized by a constant steady state supply voltage frequency. Therefore, if all the nodes are near their nominal voltage, it is much easier to control the system and to avoid reaching infeasible levels of power flow. Consequently, to measure the effects of power quality of a power grid under distributed generation we measure the fraction of load buses whose tension goes beyond of its nominal voltage. Notice that real networks are often operated with some of the buses beyond such parameters so that (especially for large networks) it is expected to be under operating conditions. The maximum of the resilience for a power grid (intended as the capability of restoring full feasible flows) is expected to be for .
2.2 Distributed Generation and Skew-normal distribution
We will consider distributed generation due to erratic renewable sources like sun and wind; therefore, we will model the effects of “green generators” on a power grid as a stochastic variation the power requested by load buses. Load buses with a green generator will henceforth called green buses. We will consider the location of green buses to be random; the fraction of green buses will characterize the penetration of the distributed generation in a grid.
If the power dispatched by distributed generation is high enough, loads can eventually become negative: this effect can be related to the efficiency of green generators. We model such an effect by considering the load on green buses described by the skew-normal distribution [4], a pseudo-normal distribution with a non-zero skewness:
where is a real parameter and
The parameter will characterize the level of the distributed generation: to positive correspond loads positive on average, while for negative green nodes will tend to dispatch power.
Our model grids will therefore consist of three kind of buses: generators (fixed voltage), pure loads (fixed power consumption) and green buses (stochastic power consumption) with the total number of buses and the number of load nodes. The fraction measures the penetration of renewable sources in the grid.
2.3 Complex Networks and Page Rank
The topology of a power grid can be represented as a directed graph , where to the -th bus corresponds the nodes of the set and to the -th branch from the -th to the -th bus corresponds the edge of the set . In Power System engineering, it is custom to associate to the graph representing a power networks its incidence matrix whose elements are
. An alternative representation of the graph much more used in other scientific fields is its adjacency matrix whose element are
While Graph Theory has an old tradition since Euler’s venerable problem on Koenigsberg bridges [6], Complex Networks is the new field investigating the emergent properties of large graphs. An important characteristic of the nodes of a complex network is their centrality, i.e. their relative importance respect to the other nodes of the graph [10]. An important centrality measure is Page Rank, the algorithm introduced Brin and Page [7] to rank web pages that is at the hearth of the Google search engine. The Page Rank of the -th node is the solution of the linear system
where is the number of buses (nodes), is the number of outgoing links (out-degree) and is the Page Rank damping factor. In studying power grids, we will employ Page Rank as it is strictly related to several invariants occurring in the study of random walks and electrical networks [14].
3 Results
3.1 Effects of distributed generation
We have investigated the effects of our null model of distributed
generation on the 2383 bus power grid of Poland, 1999. Starting from
the unperturbed network, we have found an initial fraction
of load buses beyond their nominal tension. We
have therefore varied the penetration at fixed distributed
generation level ’s; results are shown in Fig.
1.
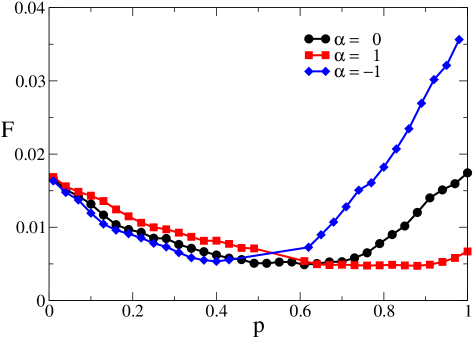
We find that the behaviour of the fraction of buses operating near their nominal tension does not follow a monotonic behaviour. Initially (low values of ), the penetration of distributed generation enhances resiliency (i.e. decreases ). At higher values of , grows and resilience worsens. Such an effect is particularly severe if green nodes introduce a surplus () of power respect to the normal () operating load requests. On the other hand, keeping the levels of renewable energy production below () the normal load request delays the point beyond which the penetration of distributed generation worsens the resiliency.
Notice that when distributed generation is ancillary () and not predominant in the power supplied of the network, full penetration () of renewable sources lead to more stable state than the initial () one.
3.2 Targeted distributed generation
Beside their natural application to web crawling, the Page Rank algorithm can be applied to find local partitions of a network that optimize conductance [3]. We therefore investigate what happens in a power network if distributed generation is introduced with a policy that accounts for the pagerank of load nodes. In other words, for a level of penetration , we choose the first load nodes in decreasing pagerank order to become green nodes. The effects of such a choice are shown compared to the random penetration policy in Fig. 2.
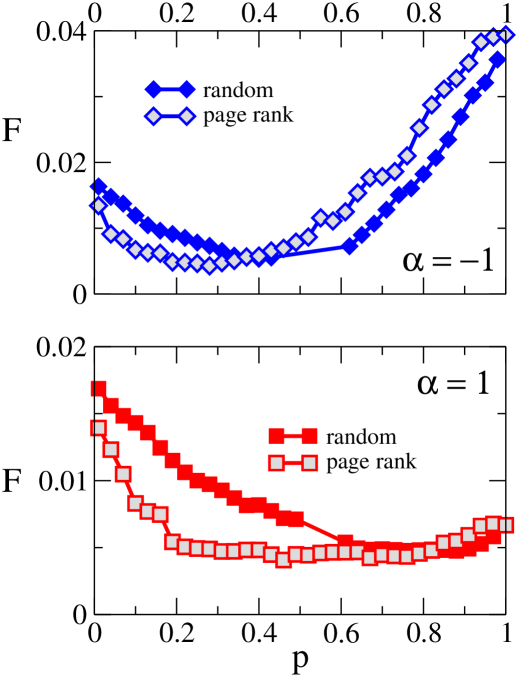
We find that, for low penetration levels, the pagerank policy reduces the number of nodes operating beyond their nominal tension both for positive and for negative ’s. Again, the excess of power production () comparatively reduces the resilience of the network.
Preliminary results show that Page Rank is the best behaved among centralities in enhancing power grid resilience; such study will be the subject of a future publication.
4 Discussion
We have introduced a model base on the AC power flow equation that allows to account for the presence of erratic renewable sources distributed on a power grid and for their efficiency. By defining the resilience of the grid as a quantity related to the possibility of controlling the power flow via voltage adjustments (hence returning within the operating bounds of its components), we have studied the penetration of distributed generation on a realistic power grid.
We have found that while the introduction of few ”green” generators in general enhances the resilience of the network by decreasing the number of nodes operating beyond their nominal voltage, a further increase of renewable sources could decrease the power quality of the grid. Anyhow, if distributed generation is ancillary and not predominant in the power supplied of the network, the grid at full penetration () of renewable sources is in a more stable state than the starting grid ().
Our finding that a surplus of production from renewable sources is also a source of additional instabilities is perhaps to be expected in general for networks that have been designed to dispatch power from their generators to their loads and not to produce energy ”locally”. While we have found that in an isolated grid instability possible increases with the penetration, what happens when more grids are linked together is an open subject. Power grids are typical complex infrastructural systems; therefore they can exhibit emergent characteristics when they interact with each other, modifying the risk of failure in the individual systems [12]. As an example, the increase in infrastructural interdependencies could either mitigate [8] or increase [20, 9] the risk of a system failure.
Finally, we find that a policy of choosing the sites where to introduce renewable sources according to Page Rank allows to increase the resilience with a minimal amount of green buses. Such policy does not take into account other factors and should therefore be integrated in a multi-objective optimization to consider the environmental, economical and social constraints.
Acknowledgements.
We thank US grant HDTRA1-11-1-0048, EU FET Open project FOC nr.255987 and CNR-PNR National Project ”Crisis-Lab” for support. The contents do not necessarily reflect the position or the policy of funding parties.
References
- [1] matpower, http://www.pserc.cornell.edu/matpower/
- [2] pylon, http://pylon.eee.strath.ac.uk/pylon/
- [3] Andersen, R., Chung, F., Lang, K.: Local graph partitioning using pagerank vectors. In: Proceedings of the 47th Annual IEEE Symposium on Foundations of Computer Science. pp. 475–486. FOCS ’06, IEEE Computer Society, Washington, DC, USA (2006)
- [4] Azzalini, A.: The skew-normal distribution and related multivariate families. Scandinavian Journal of Statistics 32(2), 159–188 (2005)
- [5] Baghaie, M., Moeller, S., Krishnamachari, B.: Energy routing on the future grid: A stochastic network optimization approach. pp. 1–8 (Oct 2010)
- [6] Berge, C.: Théorie des graphes et ses applications. Collection Universitaire de Mathématiques, II, Paris: Dunod (1958)
- [7] Brin, S., Page, L.: The anatomy of a large-scale hypertextual web search engine. Comput. Netw. ISDN Syst. 30(1-7), 107–117 (Apr 1998)
- [8] Brummitt, C.D., D’Souza, R.M., Leicht, E.A.: Suppressing cascades of load in interdependent networks. Proceedings of the National Academy of Sciences (2012)
- [9] Buldyrev, S.V., Parshani, R., Paul, G., Stanley, H.E., Havlin, S.: Catastrophic cascade of failures in interdependent networks. Nature 464(7291), 1025–1028 (Apr 2010)
- [10] Caldarelli, G.: Scale-free Networks. Oxford University Press (2007)
- [11] Carreras, B.A., Lynch, V.E., Dobson, I., Newman, D.E.: Critical points and transitions in an electric power transmission model for cascading failure blackouts. Chaos: An Interdisciplinary Journal of Nonlinear Science 12(4), 985–994 (2002)
- [12] Carreras, B.A., Newman, D.E., Gradney, P., Lynch, V.E., Dobson, I.: Interdependent risk in interacting infrastructure systems. In: Proceedings of the 40th Annual Hawaii International Conference on System Sciences. pp. 112–. HICSS ’07, IEEE Computer Society, Washington, DC, USA (2007)
- [13] Chertkov, M., Pan, F., Stepanov, M.G.: Predicting failures in power grids: The case of static overloads. IEEE Trans. Smart Grid 2(1), 162–172 (2011)
- [14] Chung, F., Zhao, W.: Pagerank and random walks on graphs, http://www.math.ucsd.edu/~fan/wp/lov.pdf
- [15] Dobson, I., Carreras, B., Lynch, V., Newman, D.: An initial model for complex dynamics in electric power system blackouts. In: Proceedings of the 34th Annual Hawaii International Conference on System Sciences ( HICSS-34)-Volume 2 - Volume 2. pp. 2017–. HICSS ’01, IEEE Computer Society, Washington, DC, USA (2001)
- [16] Dorfler, F., Bullo, F.: Synchronization and transient stability in power networks and non-uniform Kuramoto oscillators. SIAM Journal on Control and Optimization (2012), to appear (Submitted Oct 2011)
- [17] Filatrella, G., Nielsen, A.H., Pedersen, N.F.: Analysis of a power grid using a kuramoto-like model. The European Physical Journal B - Condensed Matter and Complex Systems 61(4), 485–491 (feb 2008)
- [18] Fioriti, V., Ruzzante, S., Castorini, E., Marchei, E., Rosato, V.: Critical information infrastructure security. pp. 14–23. Springer-Verlag, Berlin, Heidelberg (2009)
- [19] Grainger, J., Stevenson, W.: Power System Analysis. McGraw-Hill, New York (1994)
- [20] Laprie, J.C., Kanoun, K., Ka?niche, M.: Modelling interdependencies between the electricity and information infrastructures. CoRR abs/0809.4107 (2008)
- [21] Pahwa, S., Hodges, A., Scoglio, C., Wood, S.: Topological analysis of the power grid and mitigation strategies against cascading failures. ArXiv e-prints (Jun 2010)
- [22] Sachtjen, M.L., Carreras, B.A., Lynch, V.E.: Disturbances in a power transmission system. Phys. Rev. E 61, 4877–4882 (May 2000)
- [23] Stagg, G., El-Abiad, A.: Computer Methods In Power System Analysis. McGraw-Hill Education (04 1968)
- [24] Stott, B., Jardim, J., Alsac, O.: Dc power flow revisited. Power Systems, IEEE Transactions on 24(3), 1290–1300 (Aug 2009)
- [25] Wood, A.J., Wollenberg, B.F.: Power Generation, Operation and Control. Wiley, New York (1984)
- [26] Youssef, M., Scoglio, C., Pahwa, S.: Robustness measure for power grids with respect to cascading failures. In: Proceedings of the 2011 International Workshop on Modeling, Analysis, and Control of Complex Networks. pp. 45–49. Cnet ’11, ITCP (2011)