NMR Search for the Spin Nematic State in LaFeAsO Single Crystal
Abstract
We report a 75As single crystal NMR investigation of LaFeAsO, the parent phase of a pnictide high superconductor. We demonstrate that spin dynamics develop a strong two-fold anisotropy within each orthorhombic domain below the tetragonal-orthorhombic structural phase transition at K. This intermediate state with a dynamical breaking of the rotational symmetry freezes progressively into a spin density wave (SDW) below K. Our findings are consistent with the presence of a spin nematic state below with an incipient magnetic order.
pacs:
74.70.Xa, 76.60.-kThe mechanism of high superconductivity in iron pnictides remains enigmatic Kamihara et al. (2008). Earlier NMR measurements demonstrated that low frequency spin fluctuations associated with the spin density wave (SDW) instability grow toward near optimal doping Nakai et al. (2008); Ning et al. (2010); Lang et al. (2010); Oka et al. (2012), favoring the scenario of spin-fluctuation induced superconductivity. There is, however, a complication; the slowing of the lattice vibrations accompanies that of spin fluctuations McGuire et al. (2008); Fernandes et al. (2010); Yoshizawa et al. (2012). For example, neutron scattering measurements showed that LaFeAsO undergoes a tetragonal-orthorhombic structural phase transition at K, followed by a SDW ordering at K de la Cruz et al. (2008); McGuire et al. (2008); Li et al. (2010). Moreover, the softening of the lattice begins at as high as K, and continues through and down to K McGuire et al. (2008), where the growth of the orthorhombic domains ends Li et al. (2010); Ricci et al. (2010). Theoretical analysis of LaFeAsO based on the frustrated - model suggests that the Ising symmetry of Fe spins may be already broken below without a three-dimensional magnetic long-range order Xu et al. (2008). Moreover, the intermediate temperature range between and of LaFeAsO may be identified as a spin nematic state Fang et al. (2008).
In such a nematic state, the spin correlations break the tetragonal symmetry, i.e. (we refer readers to Fig. 1 of a review article Fernandes and Schmalian (2012) for a pictorial demonstration of the nematic state). More recent theoretical analysis based on an itinerant electron picture Fernandes et al. (2012) or an orbital fluctuation model Kontani et al. (2011) also led to analogous conclusions. The prospect of observing such a magnetic analogue of a liquid crystal below with an incipient (“fluctuating”) magnetic order, and its potential link with the mechanism of high superconductivity, has stimulated strong interest among researchers. The past experimental efforts searching for the signature of nematicity were focused primarily on the BaFe2As2 series (e.g. Chu et al. (2011); Tanatar et al. (2010); Dhital et al. (2012); Nakajima et al. ). However, the proximity between the structural and SDW transitions, and/or the twinning of orthorhombic domains hampered these efforts.
In this Letter, we report a microscopic 75As NMR investigation of LaFeAsO for a single crystal Yan et al. (2009), and compare our results with neutron scattering Li et al. (2010) and magnetic susceptibility measured for the same piece of mg crystal. The usage of a single crystal enabled us to resolve complicated changes of NMR lineshapes across and for the first time, and find the signature of the spontaneous breaking of the rotational symmetry. We will demonstrate that low frequency spin dynamics indeed exhibit a strong anisotropy within each orthorhombic domain with a two-fold symmetry below K. Moreover, the anisotropic spin state freezes progressively into a static SDW from K to K, and the SDW ordered and paramagnetic domains coexist in a broad range of temperature. Our findings uncover the presence of an unconventional intermediate spin state below with the signatures of spin nematicity.
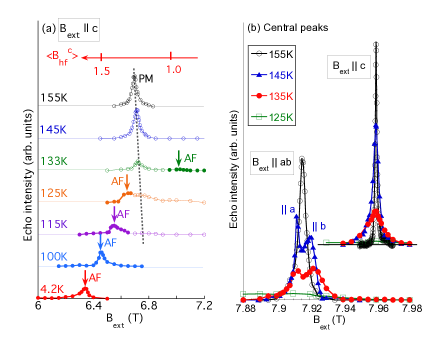
In Fig. 1, we summarize representative field-swept 75As NMR lineshapes observed at MHz (nuclear spin ). When we apply an external magnetic field along the c-axis, a sharp paramagnetic (PM) central peak appears at T for the to transition, as shown in Fig. 1(b); the resonant condition is , where the nuclear gyromagnetic ratio MHz/T. %) is the Knight shift, which measures the product between the local spin susceptibility and the hyperfine coupling constant. We note that the full-width at half-maximum of the PM central peak is as sharp as 6.5 kHz (8.9 Oe) at 290 K in the absence of orthorhombic distortion. The narrow linewidth is comparable to that of undoped BaFe2As2 Kitagawa et al. (2008); Ning et al. (2009), and attests to the high homogeneity of our crystal.
In Fig. 1(a), we observe an to paramagnetic satellite peak near T (connected by a dotted line). We also found the strongly temperature dependent antiferromagnetic (AF) central peak arising from the statically SDW ordered domains (marked by downward arrows), but only below the onset temperature of K (). The AF central peak is shifted from the PM central peak at T in Fig. 1(b) by a static hyperfine field along the c-axis, . originates from the ordered Fe magnetic moments , and Kitagawa et al. (2008). In Fig. 2(b), we deduce the temperature dependence of from Fig. 1(a), and compare the results with the neutron scattering data of Li et al. (2010).
The splitting between the central and satellite peaks, MHz, measures the nuclear quadrupole interaction with the electric field gradient (EFG). We summarize the temperature dependence of in Fig. 2(c). The EFG is the second derivative of the Coulomb potential arising from electrons and ions near the observed 75As sites. Below K, exhibits a sharp downturn, because the EFG is sensitive to the local structural environment. Earlier diffraction measurements showed that the growth of orthorhombic domains finally comes to an end at K Li et al. (2010); Ricci et al. (2010); also levels off below .
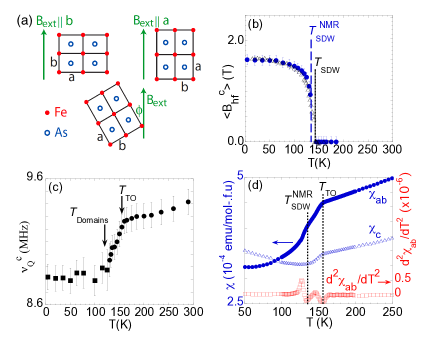
In Fig. 1(b), we also show representative NMR lineshapes with applied along the tetragonal a-axis within the FeAs planes. Above , all tetragonal domains are equivalent, hence we observe a single central peak. Below , the elongated a-axis of each domain points either along the direction of , or orthogonal to , due to twinning of the orthorhombic domains, as sketched in Fig. 2(a). Moreover, orthorhombic distortion breaks the axial symmetry of the EFG. The difference in the second order effects of the nuclear quadrupole interaction thus results in splitting of the central peak; the peak positions depend on the direction of the elongated a-axis relative to . We confirmed that the NMR line splitting in Fig. 1(b) is caused entirely by the difference in the second order nuclear quadrupole effects, which is inversely proportional to Takigawa et al. (1989). That is, the NMR Knight shift is still axially symmetric, and shows very little temperature dependence below , %. In view of the fact that expansion of the lattice from to 290 K results in a larger value of the quadrupole frequency as shown in Fig. 2(c), we tentatively assign the peak near T to the orthorhombic domains with ; the other peak near T arises from the orthorhombic domains with instead. From the splitting of an to satellite peak, we estimate MHz and MHz at 145 K. We also confirmed that these double peaks collapse into one when we apply along the [110] direction within the ab-plane, because points along the diagonal direction for all orthorhombic domains in such a geometry.
For bulk averaged measurement techniques such as resistivity, the twinning of orthorhombic domains would result in experimental data averaged over two orthogonal directions within the ab-plane, unless one applies a uniaxial stress Chu et al. (2011); Tanatar et al. (2010); Dhital et al. (2012); Nakajima et al. . It is not straightforward, then, to probe the spontaneous breaking of the rotational symmetry. In contrast, NMR is a local probe. Since we have succeeded in resolving the central peaks in Fig. 1(b) for different orientations, we can investigate the in-plane anisotropy of spins within each orthorhombic domain.
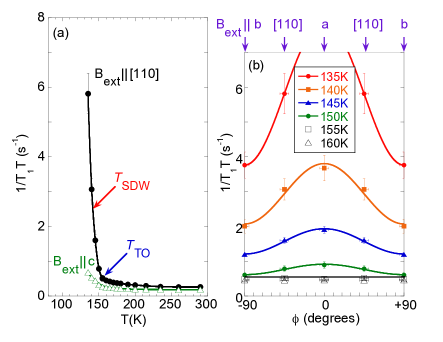
In Fig. 3(a), we summarize the temperature dependence of the nuclear spin-lattice relaxation rate divided by , , for the PM central peaks for examples of the recovery curves and their fit to the standard solution to the rate equation. . Our preliminary results for the SDW ordered state are very similar to the case of BaFe2As2 Kitagawa et al. (2008), and beyond the scope of the present work. measures low-frequency spin fluctuations: , where specifies the direction of , and are the hyperfine form factor Smerald and Shannon (2011) and the imaginary part of the dynamical electron spin susceptibility, respectively, and the q summation is taken within the Brillouin zone. shows a mild increase with decreasing temperature down to due to the slow growth of a short range SDW order. Once we enter the orthorhombic phase below , measured with [110], a-, and b-axis begins to show rapid growth. This implies that the orthorhombic distortion enhances low frequency components of antiferromagnetic spin fluctuations, and that the dynamic SDW is rapidly slowing down Ning et al. (2010, 2009); Nakai et al. (2012). This conclusion is consistent with the downturn of below McGuire et al. (2008), also observed for our crystal as shown in Fig. 2(d). At first glance, the enhancement of below is much weaker with c. This is simply because the transferred hyperfine fields at 75As sites from their four nearest-neighbor Fe sites are geometrically cancelled out within the ab-plane in this configuration, i.e. for the SDW ordering wave vectors , and the contributions of AF spin fluctuations to are “filtered out” Smerald and Shannon (2011). The growing anisotropy of between the ab- and c-axis orientations observed below therefore has little to do with that of the critical dynamics of Fe spins near .
Next, let’s turn attention to the angular dependence of within the ab-plane, which has been proposed as a novel probe of spin nematicity Smerald and Shannon (2011). As summarized in Fig. 3(b), we don’t observe any -dependence of above . Once we enter the orthorhombic phase below , begins to develop a strong anisotropy within each orthorhombic domain. The anisotropy reaches as much as a factor of by K. In view of the very small difference between the lattice constants of the a- and b-axis ( %) de la Cruz et al. (2008); Yan et al. (2009); Li et al. (2010), our finding is quite unexpected for paramagnetic spin fluctuations.
As explained above, the Knight shift remains axially symmetric within experimental uncertainties below . It is therefore unlikely that the uniform spin susceptibility or the hyperfine form factor develops a sizable anisotropy within the ab-plane below . We therefore conclude that low frequency Fe spin dynamics as reflected in locally develop a strong rotational anisotropy by a factor of within each orthorhombic domain below , without exhibiting a three-dimensional magnetic order. We note that the intensities of the a- and b-peaks in Fig. 1(b) are comparable, hence FeAs planes are randomly twinned. When averaged over the entire single crystal, Fe spin dynamics would appear almost isotropic within the ab-plane.
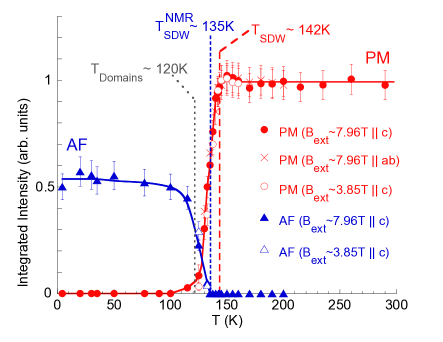
The anomalous behavior of Fe spins below is not limited to the in-plane anisotropy of their dynamics. In Fig. 4, we summarize the temperature dependence of the integrated intensities of the NMR signal. An unusual aspect of the signal intensity is that the paramagnetic NMR peaks don’t disappear suddenly at K, and linger well below down to K. On the other hand, AF NMR signals from statically SDW ordered domains emerge progressively, only below K (). Notice that the PM central peak is still clearly observable below in Fig. 1(b). Our finding that the PM signal intensity is as large as % at implies that % of the sample volume remains paramagnetic at 135 K. That is, AF and PM domains coexist even below , although neutron scattering begins to detect magnetic Bragg peaks below Li et al. (2010). In addition, measured for the residual PM peak does not blow up at , and continues to increase. If the SDW ordering in our LaFeAsO single crystal was a typical second order phase transition, would diverge at due to the critical slowing down of spin fluctuations, followed by a sudden disappearance of PM NMR signals below .
The reason NMR and neutron scattering detect different onset temperatures of the SDW is that each experimental probe has a different characteristic measurement time scale Hunt et al. (2001); Mazin and Johannes (2009). Elastic neutron scattering measurements would consider the SDW ‘static’ when fluctuations slow down to below the instrument resolution of meV. This means that neutron scattering can take an instantaneous picture of Fe spins with a ‘shutter speed’ of sec even if they are still slowly fluctuating. In contrast, AF NMR signals in Fig. 1(a) become observable only when Fe spins in the SDW become static, to the extent that is time-independent over the duration of our spin echo measurements, sec. If Fe moments are fluctuating faster than sec in some segments of FeAs planes, NMR would see them as motionally averaged out (i.e. paramagnetic). In other words, the different onset temperatures of the SDW ordering between neutron and NMR data indicate that the fluctuations of the SDW continue to slow down from K to K. The coexistence of PM and AF domains below 142 K implies that the fluctuation time scales have a broad distribution throughout the FeAs planes. We also found that exhibits an additional kink at K, as shown in Fig. 2(d). Since SQUID measures the time-independent response of spins, the acceleration in the suppression of below is consistent with NMR.
It is interesting to realize that these unusual behaviors of LaFeAsO share similarities with the spin stripes in high cuprates Tranquada et al. (1995), where the concept of namaticity was originally proposed for unconventional superconductors Kivelson et al. (1998). In the striped cuprates, the spin stripes progressively slow down below a charge ordering at K Tranquada et al. (1995) (instead of ); elastic neutron scattering, SR, and NMR detect the emergence of a static SDW at their respective measurement time scale below K Tranquada et al. (1995), K Nachumi et al. (1998), and K Hunt et al. (2001), respectively. Moreover, PM NMR signals linger well below K Hunt et al. (2001).
The temperature dependence of the AF NMR signal intensity in Fig. 4 indicates that the volume fraction of the static SDW at the time scale of NMR gradually increases from K toward K. Once the growth of the orthorhombic domains ends at Li et al. (2010); Ricci et al. (2010), the intensity saturates at % of the paramagnetic intensity above . The missing signal intensity suggests that is still modulating and/or is too fast for a spin echo NMR signal to form in % of the sample volume. Our finding is consistent with the earlier SR measurements for a powder sample of LaFeAsO; the muon precession with a well-defined frequency of MHz takes place only in % of the sample volume, and % of the SR signal is strongly damped Klauss et al. (2008). It remains to be seen whether these ultra slow dynamics of the SDW in 30-40 % of the sample volume are caused by the motion of the anti-phase domain boundaries Mazin and Johannes (2009) and/or the finite size effects of the orthorhombic domains.
To summarize, we demonstrated that Fe spin fluctuations in a LaFeAsO single crystal begin to slow down below K, accompanied by the local breakdown of the rotational symmetry of spin fluctuations in each of the randomly twinned orthorhombic domains. The way that the static SDW develops is also unconventional. The paramagnetic and SDW ordered domains coexist in a wide range of temperature below K due to a distribution in the fluctuation time scales of the SDW. A large volume of FeAs planes sees freezing of the static SDW only below K. Our findings point towards the presence of a novel spin state between and with a dynamically broken rotational symmetry and an incipient magnetic order, i.e. the elusive spin nematic sate.
The work at McMaster was supported by NSERC and CIFAR. The work at Zhejiang was supported by National Basic Research Program of China (No.2011CBA00103) and NSF of China (No. 11274268). Research at ORNL was supported by the Department of Energy, Basic Energy Sciences, Materials Sciences and Engineering Division. TI acknowledges helpful discussions with K. Ishida, H. Eisaki, S. Uchida, I. Mazin, J. Tranquada, B. Buechner, P. Canfield, and B. Gaulin. JQY thanks B. Jensen, K. Dennis, R. McCallum, and T. Lograsso for
their assistance in crystal growth, which was also supported by the U.S. DOE.
References
- Kamihara et al. (2008) Y. Kamihara, T. Watanabe, M. Hirano, and H. Hosono, J. Amer. Chem. Soc. 130, 3296 (2008).
- Nakai et al. (2008) Y. Nakai, K. Ishida, Y. Kamihara, M. Hirano, and H. Hosono, J. Phys. Soc. Jpn. 77, 073701 (2008).
- Ning et al. (2010) F. L. Ning, K. Ahilan, T. Imai, A. S. Sefat, M. A. McGuire, B. C. Sales, D. Mandrus, P. Cheng, B. Shen, and H.-H. Wen, Phys. Rev. Lett. 104, 037001 (2010).
- Lang et al. (2010) G. Lang, H.-J. Grafe, D. Paar, F. Hammerath, K. Manthey, G. Behr, J. Werner, and B. Buchner, Phys. Rev. Lett. 104, 097001 (2010).
- Oka et al. (2012) T. Oka, Z. Li, S. Kawasaki, G. F. Chen, N. L. Wang, and G. Q. Zheng, Phys. Rev. Lett 108, 047001 (2012).
- McGuire et al. (2008) M. McGuire, A. Christianson, A. Sefat, B. C. Sales, M. D. Lumsden, R. Jin, E. A. Payzant, D. Mandrus, Y. Luan, V. Keppens, et al., Phys. Rev. B 78, 094517 (2008).
- Fernandes et al. (2010) R. M. Fernandes, L. H. VanBebber, S. Bhattacharya, P. Chandra, V. Keppens, D. Mandrus, M. A. McGuire, B. C. Sales, A. S. Sefat, and J. Schmalian, Phys. Rev. Lett. 105, 157003 (2010).
- Yoshizawa et al. (2012) M. Yoshizawa, D. Kimura, T. Chiba, A. Ismayil, Y. Nakanishi, K. Kihou, C. H. Lee, A. Iyo, H. Eisaki, M. Nakajima, et al., J. Phys. Soc. Jpn. 81, 024604 (2012).
- de la Cruz et al. (2008) C. de la Cruz, Q. Huang, J. W. Lynn, J. Li, W. Ratcliff, J. L. Zarestky, H. A. Mook, G. F. Chen, J. L. Luo, N. L. Wang, et al., Nature 453, 899 (2008).
- Li et al. (2010) H.-F. Li, W. Tian, J.-Q. Yan, J. L. Zarestky, R. W. McCallum, T. A. Lograsso, and D. Vaknin, Phys. Rev. B 82, 064409 (2010).
- Ricci et al. (2010) A. Ricci, N. Poccia, B. Joseph, L. Barba, G. Arrighetti, G. Ciasca, J.-Q. Yan, R. W. McCallum, T. A. Lograsso, N. D. Zhigadlo, et al., Phys. Rev. B 82, 144507 (2010).
- Xu et al. (2008) C. Xu, M. Muller, and S. Sachdev, Phys. Rev. B 78, 020501R (2008).
- Fang et al. (2008) C. Fang, H. Yao, W. F. Tsai, J. P. Hu, and S. A. Kivelson, Phys. Rev. B 77, 224509 (2008).
- Fernandes and Schmalian (2012) R. M. Fernandes and J. Schmalian, Supercond. Sci. and Technol. 25, 084005 (2012).
- Fernandes et al. (2012) R. M. Fernandes, A. V. Chubukov, J. Knolle, I. Eremin, and J. Schmalian, Phys. Rev. B 85, 024534 (2012).
- Kontani et al. (2011) H. Kontani, T. Saito, and S. Onari, Phys. Rev. B 84, 024528 (2011).
- Chu et al. (2011) J.-H. Chu, J. G. Analytis, K. D. Greve, P. L. McMahon, Z. Islam, Y. Yamamoto, and I. R. Fisher, Science 329, 824 (2011).
- Tanatar et al. (2010) M. A. Tanatar, E. C. Blomberg, A. Kreyssig, M. G. Kim, N. Ni, A. Thaler, S. L. Bud ko, P. C. Canfield, A. I. Goldman, I. Mazin, et al., Phys. Rev. B 81, 184508 (2010).
- Dhital et al. (2012) C. Dhital, Z. Yamani, W. Tian, J. Zeretsky, A. S. Sefat, Z. Wang, R. J. Birgeneau, and S. D. Wilson, Phys. Rev. Lett. 108, 087001 (2012).
- (20) M. Nakajima, S. Ishida, Y. Tomioka, K. Kihou, C. H. Lee, A. Iyo, T. Ito, T. Kakeshita, H. Eisaki, and S. Uchida, eprint arXiv:1208.1581.
- Yan et al. (2009) J.-Q. Yan, S. Nandi, J. L. Zarestky, W. Tian, A. Kreyssig, B. Jensen, A. Kracher, K. W. Dennis, R. J. McQueeney, A. I. Goldman, et al., Appl. Phys. Lett. 95, 222504 (2009).
- Kitagawa et al. (2008) K. Kitagawa, N. Katayama, K. Ohgushi, M. Yoshida, and M. Takigawa, J. Phys. Soc. Jpn. 77, 114709 (2008).
- Ning et al. (2009) F. L. Ning, K. Ahilan, T. Imai, A. S. Sefat, R. Jin, M. A. McGuire, B. C. Sales, and D. Mandrus, J. Phys. Soc. Jpn. 78, 013711 (2009).
- Takigawa et al. (1989) M. Takigawa, P. C. Hammel, R. H. Heffner, Z. Fisk, J. L. Smith, and R. B. Schwarz, Phys. Rev. B 39, 300 (1989).
- (25) See Supplemental Materials for examples of the recovery curves and their fit to the standard solution to the rate equation.
- Smerald and Shannon (2011) A. Smerald and N. Shannon, Phys. Rev. B 84, 184437 (2011).
- Nakai et al. (2012) Y. Nakai, S. Kitagawa, T. Iye, K. Ishida, Y. Kamihara, M. Hirano, and H. Hosono, Phys. Rev. B 85, 134408 (2012).
- Hunt et al. (2001) A. W. Hunt, P. M. Singer, A. F. Cederstrom, and T. Imai, Phys. Rev. B 64, 134525 (2001).
- Mazin and Johannes (2009) I. Mazin and M. Johannes, Nature Physics 5, 141 (2009).
- Tranquada et al. (1995) J. M. Tranquada, B. J. Sternlieb, J. D. Axe, Y. Nakamura, and S. Uchida, Nature 375, 561 (1995).
- Kivelson et al. (1998) S. A. Kivelson, E. Fradkin, and V. J. Emery, Nature 393, 550 (1998).
- Nachumi et al. (1998) B. Nachumi, Y. Fudamoto, A. Keren, K. M. Kojima, M. Larkin, G. M. Luke, J. Merrin, O. Tchernyshyov, Y. J. Uemura, N. Ichikawa, et al., Phys. Rev. B 58, 8760 (1998).
- Klauss et al. (2008) H. H. Klauss, H. Luetkens, R. Klingeler, C. Hess, F. J. Litterst, M. Kraken, M. M. Korshunov, I. Eremin, S. L. Drechsler, R. Khasanov, et al., Phys. Rev. Lett. 101, 077005 (2008).