ON THE ORIGINS OF THE DIFFUSE H EMISSION: IONIZED GAS OR DUST-SCATTERED H HALOS?
Abstract
It is known that the diffuse H emission outside of bright H II regions not only are very extended, but also can occur in distinct patches or filaments far from H II regions, and the line ratios of [S II] 6716/H and [N II] 6583/H observed far from bright H II regions are generally higher than those in the H II regions. These observations have been regarded as evidence against the dust-scattering origin of the diffuse H emission (including other optical lines), and the effect of dust scattering has been neglected in studies on the diffuse H emission. In this paper, we reexamine the arguments against dust scattering and find that the dust-scattering origin of the diffuse H emission cannot be ruled out. As opposed to the previous contention, the expected dust-scattered H halos surrounding H II regions are, in fact, in good agreement with the observed H morphology. We calculate an extensive set of photoionization models by varying elemental abundances, ionizing stellar types, and clumpiness of the interstellar medium (ISM) and find that the observed line ratios of [S II]/H, [N II]/H, and He I 5876/H in the diffuse ISM accord well with the dust-scattered halos around H II regions, which are photoionized by late O- and/or early B-type stars. We also demonstrate that the H absorption feature in the underlying continuum from the dust-scattered starlight (“diffuse galactic light”) and unresolved stars is able to substantially increase the [S II]/H and [N II]/H line ratios in the diffuse ISM.
Subject headings:
Galaxy: halo — H II regions — ISM: structure — radiative transfer — scattering1. Introduction
The diffuse H emission outside of bright H II regions is ubiquitous in late-type galaxies and is generally believed to probe the warm ionized medium (WIM; also called diffuse ionized gas, DIG), which may be a major component of the interstellar medium (ISM) of our Galaxy and other late-type galaxies (Reynolds, 1991; Walterbos & Braun, 1996; Dettmar, 2000; Rand, 2000; Hidalgo-Gámez, 2005; Haffner et al., 2009). It has been argued that the WIM is mainly photoionized by ionizing radiation (Lyman continuum; Lyc) that leaks out of bright H II regions associated with O stars (Mathis, 1986a, 2000; Domgörgen & Mathis, 1994; Sembach et al., 2000; Wood & Mathis, 2004; Wood et al., 2010), although it is not clear how the Lyc can penetrate the diffuse H I that is observed everywhere in the galaxies (e.g., Seon, 2009).
Previous studies of the diffuse H and other optical emission lines concluded that the effect of dust scattering is negligible (Reynolds, 1985; Walterbos & Braun, 1994; Ferguson et al., 1996a, b; Wood & Reynold, 1999). However, it was recently revealed that the H excess intensity in a number of high-latitude clouds is due to scattering by interstellar dust of H photons originating elsewhere in the Galaxy (Mattila et al., 2007; Lehtinen et al., 2010; Witt et al., 2010). More recently, Seon et al. (2011a, b) presented a strong connection between the diffuse H and far-ultraviolet (FUV) continuum backgrounds, which likely suggests a common radiative transfer mechanism responsible for a substantial fraction of both H line and FUV continuum photons. Through a comparison of the H and FUV continuum backgrounds, we proposed that the diffuse H emission at high latitudes may be dominated by late O- and/or early B-type stars (hereafter, late OB stars) and dust scattering (Seon et al., 2011b). Furthermore, Brandt & Draine (2012) detected emission lines H, H, [N II] 6583, and [S II] 6716 at high Galactic latitudes, whose intensities are correlated with the 100 m intensity, providing an independent confirmation of the importance of dust-scattered components in the optical emission lines. If the dust scattering indeed significantly contributes to the diffuse H emission and the effect of dust scattering is not properly taken into account, the energy requirement for the ionization and volume filling fraction of the WIM will be overestimated. Also, the widely-applied practice of using the all-sky map of diffuse H intensity (Finkbeiner, 2003) as a template for both the intensity and small-scale structure of the Galactic foreground free-free emission in cosmic microwave studies (e.g., Dickinson et al., 2009; Gold et al., 2011) needs to be reevaluated, if dust scattering contributes significantly to the intensity and spatial structure of diffuse H light outside the actual H II regions.
The recent findings about the importance of dust scattering motivated us to reexamine the rationales behind previous conclusions against the dust-scattering origin of the diffuse H emission. It was also necessary to confirm our previous results that nebulae photoionized by late OB stars are capable of reproducing the typical values of the [N II] 6583/H and [S II] 6716/H line ratios.
The rejection of dust scattering as a significant contributor to the diffuse H and other optical line emissions is mostly based on two arguments. The first argument is based on the H morphology in the surroundings of H II regions. Ferguson et al. (1996a, b) assumed that in R-band continuum images, bright OB associations would show R-band continuum halos as prominent as the H halos around H II regions, if the H halos around H II regions are caused by dust scattering. However, they found no corresponding halos around bright OB associations in the R-band images. Additionally, light scattered by dust was assumed to be usually concentrated around H II regions, but the diffuse H emission is often observed in distinct patches or filaments far from H II regions (e.g., Hoopes et al., 1996). Consequently, the extended H emission outside of bright H II regions was regarded as evidence of leakage of Lyc photons rather than as the dust scattering of H photons. Second, the optical line ratios of [N II]/H and [S II]/H observed outside of H II regions have been found to be generally higher than the corresponding ratios in bright H II regions (Reynolds, 1985, 1987; Walterbos & Braun, 1994). It was thereby concluded that the dust-scattering effect could be ignored in spite of the fact that bright H II regions are usually surrounded by a large amount of molecular gas and dust.
In the present study, by using radiative transfer models, we reexamine whether these arguments are indeed valid in rejecting the significance of dust scattering in the diffuse optical emission. First, we argue that the assertion based on the halo extent or morphology is clearly wrong. Instead, we show that the global H morphology in face-on galaxies can be readily explained by dust scattering. Second, we find that the observed line ratios of [N II]/H and [S II]/H outside of H II regions can be explained reasonably well by the dust-scattered halos around the H II regions photoionized by late OB stars, which is consistent with the main conclusion of Seon et al. (2011b). We demonstrate these results by calculating photoionization models of the radiation-bounded H II regions and putting the resulting emissivity distributions of the optical lines into the radiative transfer models as input sources for a dust scattering simulation, thereby showing that the dust-scattering origin of the diffuse H emission cannot be ruled out. Lastly, we also point out that the H absorption line in the dust-scattered starlight (so called “diffuse galactic light,” DGL) and the stellar continuum of unresolved stars can significantly increase the observed values of the line ratios.
This paper is organized as follows. In Section 2, we discuss the morphology and the surface brightness distribution of H halos around H II regions caused by dust scattering. Section 3 investigates one-dimensional and three-dimensional photoionization models, and the line ratios resulting from the models. In Section 4, we discuss the effect of the underlying Balmer absorption line on the optical line ratios. Additional evidence supporting the results are described in Section 5. Section 6 summarizes the results.
2. Dust-Scattered H Halos
2.1. Model
We performed Monte Carlo radiative transfer simulations of the dust-scattered H halos around extended sources. For the dust-scattering simulation, we used a three-dimensional Monte Carlo radiative transfer code (Lee et al., 2008; Seon, 2009), which is similar to those described in Wood & Reynold (1999) and Gordon et al. (2001). The basic algorithm we use for the radiative transfer is based on the work of Witt (1977). The first scattering of the photons is forced to insure that every photon contributes to the scattered light (Cashwell & Everett, 1959). The subsequent scatterings are not forced. The direction into which the photon is scattered at the nth scattering is described by spherical angles, which are determined from a Henyey-Greenstein phase function. The scattered light surface brightness image is constructed using the “peeling-off” technique (Yusef-Zadeh et al., 1984). Dust albedo and asymmetry factors for each emission line are adopted from the Milky Way dust model of Draine (2003).
We assumed a homogeneous dusty medium with pc, pc, and pc to include the whole H II region. The source center is at . The observer is assumed to be located at a distance of 3 Mpc, appropriate to NGC 7793 analyzed by Ferguson et al. (1996b), from the source center along the axis. We considered four dust densities corresponding to the number densities of hydrogen 5, 10, 15, and 20 cm-3. The Galactic gas-to-dust ratio (dust mass per hydrogen nucleon of g/H) was assumed for calculation of the dust density. The optical depth from the source center to the observer is then 0.58, 1.17, 1.76, and 2.35 at H for hydrogen density of 5, 10, 15, and 20 cm-3, respectively. The cloud thickness of 100 pc in the -direction was chosen to have an optical depth at H of about unity for the hydrogen density of 10 cm-3. The spatial extents of the dust cloud in the - and -axes were chosen to cover sufficiently large angular sizes of the dust-scattered halos. Note that the distance to the source and dust density configuration does not alter the main results discussed here.
We consider two simple types of H emissivity profile to obtain general properties of dust-scattered halos, which are independent of the detailed shape of the emissivity distribution of the photon source. For the first type, H photons are uniformly emitted from a sphere with a radius , e.g., in and otherwise. In the second type of model, H photons are uniformly emitted from a spherical shell with an outer radius and a width of pc, e.g., in and otherwise. Here, is the inner radius of the spherical shell. In both types of models, the outer radius of the source is varied as 10, 20, and 40 pc. The radial coordinates of H photons for sphere models are randomly determined by the formula , where is a uniform random variable between 0 and 1, to ensure uniform emissivity. For the shell models, the radial coordinates of H photons are determined by the formula . Azimuthal and polar coordinates ( and ) of photons are isotropically determined. Photons are then isotropically emitted from the locations .
2.2. General Properties
We first describe general properties of the dust-scattered halos. The surface brightnesses of the H source should obviously be proportional to the total luminosity of the source. In the calculations, we assumed that all sources have the same total luminosity while the source size and emissivity distribution shape vary. Therefore, the surface brightness (or intensity) of the source decreases with the angular size of the source when there is no dust-extinction effect. In general, the surface brightness would decrease with , where is the angular size of the source emissivity profile convolved with the telescope point spread function (including the effect of binning brightness profile).
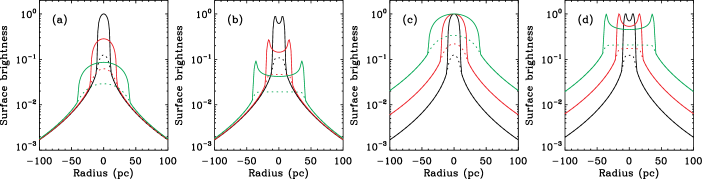
When the dust radiative transfer effects are considered, the total surface brightness (including direct and scattered lights) in the source region would still decrease as increases, although the effects of dust scattering and absorption may alter the functional dependence of the brightness on . Figure 1, in which profiles are binned with a pixel size of 0.29′′ (corresponding to 4.2 pc at 3 Mpc), shows the resulting surface brightness profiles for various source sizes and shapes after the dust radiative transfer effect was taken into account. In the figure, hydrogen density of 10 cm-3 was assumed. Solid and dashed lines represent the total (direct + scattered) and scattered surface brightnesses, respectively. For other hydrogen densities, we obtained qualitatively similar results as in Figure 1. The “surface brightness profile” in this paper represents a horizontal or vertical cut of the two-dimensional surface brightness distribution across the source center.
Surface brightnesses normalized to the same luminosity are shown in Figures 1(a) and (b) for sphere and shell models, respectively. We note that the surface brightness of the dust-scattered halo surrounding a larger source declines less steeply near the source boundary. The most interesting point is that at distances far from the sources the brightness profiles of the dust-scattered halos for various sources are essentially the same. This is because an extended source could be approximated by a point source, regardless of its shape and size, at locations sufficiently far from the source. Dust grains at these locations would scatter off the photons as if the photons had originated from a point source. Therefore, the brightness profile of the dust-scattered halo at distances far from the source should be independent of the spatial profile of the source and depend only on the total luminosity of the source, provided that the dust configuration (total optical depth and spatial density distribution of dust) was fixed.
Figures 1(c) and (d) show surface brightness profiles normalized to the maximum surface brightness for each source to compare the relative significance of the dust-scattered halo to the brightness of H II region. For a given luminosity, the surface brightness in the source region decreases as the source size increases, while the brightness profile of the halo remains relatively invariable. Therefore, the relative brightness of the scattered halo increases with the source size, as shown in the figure. We should also note that the relative contribution of dust-scattered components to the total intensity at the source region increases with source size. In Figure 1 ( cm-3), the contribution of scattered light to total (direct + scattered) surface brightness at the center is 13–46%. The fraction of the scattered flux integrated over all regions (H II + halo regions) to the total (direct + scattered) flux over all regions is about 62–63%. This ratio is more or less constant, regardless of the source size and shape, for a given optical depth. The ratio of the scattered flux integrated over the halo region to the total flux integrated over all regions is found to be about 42–57%. The ratio of scattered flux in the halo region to the total flux over all regions tends to decrease slightly with the source size. This is because the scattered fraction in the H II region increases with the source size, while the total scattered-fraction is independent of the size. The scattered fractions measured in various ways are summarized in Table 1. Obviously, the contribution of dust-scattered light to total flux depends on the dust optical depth as well as the geometrical configuration of the dust cloud. The dust-scattered component becomes more important when the dust opacity (here, hydrogen density) increases.
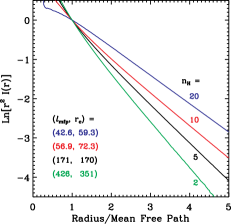
We also note that the surface brightness distribution of the individual dust-scattered halos at a large distance can be represented well by the following formula:
| (1) |
Here, and are the surface brightness at and the mean free path, respectively. is the dust extinction cross-section per hydrogen. Figure 2 shows the profiles of the dust-scattered halos surrounding a spherical source with a radius of 10 pc, in linear-logarithmic scale, in media with various dust densities corresponding to 2, 5, 10, and 20 cm-3, which are typical in the ISM. We fitted the asymptotic profiles at , and obtained the best-fit values of the characteristic scale length , which are consistent with the mean free path within a factor of 1.4. The mean free paths and the best-fit scale lengths are shown in the figure. Higher density resulted in a more extended profile than that expected by due to multiple scattering. The formula will be used to understand the increase of the [N II]/H and [S II]/H line ratios with decreasing H intensity in Section 4 as well as the global H morphology in face-on galaxies in Section 5.
Note that our results were inferred from two different spatial distributions of the photon source, i.e., sphere and shell, and therefore they are independent of the spatial distribution of H emission in H II regions. We confirmed the results again using more realistic emissivity distributions predicted from photoionization models in Section 3. We also note that scattering by dust within H II regions is not a major concern of the present study. The halos, which we are mainly interested in, are the results of scattering by dust in the lines of sight passing through the ISM outside of H II regions. Dust within H II regions contributes to the scattered light that is observed in the sightlines toward H II regions.
2.3. Comparison with Observations
Ferguson et al. (1996a) found that there is no evidence for halos around bright OB associations in the R-band continuum images, which they assume to be equally extended as the H halos surrounding H II regions if the H halos are indeed the result of dust scattering. Therefore, they concluded that the role of the dust scattering is negligible in the H emission surrounding bright H II regions. We here note that the H sources are mainly concentrated in relatively few bright H II regions of substantial H luminosity. On the other hand, the diffuse R-band continuum background in galaxy images is far more uniformly distributed spatially, because the R-band continuum sources do not just consist of OB associations but are made up mostly by later-type stars, including late-type giants, which have a much more uniform distribution than that of the OB associations. Accordingly, the dust-scattered halos surrounding OB associations in the R-band images would be hidden among the diffuse background, composed of widely distributed stellar sources and the dust-scattered light produced by them.
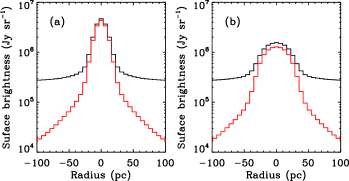
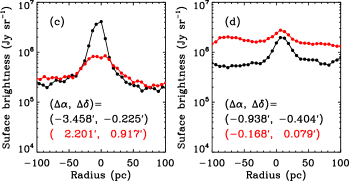
Typical H luminosities of bright H II regions, for example, in NGC 7793 analyzed by Ferguson et al. (1996b) are erg s-1. Assuming a typical H luminosity of erg s-1 and case B recombination, Lyc luminosity of a typical OB association is photons s-1, which is equivalent to the luminosity produced by 160 stars of O7V type (see Table 3 which will be explained in Section 3). Using the Kurucz stellar model (Castelli & Kurucz, 2003), R-band luminosity of the OB association composed of 160 O7V stars is erg s-1 Hz-1. We verified the estimated luminosities with an evolutionary synthesis code Starburst99 (Leitherer et al., 1999, 2010). Assuming a Salpeter initial mass function with a total mass of in the mass range of , an 1.3 Myr-old OB association produces the same Lyc and R-band luminosities as the above Kurucz model. Adopting the total R-band magnitude of 8.71 mag, corresponding to 1.01 Jy (1 Jy = erg s-1 cm-2 Hz-1), and the major and minor diameters of 9.3′ and 6.3′, taken from NASA/IPAC Extragalactic Database (NED), the average background surface brightness in R-band is Jy sr-1. The surface brightness of the galaxy shows a roughly exponential decrease with a scalelength of ( kpc) (Carignan, 1985). A similar brightness to the above average value is found at the galactocentric radius of from the radial profile. Using these values, we calculated the expected surface brightness profiles in R-band for OB associations with radii of 10 and 30 pc, as shown in Figures 3(a) and (b), respectively. In the calculations, we assumed that photon sources are uniformly distributed within the assumed radii and the hydrogen density was 10 cm-3. The calculated images were convolved with a two-dimensional gaussian function with a full width at half maximum of (17 pc at 3 Mpc) and the brightness profiles were obtained with a bin size of to match the seeing and pixel size of the observations of Ferguson et al. (1996b). Black curves show the resulting surface brightness profiles in the presence of the diffuse background, while red curves show the cases where there is no constant background. It is now clear that the dust-scattered halos of OB associations in R-band images are not observable. Red curves indicate that the dust-scattered halos can be observed only when there is no diffuse background, as in the case of H emission originating from relatively few H II regions.
We also examined the R-band image of NGC 7793 observed by the SIRTF Nearby Galaxy Survey (SINGS) (Kennicutt et al., 2003; Dale et al., 2007), which were obtained with the same telescope as used by Ferguson et al. (1996b). Figures 3(c) and (d) show examples of the observed R-band brightness profile around OB associations located at the coordinates , denoted in the figures, relative to the galactic center. In Figure 3(c), of which the samples are located at a galactocentric radius of , the black curve represents a typical sample of OB associations with the highest brightness contrast compared to their surrounding background, while the red curve shows a case with relatively low contrast. Figure 3(d) shows two more OB associations that are located closer to the galactic center. Because of a higher background level, the profiles near the galactic center have lower contrast. In general, brightness profiles of OB associations are more or less similar to one of the four examples in the figures, after multiplying a scale factor depending on location. The profiles tend to have sharper contrast at larger galactic radius, but not always. We note that the models in Figures 3(a) and (b) reproduce the observed profiles of OB associations in Figure 3(c) perfectly. Our models are also able to reproduce the brightness profiles shown in Figure 3(d) by varying the background level and the size of OB associations We, therefore, conclude that the presence of a continuum background washes out any observable trace of the scattered continuum halo of OB associations.
The next fact we need to note is that dust clouds far from H II regions can scatter H photons originating elsewhere in galaxies, as demonstrated for high-latitude clouds in the Milky Way (Mattila et al., 2007; Lehtinen et al., 2010; Witt et al., 2010). Filaments, patches, and arcs, which are often observed not only in the Milky Way but also in external galaxies, do not necessarily indicate in situ ionized gas. Unlike the assertion of Hoopes et al. (1996), these distinct features can be explained by dust scattering as well. In the halos of edge-on galaxies, very little correspondence between the H-emitting filaments and “absorbing” dust structures was found (Howk & Savage, 2000), which seems to indicate the physically distinct origins of dust and H-emitting material. However, we should note that the scattered intensity toward a dust cloud can be higher, lower, or equal to its surroundings (as demonstrated in Mattila et al., 2007), depending on the incident intensity from behind of the cloud and the cloud optical depth. A cloud with an optical depth can appear dark, while a cloud with a lower optical depth appears bright. Indeed, no correlation and anti-correlation between the dust-scattered FUV continuum background and dust has been found at high opacity regions (e.g., Seon et al., 2011a). As noted by Howk & Savage (2000), the dust filamentary features observed in edge-on galaxies are traced in absorption against the background starlight, thereby implying relatively opaque dust clouds . Therefore, no correspondence between the Hα-emitting filaments and absorbing dust features does not necessarily indicate the distinct origins of the dust and H filaments, but can also be a natural consequence of the combined effect of absorption and scattering at relatively high opacity.
It is also well known from the observations of face-on galaxies that the radial and azimuthal intensity distributions of the diffuse H emission are highly correlated with bright H II regions over both small and large scales (e.g., Walterbos & Braun 1994; Ferguson et al. 1996a, b; Zurita et al. 2002). In fact, the strong correlation of the halo brightness with that of the H II region is a natural consequence of dust scattering. The mean fraction of the diffuse H emission outside of H II regions is known to be roughly constant (), regardless of Hubble type and the star formation rate per unit disk area (Ferguson et al., 1996a, b; Hoopes et al., 1996; Greenawalt et al., 1998; Zurita et al., 2000; Voges, 2006; Oey et al., 2007). This mean value matches well with the dust-scattered fraction estimated in the present study, as shown in Table 1. In fact, it is easy to construct cases where the reflected nebular flux surrounding a star is comparable or even larger than the source flux (see Fig. 9 in Witt et al., 1982).
Zurita et al. (2000) found a weak tendency for the diffuse H fraction to increase with the galactocentric radius. The weak trend can be understood qualitatively, if the diffuse H emission is dominated by dust scattering. Sizes of H II regions would generally decrease with the galactocentric radius (e.g., Fich & Blitz, 1984). As we noted previously (Table 1), the dust-scattered fraction in the halo region slightly increases as the source size decreases. Therefore, the scattered diffuse H fraction may slightly increase with the galactocentric radius.
Here, we considered H halos around single H II regions. In a realistic case, the dust-scattered halos from adjacent H II regions would merge into each other and produce the pervasive H background surrounding H II regions. Therefore, we may need more detailed radiative transfer models for individual face-on galaxies as a whole system to investigate which mechanism, the dust-scattering of H or in situ photoionization by Lyc leakage, better explains the overall H morphologies of face-on galaxies. It is worthwhile to note that some quantitative analyses on the H morphology were already preformed by Zurita et al. (2002) and Seon (2009). In Section 5, we will show that their analyses for the H morphologies of face-on galaxies likely better support the dust-scattered H scenario than the Lyc leakage scenario.
In summary, the previous arguments based on the spatial extent or morphology of H halos to rule out the dust-scattering origin of the diffuse H emission are no longer valid. Instead, dust scattering explains the general properties of the diffuse H morphology very well.
3. Optical Line ratios
3.1. Basic Assumptions
We used the well-known one-dimensional photoionization code CLOUDY (version c10.00 of the code last described by Ferland et al. 1998) and the fully three-dimensional Monte Carlo photoionization code MOCASSIN (MOnte CArlo SimulationS of Ionized Nebulae; Ercolano et al. 2003, 2005, 2008) to model spherically-symmetric radiation-bounded H II regions surrounding single ionizing stars in a homogeneous medium. We also modeled ionized nebulae in a clumpy medium by using the MOCASSIN code.
Extensive calculations of H II region models were performed by varying elemental abundances, spectral type of the central ionizing source, and hydrogen number density. Various sets of elemental abundances have been previously used in modeling the WIM. In the present study, we used six sets of abundances, which are summarized in Table 2: new solar system, B star, Orion nebula, ISM, warm neutral medium (WNM) values, and WNM values with enhanced S abundance (hereafter, WNM2). The abundance of He is assumed to be 0.1 of the abundance of H in all six cases. The new solar system, ISM, and Orion nebula abundances are as defined in CLOUDY. The abundances for B star and WNM are defined in Sembach et al. (2000). The WNM abundances represent those observed in the well-studied warm diffuse clouds toward the low-halo star Columbae. The WNM abundances were also used by Mathis (2000). The WNM2 abundances were used by Wood & Mathis (2004) and are essentially the same as the WNM abundances except that the S abundance is increased by 0.2 dex. We note that the new solar abundances adopted in this paper are different from the old solar abundances used in Sembach et al. (2000). For the model calculations using CLOUDY, we assumed Orion dust grains for Orion abundances and ISM dust grains for the others, as defined in CLOUDY. In the MOCASSIN models, no grains were assumed. The effect of dust grains is mainly to reduce the ionized region. However, no significant effect on the line ratios is found (Mathis, 1986b). We ignored elements other than those shown in Table 2. The electron temperature and ionization structure of H II regions are mainly determined by H, He, N, O, Ne, and S, which are major coolants (e.g., Mathis, 1985). The elements that were not included in the calculations have no significant effect on the models of H II regions.
Spectra of ionizing stars are also needed to model photoionized nebulae. We considered only dwarf stars with spectral types from O3V to B1V. For each spectral type, we adopted a stellar temperature, radius, and effective gravity derived from the evolutionary tracks in Straižys & Kuriliene (1981). We calculated the spectral energy distribution and the hydrogen ionization luminosity for each spectral type with a grid of Kurucz models, which are plane-parallel line-blanketed model atmospheres in local thermodynamic equilibrium (LTE) (Castelli & Kurucz, 2003). Table 3 summarizes the stellar temperatures, radii , H-ionizing (Lyc) luminosities , He-ionizing luminosities , and gravities for the spectral types used in this study. The non-LTE (NLTE) WMBASIC model atmospheres (Pauldrach et al., 2001; Sternberg et al., 2003) are also used to calculate the one-dimensional H II regions and the results are compared with those obtained with the LTE atmospheres. Most of the photoionization models in the present study are calculated by using Kurucz’s LTE atmospheres, unless otherwise specified.
The model calculations using CLOUDY were terminated when the fraction of neutral hydrogen () reached 0.99, at which point the emissivities are very low. We found no significant difference when further calculations were performed beyond this value. Note that most of the one-dimensional WIM models used nebulae models with (Mathis, 1986a) or combinations of models with and to explain line ratios (Domgörgen & Mathis, 1994; Sembach et al., 2000; Mathis, 2000). For the models calculated with MOCASSIN, the sizes of density grid structures were decided to be at least 20% larger than the Strömgren radius calculated with CLOUDY to take the effect of absence of dust into account and ensure the models cover the whole ionized regions. Reflection symmetry in the -, -, and -directions was assumed for fast calculations. The number of grids is for the MOCASSIN models.
We present only the emission lines H, [N II] 6583, and [S II] 6716, which were best investigated in the Milky Way, and He I 5876, which can best constrain the spectral type of ionizing stars. The volume emissivities of H, He I, [N II], and [S II] lines obtained using the CLOUDY and MOCASSIN models were used as input emissivity distributions to calculate the dust-scattered halos of the optical lines surrounding H II regions. For the dust halo models of spherically-symmetric H II regions calculated with the CLOUDY code, the initial radial coordinates of photons were determined by the volume emissivity of each optical line at a radius , i.e., . In the dust-scattering models of the H II regions calculated with the MOCASSIN code, the initial coordinates of photons were randomly selected to follow the volume emissivity , i.e., , and their initial directions were randomly chosen from an isotropic distribution.
3.2. One-dimensional Models
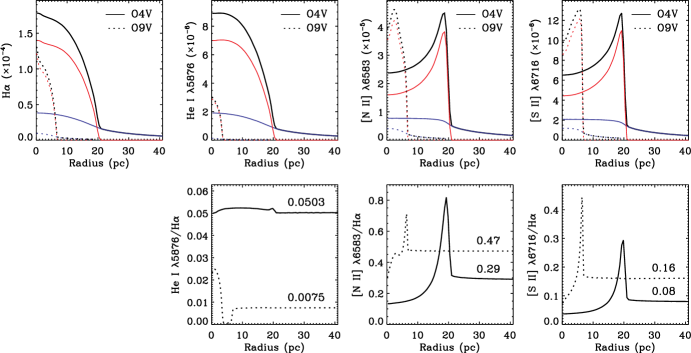
We first modeled the one-dimensional H II regions by varying hydrogen number density , elemental abundances, and spectral type of the central ionizing source. Hydrogen number density was varied as 0.1, 1, 10, and 100 cm-3. Figure 4 shows brightness profiles of line intensities (H, He I, [N II], and [S II]) and intensity ratios (He I/H, [N II]/H, and [S II]/H), projected onto the sky, for various spectral types of ionizing source. In the figure, the hydrogen density and elemental abundances were assumed to be 10 cm-3 and WNM, respectively. The curves from the outermost to innermost correspond to later type stars progressively. The outermost curve, corresponding to the largest H II region, is obtained from an O3V star, and the innermost curve corresponds to a B1V star.
Emissivities of the low ionization lines [S II] and [N II] increase suddenly near the ionization boundary of the H II region, for most of ionizing stellar types except B1V, and then drop, whereas the H and He I recombination lines (RLs) decrease continuously. In other words, both [N II] and [S II] arise primarily in the transition region between the ionized and partially ionized zones of the H II region (e.g., Evans & Dopita, 1985). Therefore, the line ratios of [S II]/H and [N II]/H increase rapidly at the ionization boundary. Such a rapid increase in the line ratios at the ionization boundary is shown in the Orion nebula (Pogge et al., 1992; Sánchez et al., 2007; Mesa-Delgado et al., 2011). The giant H II region NGC 595 in M 33 also shows an increase in the line ratios at the ionization boundary (Relaño et al., 2010).
The line ratio [N II]/H shows a less rapid increase at the boundaries than [S II]/H. S+ is much more confined to the outer regions of the Strömgren sphere than is N+ (Mathis, 2000). The reason is that the change in the predominant ionization state between the central and outer H II regions is smaller for N because of its higher ionization potential for N+ N2+: the ionization potentials for N+ N2+ and S+ S2+ are 29.6 eV and 23.3 eV, respectively, and therefore S exists in the doubly ionized state out to larger radius than N.
For the hottest (O3V and O4V) stars, which emit a sufficient number of photons at higher energies than the He0 ionization potential (24.6 eV), photons with < 24.6 eV run out slightly faster than those with > 24.6 eV at the ionization boundary. This resulted in a less rapid decline of the He I line intensity than H and a weak spike in the line ratio He I/H at the ionization boundary, as shown in Figure 4. However, for later stars, He becomes neutral at the inner zone relative to H, and thereby He I/H line declines rapidly at a much smaller radius than the Strömgren radius.
As already noted, the surface brightness of the dust-scattered halo depends on the total luminosity of the source only, for a fixed dust configuration. Therefore, the intensity ratio of a pair of emission lines in the dust-scattered halo is expected to be determined by the ratio of total luminosities of the lines, rather than by the ratio of surface brightnesses at the main part of the H II region, if their wavelengths are close enough to each other. If their wavelengths are different to the extent that dust extinction cross sections and albedos are significantly different, their ratio in the dust-scattered halo would also differ from the luminosity ratio. In the brightness profiles, the highest [N II] and [S II] intensities occur in relatively small regions at the ionization boundary. However, the transition zones can contribute significantly to total luminosities because the luminosities are defined by integrals and the highest emissivities of [N II] and [S II] are found at the largest radii. Therefore, the line ratios of [S II]/H and [N II]/H at the dust-scattered halo should be larger than the values at the central part of the H II region, but lower than the values at the boundary as a result of dust-scattering.
Figure 5 shows the dust-scattered halo profiles of emission lines originating from H II regions surrounding O4V and O9V stars, in the homogeneous dusty medium with hydrogen density of 10 cm-3 and the WNM abundances. The top panels of the figures show brightness profiles of line intensities of H, He I, [N II], and [S II]. Total (scattered + direct), direct, and scattered intensity profiles are denoted by black, red, and blue curves, respectively. By comparing the figures, we can confirm the result that the more extended source (O4V) produces a brighter dust-scattered halo. The dust-scattered component within the H II region surrounding an O4V star is also higher than the less-extended H II region surrounding the O9V star. The bottom panels show the line ratios He I/H, [N II]/H, and [S II]/H. It is clear that the line ratios [N II]/H and [S II]/H outside of H II regions are higher than those at the central regions and lower than those at ionization boundaries. The He I/H profile for the O4V star shows a weak spike at the ionization boundary. On the other hand, the profile for the O9V star shows a large dip at the zone where helium is neutral but hydrogen is still ionized. In the zone, the directly-escaped lines without interaction with dust grains dominate the line ratio He I/H while the dust-scattered light determines the line ratio outside of the H II region. These line ratios found in the dust-scattered halos outside of the H II regions match exactly the luminosity ratios found in the H II regions, except for a negligible difference in the He I/H ratio caused by their wavelength difference. Therefore, we can refer to the luminosity ratios, for the purpose of estimating the line ratios in the dust-scattered halos, without detailed calculations of the dust scattering effect.
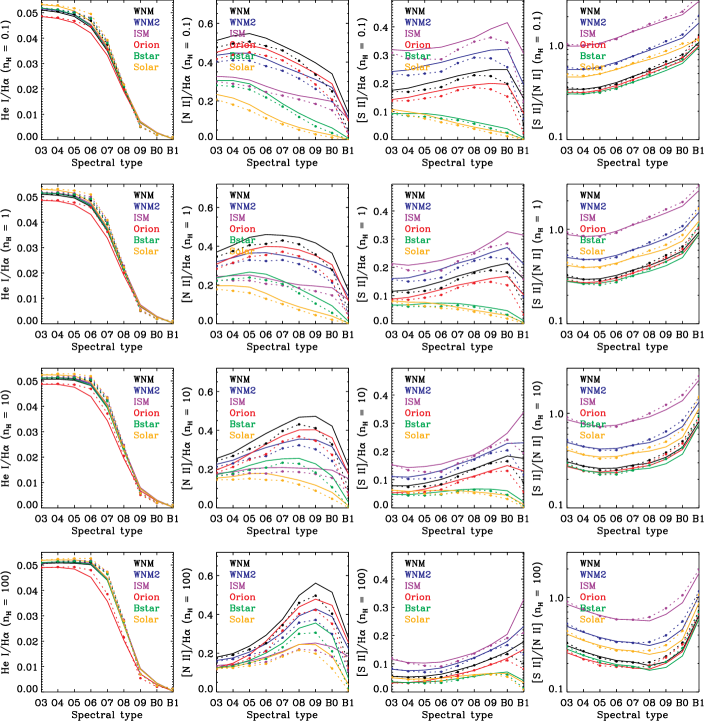
Figure 6 shows the luminosity ratios of He I/H, [N II]/H, [S II]/H, and [S II]/[N II] for various hydrogen density, abundances, and spectral types of ionizing stars. In the figure, the results obtained not only with the Kurucz (denoted by solid lines), but also with WMBASIC (dashed lines with dot symbols) stellar models are shown. The line ratio He I/H is quite independent of elemental abundances and hydrogen density, while [N II]/H and [S II]/H show large variations. Early type stars always produce higher He I/H ratios than late type stars. The Orion abundances yield slightly lower He I/H ratios compared to other abundances, especially for early type stars. The stellar type giving the highest [N II]/H ratio varies with hydrogen density, for a given set of abundances. At high densities, the highest [N II]/H ratio is obtained from relatively late type stars as compared to at low densities. For example, for the WNM abundances, the highest value at cm-3 is obtained from an O9V star while an O5V star gives the highest value at cm-3. Ignoring the B1V star, the line ratio [S II]/H increases with decreasing stellar temperature, except for B stars and solar abundances, for a given set of abundances. We also note that the lowest value of [S II]/[N II] has similar dependence on the stellar type as the highest value of [N II]/H do. At high densities, the lowest value of [S II]/[N II] is obtained from relatively late type stars as compared to at low densities. It is also clear that abundances affect the line ratios [N II]/H and [S II]/H significantly. The highest [N II]/H and [S II]/H ratios are obtained with the WNM and ISM abundances, respectively, for a given stellar type. Their lowest values are generally obtained with the solar abundances. The abundances of B stars also give relatively low values of [N II]/H and [S II]/H. It is also worthwhile noting that the variations of line ratios due to the difference in the adopted stellar models is less sensitive than due to the abundances difference.
We should note that the line ratios are intricately tangled with the adopted abundances. For example, the S abundance of WNM2 is 0.2 dex larger than that of WNM, while abundances of other elements are the same. The [S II]/H line ratio obtained from the WNM2 abundances is then obviously higher than that from the WNM abundances. However, the [N II]/H line ratio of the WNM abundances does not remain constant, but becomes lower. Note also that even though the N abundance between ISM and Orion differs only by 0.05 dex, the [N II]/H line ratio obtained from the ISM abundances is lower than that from the Orion abundances by a factor of up to because the S abundance of ISM is 0.5 dex larger than that of Orion. This is because increasing the S abundance changes the heating and cooling of ionized gas in a complex manner.
We now compare the results with the observed line ratios. The typical values of [N II]/H and [S II]/H toward local diffuse gas in the Milky Way are 0.3–0.6 and 0.2–0.4, respectively, and they vary substantially from sightline to sightline. In contrast, classical H II regions all cluster near [N II]/H 0.25 and [S II]/H 0.1. The He I line is much fainter (He I/H 0.02) and has been studied only in a few selected directions. The observed values of [N II]/H and [S II]/H toward local diffuse gas are best represented by the models with the WNM and WNM2 abundances. Although early types can reproduce the observed values of [N II]/H at low densities, they cannot reproduce the observed values of [S II]/H and He I/H. In particular, the observed ratio of He I/H strongly constrains the spectral type of the ionizing stars to O8 or later. The line ratio of [S II]/[N II] 0.5–0.7 is also reasonably well explained with late O stars and the abundances of WNM and WNM2. We therefore conclude that late OB stars are the best candidates to match the observed line ratios of He I/H, [N II]/H, [S II]/H, and [S II]/[N II]. In addition, our results indicate that the elemental abundances should be close to those of WNM and WNM2 to reproduce the observed line ratios. The solar and B star abundances do not match well the observed line ratios, except for the case of the highest density ( cm-3). The Orion abundances match the observed [N II]/H ratio, but yield slightly weaker [S II]/H ratios than the observed values. Inversely, the ISM abundances explain the observed [S II]/H, but underpredict the [N II]/H ratio.
3.3. Three-dimensional Models
In the previous section, we described the photoionization models in the homogeneous ISM. However, the real ISM has a filamentary and/or clumpy structure. A photoionized nebula in a clumpy medium has different ionic abundances and temperature variation from the models in a uniform medium (Mathis & Wood, 2005). The emission coefficients of collisionally excited lines (CELs), such as [N II] and [S II], increase strongly with increasing temperature, while those of RLs, produced by electron cascades following recombination, are not particularly temperature sensitive. Therefore, the luminosity ratios between CELs and the RL H in clumpy models would be different from those in uniform models.
To investigate the effect of clumpiness, we first calculated uniform density models (denoted with a letter “U”) with the MOCASSIN code. The hydrogen density of 10 cm-3 was assumed for the uniform models. We next calculated H II models in a clumpy medium, assuming a two-phase medium comprising high density clumps embedded in a low density interclump medium. The volume-averaged density of hydrogen was also assumed to be 10 cm-3, as in the uniform models. Two values of clumpiness, which can be defined by the density ratio between dense clumps and interclump medium, were considered. In the first type of clumpy models (“C1”), dense clumps (cells) have a hydrogen density of 20 cm-3 and occupy a volume fraction of 1/3. The remaining interclump cells have a density of 5 cm-3. In the second type of clumpy models (“C2”), clumps have a density of 30 cm-3 and occupy 1/4 of the total volume. The hydrogen density of the interclump medium is then assumed to be 10/3 cm-3. The second type is clumpier than the first. For each type of model, clump cells with high density were randomly cast to occupy the volume fraction and the remaining cells were then assumed to have lower density. Spectral types of ionizing source and elemental abundances were varied as in the one-dimensional models, for each clumpiness (Tables 2 and 3). We note that Mathis & Wood (2005) assumed a hierarchical density structure for a clumpy medium and compared the resulting ionic abundances, but not line ratios, with those from the model with uniform density.
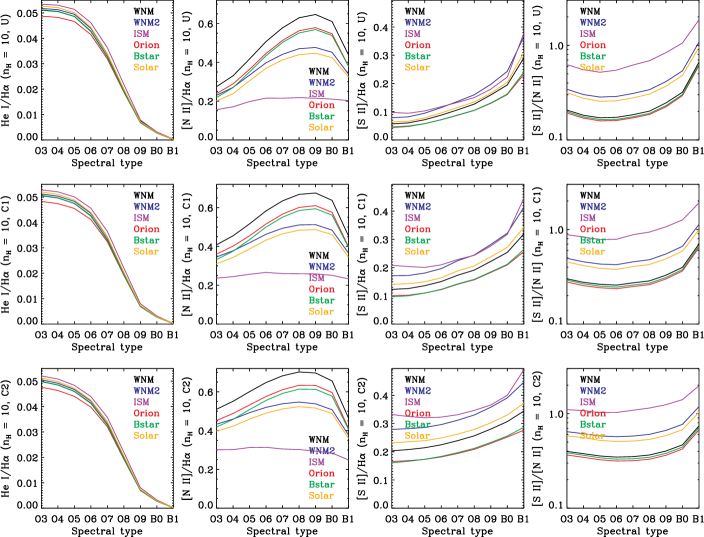
Figure 7 summarizes the luminosity ratios of He I/H, [N II]/H and [S II]/H obtained from the uniform and clumpy models. We first compare the uniform models with the CLOUDY models. The overall dependences of the line ratios in the uniform model on the stellar type are generally consistent with the results from the CLOUDY model. We note, however, that [N II]/H ratios are generally higher than those from the corresponding CLOUDY models, except for the case of the ISM abundances. For early-type stars, the [S II]/H ratios are slightly lower than those obtained from the CLOUDY models. On the other hand, for the late-type stars, the line ratios [S II]/H are higher than those obtained from the CLOUDY models.
In the figure, the most important result is that the photoionized H II regions in the clumpy medium produce higher line ratios of [N II]/H and [S II]/H than in the uniform medium. The line ratios [N II]/H and [S II]/H increase as clumpiness increases, while the change in the He I/H ratio is negligible. This is because dense clumps tend to absorb more H- and He-ionizing photons than the interclump medium and thus the clumps have higher temperature than the gas in the uniform models. Luminosities of [N II] and [S II] are strongly biased to high density regions because their emission measures are highly sensitive to temperature and density. Therefore, their luminosities increase with clumpiness while the H and He I luminosities remain constant within 2%. Another interesting result is that the ratios of [N II]/H and [S II]/H increase rather rapidly with clumpiness for early-type stars, but less rapidly for late-type stars. The [N II]/H ratio of the “C2” models is larger than that of the uniform models by a factor of 1.9–2.0 for O3V star and a factor of 1.1–1.3 for O9V star, depending on the adopted abundances. The [S II]/H ratio is increased by a factor of 2.4–2.7 for O3V star and a factor of 1.8–2.0 for O9V star. It is also worth noting that the [S II]/[N II] ratio becomes less dependent on the stellar type as clumpiness increases.
Note that the line ratios of [N II]/H, [S II]/H and [S II]/[N II] depend strongly on the elemental abundances. The line ratio of [N II]/H obtained from the “C2” models, except those with the ISM abundances, matches well the observed ratio in the diffuse ISM, regardless of the stellar type. In particular, a [N II]/H line ratio of up to is predicted for the WNM abundances and O9V star. However, the stellar type of the ionizing source is strongly constrained to O8V or later-type stars by the observed ratio of He I/H, as in the CLOUDY models.
The differences of the [N II]/H and [S II]/H line ratios in the MOCASSIN models from those of the CLOUDY models might be due to atomic data differences adopted in the codes. For example, the data set for collision strengths, transition probabilities, and energy levels was adopted from version 5.2 of the CHIANTI atomic database (Landi et al., 2006). However, the CHIANTI database is not included by default in calculations with the CLOUDY code. We also note that reliable data for the recombination rate coefficients for S are not available, except S2+. The fact that the models with the WNM and WNM2 abundances produced significantly different [N II]/H ratios demonstrates the complicated relationship between the atomic species. Using the WNM2 abundances in the MOCASSIN models, we also obtained the same trend as in the case of the CLOUDY code. Therefore, judging which models are more reliable over others without reliable atomic data sets would be impractical. However, it is true that clumpy models produce higher line ratios than uniform models. The clumpy models considered in the present study demonstrate the effect of clumpiness. A more realistic clumpy medium, such as a hierarchical density structure, might help to understand the effect of clumpiness in photoionization models.
We now examine the detailed profiles of the dust-scattered halos surrounding H II regions calculated with the clumpy models. For the dust radiative transfer models, we assumed a dusty cloud with a constant density of cm-3. The physical dimension of the cloud was the same as in the CLOUDY models. For the clumpy medium models, we may need to use the same clumpy density distribution as used in the photoionization models. However, because the optical depths within the H II regions are small and the clumpiness in the dust cloud does not affect the line ratios, we ignored the clumpiness in the dust cloud. Figure 8 shows the brightness profiles of the [N II]/H and [S II]/H line ratios in the H II regions produced by O4V and O9V stars and their dust-scattered halos. The results were obtained from the uniform and clumpy “C2” models with the WNM abundances. It is obvious that both line ratios are increased in the clumpy models. However, the maximum ratios show somewhat different behavior. The maximum value of [N II]/H near the ionization boundary increased with clumpiness for early-type stars, such as O3V, while the maximum value decreased for late-type stars. On the other hand, the maximum value of [S II]/H always increased with clumpiness, regardless of stellar type.
This property may be largely related to the fate of He-ionizing photons. As noted in Mathis & Wood (2005), the most important factor to determine the ionization states in a clumped density distribution is the fate of He-ionizing radiation, depending on the hardness of the stellar radiation. Hot early-type stars produce such plentiful He-ionizing photons that the He ionization zone coincides with the H ionization zone in a uniform medium. The effect of the clumpy medium is to decrease the ionic fraction (He+/He) and reduce the size of the He ionization zone. The ionic fraction (N2+/N) follows a similar pattern as He+. Therefore, the ionic fraction (N+/N) increases near the ionization front and thus increases the maximum value of [N II]/H. However, the He ionization zone for cool later-type stars is smaller than the H ionization zone. In this case, the He-ionizing photons tend to penetrate dilute interclump regions beyond the He ionization zone that is expected from uniform models. The same effect is applied to N2+, and thus (N+/N) becomes a bit lower at the ionization boundary compared to the uniform models. On the other hand, since the ionization potential for S+ S2+ is smaller than the He-ionizing potential and the ionization potential for S0 S+ is smaller than the H-ionizing potential, the total ionic fraction of S+ and the maximum value of [S II]/H always increase with clumpiness, regardless of the stellar type of the ionization source.
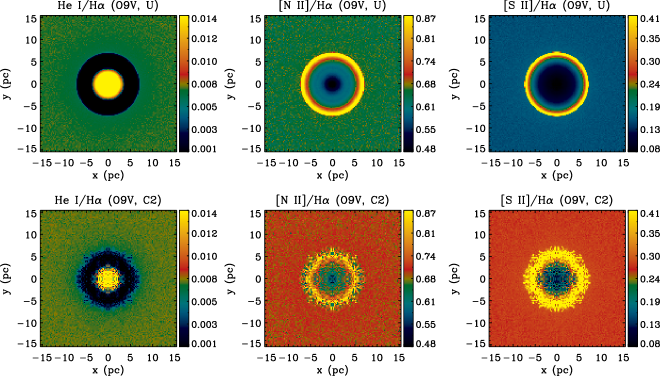
Figure 9 shows sample images of the line ratios calculated for an O9V star to demonstrate the difference between the uniform and clumpy models. It is clear that transition regions in the line ratio maps near the ionization boundary become less sharp for the clumpy models. In some cases, the clumpiness may produce a smooth transition zone and the line ratios would smoothly change to the background values, as in the model of the H II region surrounding the O9.5 V star Oph (Wood et al., 2005).
4. Effect of Stellar H Absorption Line
In the previous section, we reproduced the typical values of the [N II]/H and [S II]/H line ratios in the diffuse ISM regions by photoionization due to late OB stars. However, the highest line ratios may require additional non-ionizing heating sources, which will be discussed in Section 5. We here consider another possibility to explain the elevated [N II]/H and [S II]/H line ratios in the faint H regions, which has never been discussed sufficiently in analyzing the diffuse optical emissions.
4.1. Implications from Integrated Spectra of Galaxies
We should note that most, if not all, of the spiral galaxies, including the Milky Way, showing the diffuse H emission outside of bright H II regions are Sb or later types, including irregulars (e.g., Rossa & Dettmar, 2003; Hunter & Gallagher, 1990; Kennicutt et al., 1995), in which the underlying stellar continuum is dominated by B- and A-type stars (Kennicutt, 1992a, b). Balmer absorption lines in the underlying stellar continuum can give rise to underestimation of the diffuse H intensity and overestimation of the line ratios of forbidden lines, such as [N II] and [S II], over H. The equivalent widths (EWs) of the Balmer absorption line as a function of stellar spectral type are given by Pickles (1998). The maximum H absorption EW of Å occurs at early A-type stars. Bica & Alloin (1986) shows the EW of the H absorption line as a function of age in an evolving stellar population. For a Sb or Sc disk galaxy with a mixed population, it appears that an H absorption EW of Å should be expected for the background faint star population outside of OB associations. The EWs of nebular emission lines in the integrated spectra of Sb and Sc galaxies are Å (Kennicutt, 1992a, b; Sodré & Stasińska, 1999). Therefore, the underlying H absorption line would appreciably increase the line ratios [N II]/H and [S II]/H not only in the integrated spectra, but also in the diffuse ISM regions. For example, for galaxies with the emission EW of Å, the line ratios will be increased by a factor of 2. The effect of H absorption becomes less important for the galaxies with older stellar population. However, even the oldest stellar population with an age of Gyr has an absorption EW of Å (Bica & Alloin, 1986).
Since about half of the H emission is known to originate from the diffuse ISM regions (DIG) and the mean ratios of [N II]/H and [S II]/H in the DIG is higher than those in H II regions by a factor of , the line ratios in the integrated spectrum over an entire galaxy are expected to be higher than the mean values of H II regions by a factor of . We therefore expect that the line ratios of integrated spectra of star forming galaxies, after correction of the underlying stellar absorptions, would be significantly different from those of individual H II regions in the diagnostic line-ratio diagrams (i.e., the BPT diagram; Baldwin et al., 1981; Vielleux & Osterbrock, 1987), if the enhancement of the line ratios in the DIG were not due to the underlying Balmer absorption lines.
Lehnert & Heckman (1994) used the integrated optical spectra of galaxies, published by Kennicutt (1992a, b), with H emission-line EWs 30Å in order to avoid errors in the measured line ratios caused by underlying stellar absorption lines. They corrected the measured line ratios assuming that both the H and H stellar absorption lines have EWs of 5Å and found that in general the line ratios in the integrated galaxy spectra occupy a region that is intermediate between H II regions and the AGNs. The resulting [S II] 6716, 6731/H ratios, for a given [O III] 5007/H, were typically a factor of larger, while the [N II] 6783/H ratios were more similar to those of H II regions, only being typically enhanced by %, which is not very significant and well within the scatter expected for individual H II regions. They therefore concluded that at least 25% of the observed H flux in their sample galaxies would arise in the DIG.
However, more recent results seem to indicate no significant difference between individual H II regions and star-forming galaxies in the diagnostic diagrams, after careful subtraction of the underlying Balmer absorption lines. Using the same dataset as Lehnert & Heckman (1994), Sodré & Stasińska (1999) made a better correction for the stellar absorption EWs by correlating the observed H and H EWs. They found that the diagnostic diagram of integrated ratios [O III]/H versus [N II]/H follows the sequence of the giant H II regions very well. In their diagram of [O III]/H versus [S II]/H, the absorption-corrected ratios are also well within the H II region sequence (except that those with [O III]/H lie at the upper boundary defined by individual H II regions). Moustakas et al. (2006) used a spectral synthesis fitting code to find the stellar model continuum, including Balmer absorption lines, that optimally reproduces the integrated continuum spectrum and estimated pure nebular emission line EWs of 412 star-forming galaxies after subtracting the best-fit continuum spectra. They noted that the sequences formed by individual H II regions and star-forming galaxies overlap across the full range of emission-line ratios in the [O III] 5007/H versus [N II]/H plane. However, in the [N II]/H versus [S II]/H plane (Fig. 7 of Moustakas & Kennicutt, 2006), the absorption-corrected line ratios preferentially lie at or slightly outside the envelope defined by H II regions. We note that this cannot be caused by a relative enhancement or reduction of the integrated [N II]/H ratios compared to the ratios of H II regions, but can be caused by an enhancement of the [S II]/H ratios in integrated spectra by about 0.1 dex. We also note that Fig. 1 of Brinchmann et al. (2004), which was obtained by fitting the stellar synthesis model continuum to the Sloan Digital Sky Survey data, shows that star-forming galaxies lie at the same locations as H II regions in the diagnostic diagram of [O III]/H versus [N II]/H.
Unlike the absorption-corrected line ratios in the integrated galaxy spectra, the line ratios observed in the DIG are significantly different from individual H II regions in the diagnostic diagrams (see Fig. 7 of Moustakas & Kennicutt (2006) and Fig. 2(a) of Flores-Fajardo et al. (2009)). Therefore, the enhancement of [N II]/H in the diffuse ISM regions may be due mainly to the underlying absorption lines. In other words, the ratio of [N II]/H in the diffuse ISM or DIG regions is not likely to be significantly different from that of H II regions if the underlying stellar absorption lines are properly appreciated. In the case of [S II]/H, the line ratios observed outside H II regions, after correction of the stellar absorption line, may be slightly larger than that of H II regions. However, the enhancement would be only by a factor of , taking into account the facts that half of the optical lines originate from the diffuse regions and the ratio in integrated spectra is only 0.1 dex higher than that of H II regions. It is also worth noting that the [S II] line arises not only in the H+/H0 interface regions of ionized nebula, but also in the H0–C+ regions of photodissociation regions (PDRs) illuminated by strong FUV radiation, because the ionization potential of S0 is low (10.36 eV) (Petuchowski & Bennett, 1995; Störzer & Hollenbach, 2000). Störzer & Hollenbach (2000) found that the relative strength of PDR emission to H+/H0 interface emission is . Therefore, in a certain condition with high density and strong FUV radiation, the PDR may contribute to the [S II] flux in integrated spectra of star forming galaxies. Taking the contribution of PDR emission into account, the difference in the [S II]/H line ratio between the DIG and H II regions would be reduced even further. However, it is not certain, at this point, how significantly the PDR emission would contribute to the integrated spectra of star forming galaxies. The [S II] flux from PDRs may yield a spatially dependent contribution to the [S II]/H line ratio because molecular clouds and PDRs are rarer, especially, in interarm regions.
We also note that some authors assumed the same EW for all Balmer absorption lines (H, H, H, and H) (e.g., Lehnert & Heckman, 1994; Lee et al., 2004). We obtained EW(H) = 1.52 EW(H), EW(H) = 1.38 EW(H), and EW(H) = 1.36 EW(H) by fitting the stellar spectral data in Pickles (1998). Therefore, the EWs of H, H, and H could be assumed to be the same. However, assuming the same EW for H and H would cause not only an error in dust extinction correction, but also a shift in the diagnostic diagrams, such as [O III] 5007/H versus [N II]/H.
In summary, it is likely that the line ratios observed in the DIG are not significantly different from those of H II regions. In the following section, we will further demonstrate how the stellar absorption lines are able to increase substantially the line ratios in the diffuse ISM regions.
4.2. Effect on the Lines Ratios in the Diffuse ISM
If significant variations occur in stellar populations vertically as well as across spiral arms, the faint H regions would be significantly affected by the absorption feature in the underlying continuum. OB stars are usually concentrated at star forming regions in spiral arms, while A- and later-type stars are relatively widespread. The scale-height of late-type stars is also higher than those of earlier types. Therefore, not only the direct starlight, but also the scattered light from late-type stars would be much more extended than those from OB stars. In our Galaxy, for example, the sky can be divided into places where OB stars or A-type stars are dominant, as clearly shown in Figure 15 of Seon et al. (2011a). Within and near H II regions, the stellar continuum would be dominated by OB stars and the H emission line would overwhelm the underlying H absorption feature in the continuum component from later-type stars. At locations far from OB stars, where later-type stars dominate the continuum, the H emission line will rapidly decrease while the underlying H absorption line is far more uniform. Therefore, the absorption feature would carve out the emission line. The effect of the H absorption feature in the continuum would gradually increase with the distance from bright H II regions and with a decrease of the H intensity. Therefore, the stellar absorption feature should significantly influence faint areas where the continuum is dominated by A- or later-type stars.
We can quantitatively demonstrate how the underlying H absorption line can significantly affect the measured line ratios, if the diffuse optical emission lines are mostly caused by dust scattering of photons originating from bright H II regions. First of all, we assume that the surface brightness of the dust-scattered continuum from an OB association decreases as in Equation 1, while the diffuse continuum background surrounding the OB association is dominated by late-type stars and thus spatially uniform. The observed line ratio [N II]/H (or [S II]/H) at a distance (from the OB association) larger than the mean free path () in the dust-scattered halo of the OB association can be related to the real emission line ratio () by
where and denote the H absorption EW measured relative to the diffuse continuum background () and the emission EW relative to the continuum of the OB association (), respectively. In the dust-scattered halo, the EWs are constant. The emission line ratio will be constant in the dust-scattered halo, while the line intensities decrease together with the continuum intensity from the OB association as distance increases. In general, of bright H II regions in disc galaxies ranges from 100Å to 1500Å, with a mean value of 400Å (Bresolin & Kennicutt, 1997). As noted earlier, the most probable absorption EW would be Å (Bica & Alloin, 1986). We consider, however, not only the most probable Å but also the worst case of Å. From Figures 2 and 3, we can assume, for cm-3, that at = 57 pc and . Figure 10 shows the resulting enhancement factor of the line ratio as a function of distance for various combinations of (, ). As shown in the figure, the line ratio increases significantly within a few hundred pc. The enhancement factor increases at closer distance when the absorption EW is higher and/or the emission EW is lower.
Note that the forbidden-to-H line ratios, especially [S II]/H, are observed to be enhanced by a factor of up to 8 (or more) compared to the ratios in H II regions (e.g., Fig. 12 in Madsen et al., 2006). However, such a large increase by a factor of seems to be rare. In this regard, it is important to note that the line ratio increases relatively slowly up to a factor of and then rapidly beyond the point. Therefore, the enhancement factor would be found only in a small outermost part of the halo and be rarely observed. In addition, we assumed only a single H II region and its scattered halo. In reality, there should be other H II regions. The emission-lines (H, [N II] and [S II]) originating from the neighboring H II regions will be scattered to the halo under consideration. The scattered H from other H II regions may soften the H absorption effect and the rapid increase of line ratios at the outermost part of the halo.
In the Wisconsin H Mapper (WHAM) survey of the Milky Way, the bright stars with were flagged to denote possible contamination due to strong H absorption features (Haffner et al., 2003). However, there still remains dust-scattered starlight called DGL (Toller et al., 1987; Brandt & Draine, 2012) and light from stars with . The average EW of the diffuse H background of our Galaxy is estimated to be 11Å (Brandt & Draine, 2012), assuming the interstellar radiation field of Mathis et al. (1983). In the external galaxies, the H absorption feature in the underlying continuum both from unresolved stars and the diffuse dust-scattered starlight would hamper the estimation of the line ratios. To the best of our knowledge, Walterbos & Braun (1994) was the only one in which the effect of underlying Balmer absorption lines was discussed in investigating line ratios in the diffuse ISM. For M 31, the integrated H flux corresponds to an EW of only 4–6 Å (Walterbos & Braun, 1994). Therefore, the underlying H absorption line is expected to strongly affect the observed line ratios in the diffuse ISM regions. Broadband surface photometry of M 31 shows typical colors of , and , which are different from a pure A-star spectrum. This led Walterbos & Braun (1994) to claim that the effect due to the H absorption line are not likely to be important. They also performed a simple test, to reduce the effect of underlying H absorption line, by subtracting a 10% lower continuum from the H filter image and found no evidence on the effect in the H map. However, as noted by them, a more detailed test requires high-resolution multicolor imaging, combined with spectroscopy to constrain the stellar population and its small scale variations.
5. Discussion
In this section, we present additional support for our results and argue the necessity of reconsidering the dust-scattering origin of the diffuse H emission more seriously. In fact, we should note that there is no direct evidence, given the results presented in the previous sections, supporting the contention that most of the diffuse H emission originates from in situ ionized gas. The previous studies of Mattila et al. (2007), Witt et al. (2010), and Seon et al. (2011b) have mainly dealt with the dust-scattered H photons at high Galactic latitudes. The present results strongly suggest the significance of dust scattering in the diffuse H emission not only at high-latitude clouds but also near H II regions.
5.1. Dust-Scattered H Halos
There is observational evidence that at least some parts of the diffuse H emission outside of classical bright H II regions may be in fact caused by dust scattering. If the dust scattering is the dominant source of the diffuse H halos around the bright H II regions, the halos would not be observable or would be very faint in a radio recombination continuum that is almost free from dust-scattering. In this way, at least some part of the extended H halo of the Orion H II region was attributed to the dust-scattered halo (Subrahmanyan et al., 2001; O’Dell & Goss, 2009). More direct evidence of dust-scattered origin of the H halo can be provided by observations of the H polarization. Topasna (1999) attempted to detect H polarizations by selective extinction in the Monoceros supernova remnant, the Rosette Nebula, and the North America Nebula. While these were not detected, H polarizations by scattering in dust shells around the Rosette Nebula and the North America Nebula were instead observed.
Additional support for the importance of dust scattering in the diffuse H emission is provided from the large scale surveys of our Galaxy. Kutyrev et al. (2001, 2004) carried out a pilot survey of the Galactic plane with 2.17 m Br hydrogen RL, which is relatively free from dust-scattering, and found a typical filling factor of a Br-emitting gas of %, which is much smaller than the value derived for H. Recent observations using the Wilkinson Microwave Anisotropy Probe have found that the ratio of the free–free radio continuum to Hα is surprisingly low in the WIM (Davies et al., 2006; Dobler & Finkbeiner, 2008a, b; Dobler et al., 2009; Gold et al., 2011). These discrepancies likely suggest the significant role of dust scattering in producing the diffuse H emission outside of bright H II regions. However, we note that this discrepancy is not just present in regions where dust scattering may contribute, but even in regions that appear to be rather dust free, e.g., the Gum nebula. The cause of this observed fact may therefore be more complex and involve other factors besides scattering.
It is also of interest to note that a correlation between H and the anomalous dust emission at GHz, which is attributed to spinning very small dust grains, is found in the WMAP data (Dobler & Finkbeiner, 2008a, b). The spectrum of H-correlated microwave emission does not follow the expected free-free spectrum from the WIM, but the electric dipole emission from rapidly rotating dust grains. Since then, there have been a number of studies showing the association of peaks in the anomalous dust emission with individual interstellar clouds (e.g., Vidal et al., 2011). The spinning dust microwave emission is simply the signal from the smallest component of the grain size distribution in interstellar space. The correlation of the anomalous dust emission with H is explained most readily, if a significant fraction of the H is also coming from dust via scattering.
The photoionization models of the diffuse H emission assume no significant absorption of the Lyc (Domgörgen & Mathis, 1994). A widely accepted view for the almost-free escape of Lyc from the bright H II regions is to assume a highly clumpy or turbulent density structure of ISM with a lot of almost-empty space. Ferguson et al. (1996a, b) found a clear correlation between the diffuse H intensity and the surface brightness of H II regions on both large and small scales. This correlation was regarded to be evidence that the Lyc leakage is the dominant source responsible for producing the diffuse H photons. However, as we demonstrated, the radiative transfer models for the dust-scattered halos around single H II regions can reproduce the basic properties of the H halos surrounding H II regions in face-on galaxies. An advantage of the dust-scattering scenario investigated in the present study over the in situ ionization scenario would be the fact that the diffuse H fraction of % can be explained naturally.
Since the analysis was based on the halos surrounding single H II regions, it is necessary to investigate if dust scattering can indeed explain the global H morphology, which may be an overlapping of the dust-scattered halos surrounding individual H II regions, of the face-on galaxies. In this regard, we point out that the analyses of Zurita et al. (2002) and Seon (2009), which were initially intended to explain the global H morphology in terms of photoionization models, can be interpreted as accounting for the morphology by the overlapped dust-scattered halos. Zurita et al. (2002) attempted to model the diffuse H morphology seen in face-on galaxies assuming that the Lyc leakage from bright H II regions would be the predominant source of the diffuse H. They assumed that a constant fraction of the Lyc leaks from bright H II regions and transferred through the two dimensional ISM disk with no significant absorption, and claimed that the diffuse H surface brightness of NGC 157 can be reproduced reasonably well with this scenario. Seon (2009) extended the analysis to three dimensions assuming an exponential disk, and performed a similar analysis for a face-on galaxy, M 51. We then concluded that the effective hydrogen density required to explain the diffuse H emission with the “standard” scenario was too small ( of the generally known value) to be reconciled with the effective density inferred through the turbulence properties of ISM. In other words, unlikely extreme topology of the ISM is required to explain the diffuse H morphology by photoionization in a turbulent or clumpy medium.
These analyses, however, did not entail self-consistent photoionization modeling, as noted in Wood et al. (2010). The photoionization model should be iteratively performed until the ionization fraction and temperature at each points converge. Instead, the penetration of photons through ISM was characterized using an factor, after being diluted by a geometric factor , where is the effective optical depth, and the photons interacting at a point were assumed to be re-emitted isotropically. This radiative transfer process in fact describes a single dust-scattering with an arbitrary dust extinction cross-section and an isotropic scattering phase function (asymmetry phase factor ). In our simulations, it was found that the H luminosity from the diffuse region (DIG) is approximately half of the total H luminosity originating from H II regions. In the context of a single dust-scattering, this is equivalent to assuming the dust albedo of . From the analysis, it was also found that the effective cross-section per hydrogen nucleus is given by cm2 for a reasonable hydrogen density. Note that the obtained effective cross-section is a factor of smaller than the photoionization cross-section of Lyc, but accords well with the dust-extinction cross-section of H photons of cm2/H (Draine, 2003). The absorption coefficient obtained by Zurita et al. (2002) is also consistent with the value. Therefore, the results indicate that the diffuse H morphologies in the face-on galaxies accord well with the dust-scattered halos of H photons, contrary to the claim of Zurita et al. (2002) that the analysis supports the photoionization by Lyc leaked out of bright H II regions.
In Section 2, we found that the surface brightness of the individual dust-scattered halos can be approximated well by the formula , which is in fact the very expression used in Zurita et al. (2002) and Seon (2009). These results seem to strongly suggest the dust-scattering origin of the diffuse H emission in the face-on galaxies. Obviously, the radial profile is not consistent with those of the radiation-bounded H II regions. However, it is not clear at this stage whether or not the radial profile of the photoionized H emission line that is predicted from the density-bounded models accords with . We plan to examine the radial profiles of density-bounded H II regions in the future. We also need to develop more realistic models of the global H morphologies of face-on galaxies in the contexts of not only dust scattering, but also photoionization.
5.2. Optical Line Ratios
The [N II]/H and [S II]/H line ratios are observed to be higher in the diffuse H regions than in bright H II regions (Haffner et al., 2009). This was believed to be the strongest evidence against the dust-scattering origin of the diffuse H emission, because the dust scattering would keep the line ratios constant. The enhanced optical line ratios outside of H II regions have been generally explained by a dilute radiation field transferred from O stars within H II regions to the diffuse ISM (Mathis, 1986a; Sokolowski & Bland-Hawthorn, 1991; Domgörgen & Mathis, 1994).
However, we note that the argument to reject dust scattering has been based solely on comparisons with the line ratios from bright H II regions. If the line ratios from the ionized nebulae due to the late O- or early B-type stars are compared with the typical line ratios in the diffuse H regions, the present scenario seems to explain the higher line ratios than those in bright H II regions equally as well as the previous photoionization models do. It was also found that the [S II]/H ratios observed in H II regions around late-type stars tend to be higher than those found around early-type stars (Figure 3 of Reynolds, 1988). O’Dell et al. (2011) pointed out a striking similarity of the line ratios between Barnard’s Loop, the Orion–Eridanus Bubble, and the typical WIM samples, which can be explained by the photoionized nebulae due to stars with temperature of K corresponding to late O-types (see also, Seon et al. 2011b). This also supports the present conclusion.
Weak [O III] 5007/H and He I/H emission line ratios in the galactic disks also indicate that the spectrum of the diffuse interstellar radiation field is significantly softer than that from the average Galactic O star population (Reynolds & Tufte, 1995; Madsen et al., 2006). These line ratios provide the strongest constraint on the spectral type of the original ionizing source of the diffuse H and other optical emission lines. However, [O III] 5007/H or [O III] 5007/H in several halos of edge-on galaxies are found to increase with height above the galactic plane (Tüllmann & Dettmar, 2000; Miller & Veilleux, 2003). The rise may indicate that other mechanisms are needed.
Seon et al. (2011b) estimated how a large portion of the ionizing power required for the H background in our Galaxy can be provided by late OB stars, and concluded that O9 and later-type stars can account for at least one-half of the required recombination rate of s-1 cm-2. We note that the earliest stellar type consistent with the observed He I/H line ratio is O8 from our analyses, and the fraction of Lyc luminosities of O8 and O9 stars in the total Lyc luminosity due to O stars is % (Table 1 in Terzian, 1974). Including O8 stars, late OB stars can provide the recombination rate of s-1 cm-2. It is therefore clear that most of the required ionizing power in the Galaxy would be explained with late OB stars. In fact, there is a relative lack of early O stars in the solar neighborhood, as noted in Brandt & Draine (2012). Therefore, the diffuse optical emission lines in our Galaxy are consistent with those produced by late OB stars and their scattered light from the local ISM.
In our models using the MOCASSIN code, the typical values of the [N II]/H and [S II]/H ratios were well reproduced with most of the abundances except the ISM abundances. With the CLOUDY code, abundances close to those of WNM were required. Sembach et al. (2000) and Mathis (2000) also reproduced the observed line ratios assuming the WNM abundances. In our previous paper (Seon et al., 2011b), we mistakenly stated that the elemental abundances required to explain the line ratios in the WIM are close to the B star abundances both in Sembach et al. (2000) and in O’Dell et al. (2011). This should be read as the WNM abundances instead of the B star abundances.
The NLTE stellar models may produce significantly different amount of Lyc photons from the LTE models. Nevertheless, we obtained consistent results from two different model atmospheres (Kurucz or WMBASIC) in Section 3.2. Note that it is the combination of the line blanketing and spherical geometry, not exclusively the NTLE aspect, that is crucial in determining the spectral energy distribution (SED) and Lyc luminosity of stellar models (Aufdenberg et al., 1998). Aufdenberg et al. (1999) also found that a significant difference between the spherical and plane-parallel models is found only at surface gravities below , corresponding to giant stars. We also note that the calibration scale of stellar parameters (temperature and gravity) as a function of spectral type varies when different model atmosphere codes are used (Martins et al., 2005; Simón-Díaz & Stasińska, 2008). Simón-Díaz & Stasińska (2008) investigated the impact of the modern model atmospheres (including plane-parallel stellar models) of dwarf stars on H II regions. They concluded that the predicted SEDs in the energy range of eV, which are most important in producing H, [N II], [S II], and He I lines, are in good agreement between the codes when the models are compared using the calibration scales appropriate to each code. Therefore, our main results obtained by using dwarf stars are not sensitive to the adopted atmosphere models. Since the number of giant stars is relatively smaller than that of dwarfs, it is also unlikely that the main conclusions will be significantly altered, even when giants are taken into account. Fully three-dimensional simulations with a set of NLTE input spectra, including the effect of giant stars, may be needed for a more detailed study.
The results of Topasna (1999) are worth noting in attempting to understand the line ratios of the diffuse H regions. The [S II]/H ratio observed in the Rosette Nebula increased from to with radius out to the boundary of the H II region at , which was identified by polarization and 4850 MHz radio continuum emission. Beyond the H II region boundary () where dust scattering is dominant, there were no large variations in the ratio as a dust-scattered halo would preserve the line ratio at the H II region boundary (see Fig. 4.27 of Topasna, 1999). The Oph H II region also shows the same trend in the [N II]/H and [S II]/H ratios (Fig. 2 of Wood et al., 2005). This trend is exactly what is expected from the dust-scattered halo. However, farther out beyond these regions with constant ratios, the line ratios increased to higher values. These higher ratios may indicate the existence of other sources close to the nebulae to elevate the line ratios, as will be discussed in the following paragraph.
It is thought that the line ratios increase as the H intensity decreases. This trend does not appear to be consistent with the dust scattering scenario, because dust scattering should preserve the ratios. We therefore need to explain the trend in the context of the dust scattering scenario. Note that early O stars in association are more concentrated at the galactic plane. Near an early O star, the dust-scattered H halo would be dominated by the H II region due to the O star and the H intensity will be very high. The [N II]/H and [S II]/H ratios would be then relatively low in the region. At distances far from the O star, the H intensity will be dominated by the dust-scattered light originating from the H II regions surrounding late OB stars, which are more abundant than early O stars, and the line ratios will then be increased. As we demonstrated using the clumpy models, some part of the enhancement or fluctuation in the line ratios may be attributed to the variation of clumpiness from sightline to sightline. Note that the [S II]/H ratio of in the Oph H II region (Wood et al., 2005) is close the ratio expected from the C1 model, while the [S II]/H ratio of in the Rosette Nebula (Topasna, 1999) needs a clumpier model than the C2 case. In LDN 1780, the ratio of (Witt et al., 2010) is somewhere in the range between the U and C1 model. However, the highest line ratios may need other explanations. The highest line ratios can result from non-ionizing heating sources, as discussed in Seon et al. (2011b), and/or from the underlying Balmer absorption line in the stellar continuum of relatively late-type stars, as discussed in Section 4.
The heating sources to elevate the line ratios may include shocks, photoelectric heating, turbulent mixing layers, and/or galactic fountain gas Reynolds & Cox (1992); Slavin et al. (1993); Collins & Rand (2001); Raymond (1992); Shapiro & Benjamin (1993). Recently, Flores-Fajardo et al. (2011) proposed hot low-mass evolved stars (HOLMES), which may be plentiful in the thick disks and lower halos of galaxies, to explain the observed increase of [O III]/H, [O II]/H and [N II]/H with increasing distance to the galactic plane in an edge-on galaxy, NGC 891. We also note that the H II region associated with the B0.5+sdO binary Per is elevated in [S II]/H (Madsen et al., 2006). These stars produce a much harder radiation field than massive OB stars, and are therefore able to produce H II regions with high electron temperatures. It is possible that all these supplementary sources may play some roles in enhancing the line ratios and their contributions might significantly vary from sightline to sightline. The optical emission lines due to these sources providing the highest line ratios should also be scattered into more extended regions than those originally produced by the sources. It should be noted that the conventional photoionization models by O stars in the galactic plane also need these heating sources to explain the highest ratios (Reynolds et al., 1999). Therefore, the present dust scattering scenario can be an alternative explanation for the diffuse optical H emission that is equally as plausible as the in situ ionization scenario.
In Section 4, we argued that the [N II]/H line ratio (probably, [S II]/H as well) in the diffuse ISM regions seems to be consistent with that in bright H II regions, if the underlying Balmer absorption lines are taken into account. It was also demonstrated that the line ratios should indeed increase at the faint H regions outside bright H II regions, if the diffuse H emission is predominantly caused by dust scattering. We note that a similar argument to explain the anti-correlation of the line ratios with H intensity can be applied even to the in situ photoionization scenario. Then, the non-ionizing heating sources proposed to explain the highest line ratios may not be required anymore, regardless of what would be the main origin of the diffuse H emission, dust-scattered light or in-situ ionized gas. However, the dust scattering origin is more preferable if this is indeed the case.
6. Summary
We demonstrated that the basic morphological properties of the diffuse H emission can be well explained by the dust-scattered halo surrounding the H II nebula, as opposed to the previous belief that dust scattering does not accord with the H and R-band observations. We also found that the optical line ratios of He I/H, [N II]/H and [S II]/H observed in the diffuse ISM outside of bright H II regions can be well reproduced by the dust-scattered halo scenario, wherein the optical lines originate from H II regions ionized by late O- or early B-type stars in the media with abundances close to WNM and are scattered off by the interstellar dust. It was also shown that the predicted [N II]/H and [S II]/H line ratios increase with the clumpiness of ISM. We also showed that the Balmer absorption lines in the underlying stellar continuum seem to explain the rise of line ratios in the faint H regions. We therefore conclude that the dust-scattering origin of the diffuse optical emission lines cannot be ruled out. Instead, the dust scattering can explain the observed properties of the diffuse optical emission lines very well.
References
- Aufdenberg et al. (1999) Aufdenberg, J. P., Hauschildt, P. H., & Baron, E. 1999, MNRAS, 302, 599
- Aufdenberg et al. (1998) Aufdenberg, J. P., Hauschildt, P. H., Shore, S. N., & Baron, E. 1998, ApJ, 498, 837
- Baldwin et al. (1981) Baldwin, J. A., Phillips, M. M., & Terlevich, R. 1981, PASP, 93, 5
- Bica & Alloin (1986) Bica, E., & Alloin, D. 1986, A&A, 162, 21
- Brandt & Draine (2012) Brandt, T. D., & Draine, B. T. 2012, ApJ, 744, 129
- Bresolin & Kennicutt (1997) Bresolin, F., & Kennicutt, R. C., Jr. 1997, AJ, 113, 975
- Brinchmann et al. (2004) Brinchmann, J., Charlot, S., White, S. D. M., et al. 2004, MNRAS, 351, 1151
- Carignan (1985) Carignan, C. 1985, ApJS, 58, 107
- Cashwell & Everett (1959) Cashwell, E. D., & Everett, C. J. 1959, A Practical Manual on the Monte Carlo Method for Random Walk Problems (New York : Pergamon)
- Castelli & Kurucz (2003) Castelli, F., Kurucz, R. L. 2003, in IAU Symp. 210, Modelling of Stellar Atmospheres, ed. N. Piskunov, W. W. Weiss, & D. F. Gray (San Francisco, CA: ASP), poster A20 (arXiv:astro-ph/0405087)
- Collins & Rand (2001) Collins, J. A., & Rand, R. J. 2001, ApJ, 551, 57
- Dale et al. (2007) Dale, D. A., Gil de Paz, A., Gordon, K. D., et al. 2007, ApJ, 655, 863
- Davies et al. (2006) Davies, R. D., Dickinson, C., Banday, A. J., et al. 2006, MNRAS, 370, 1125
- Dettmar (2000) Dettmar, R.-J. 2000, in ASP Conf. Proc. 221, Stars, Gas and Dust in Galaxies: Exploring the Links, ed. D. Alloin, K. Olsen, & G. Galaz. (San Francisco, CA: ASP), 61
- Dickinson et al. (2009) Dickinson, C., Eriksen, H. K., Banday, A. J., et al. 2009, ApJ, 705, 1607
- Domgörgen & Mathis (1994) Domgörgen, H., & Mathis, J. S. 1994, ApJ, 428, 647
- Dobler et al. (2009) Dobler, G., Draine, B., & Finkbeiner, D. P. 2009, ApJ, 699, 1374
- Dobler & Finkbeiner (2008a) Dobler, G., & Finkbeiner, D. P. 2008a, ApJ, 680, 1222
- Dobler & Finkbeiner (2008b) Dobler, G., & Finkbeiner, D. P. 2008b, ApJ, 680, 1235
- Draine (2003) Draine, B. T. 2003, ApJ, 598, 1017
- Elwert & Dettmar (2005) Elwert, T., & Dettmar, R.-J. 2005, ApJ, 632, 277
- Ercolano et al. (2003) Ercolano, B., Barlow, M. J., Storey P. J., & Liu, X.-W. 2003, MNRAS, 340, 1136
- Ercolano et al. (2005) Ercolano, B., Barlow, M. J., & Storey P. J. 2005, MNRAS, 362, 1038
- Ercolano et al. (2008) Ercolano, B., Young, P. R., Drake, J. J., & Raymond, J. C. 2008, ApJS, 175, 534
- Evans & Dopita (1985) Evans, I. N., & Dopita, M. A. 1985, ApJS, 58, 125
- Ferguson et al. (1996a) Ferguson, A. M. N., Wyse, R. F. G., & Gallagher, J. S. 1996a, AJ, 112, 2567
- Ferguson et al. (1996b) Ferguson, A. M. N., Wyse, R. F. G., Gallagher, J. S. III, & Hunter, D. A. 1996b, AJ, 111, 2265
- Ferland et al. (1998) Ferland, G. J., Korista, K. T., Verner, D. A., et al. 1998, PASP, 110, 761
- Fich & Blitz (1984) Fich, M., & Blitz, L. 1984, ApJ, 279, 125
- Finkbeiner (2003) Finkbeiner, D. 2003, ApJS, 146, 407
- Flores-Fajardo et al. (2009) Flores-Fajardo, N., Morrisset, C., Binette, L. 2009, Rev. Mex. Astron. Astrofís, 45, 261
- Flores-Fajardo et al. (2011) Flores-Fajardo, N., Morisset, C., Stasińska, G., & Binette, L. 2011, MNRAS, 415, 2182
- Gold et al. (2011) Gold, B., Odegard, N., Weiland, J. L., et al. 2011, ApJS, 192, 15
- Gordon et al. (2001) Gordon, K. D., Misselt, K. A., Witt, A. N., & Clayton, G C. 2001, ApJ, 551, 269
- Greenawalt et al. (1998) Greenawalt, R., Walterbos, R. A. M., Thilker, D., & Hoopes, C. G. 1998, ApJ, 506, 135
- Haffner et al. (2009) Haffner, L. M., Dettmar, R.-J., Beckman, J. E., et al. 2009, Rev. of Mod. Phys., 81, 696
- Haffner et al. (2003) Haffner, L. M., Reynolds, R. J., Tufte, S. L. et al. 2003, ApJS, 149, 405
- Hidalgo-Gámez (2005) Hidalgo-Gámez, A. M. 2005, Revista Mexiana de Astronomía Astrofísica, 24, 288
- Hoopes et al. (1996) Hoopes, C. G., & Walterbos, R. A. M., & Greenwalt, B. E. 1996, AJ, 112, 1429
- Howk & Savage (2000) Howk, J. C. & Savage, B. D. 2000, AJ, 119, 644
- Hunter & Gallagher (1990) Hunter, D. A., & Gallagher, J. S. 1990, ApJ, 362, 480
- Kennicutt (1992a) Kennicutt, R. C. 1992a, ApJ, 388, 310
- Kennicutt (1992b) Kennicutt, R. C. 1992b, ApJS, 79, 255
- Kennicutt et al. (2003) Kennicutt, R. C., Armus, L., Bendo, G., et al. 2003, PASP, 115, 928
- Kennicutt et al. (1995) Kennicutt, R. C., Bresolin, F., Bomans, D. J., Bothun, G. D., & Thompson, I. B. 1995, ApJ, 109, 594
- Kutyrev et al. (2001) Kutyrev, A. S., Bennett, C. L., Moseley, S. H., Reynolds, R. J., & Roesler, F. 2001, in ASP Conf. Proc. 231, Tetons 4: Galactic Structure, Stars, & the Interstellar Medium, ed. C. E. Woodward, M. D. Bicay, & J. M. Shull (San Francisco, CA: ASP), 360
- Kutyrev et al. (2004) Kutyrev, A. S., Bennett, C. L., Moseley, S. H., Reynolds, R. J., & Roesler, F. 2004, in How Does the Galaxy Work? A Galactic Tertulia with Don Cox and Ron Reynolds, ed. E. J. Alfraro et al. (Astrophysics and Space Science Library, Vol. 315; Dordrecht: Kluwer), 79
- Landi et al. (2006) Landi, E., Del Zanna, G., Young, P. R., et al. 2006, ApJS, 162, 261
- Lee et al. (2008) Lee, D.-H., Seon, K.-I., Min, K. W., et al. 2008, ApJ, 686, 1155
- Lee et al. (2004) Lee, J. C., Salzer, J. J., & Melbourne, J. 2004, ApJ, 616, 752
- Lehnert & Heckman (1994) Lehnert, M. D., & Heckman, T. M. 1994, ApJ, 426, L27
- Lehtinen et al. (2010) Lehtinen, K., M. Juvela, M., & Mattila, K. 2010, A&A, 517, A79
- Leitherer et al. (2010) Leitherer, C., Otálvaro, P. A. O., Bresolin, F., et al. 2010, ApJS, 189, 309
- Leitherer et al. (1999) Leitherer, C., Schaerer, D., Goldader, J. D., et al. 1999, ApJS, 123, 3
- Madsen et al. (2006) Madsen, G. J., Reynolds, R. J., & Haffner, L. M. 2006, ApJ, 652, 401
- Mathis (1985) Mathis, J. S. 1985, ApJ, 291, 247
- Mathis (1986a) Mathis, J. S. 1986a, ApJ, 301, 423
- Mathis (1986b) Mathis, J. S. 1986b, PASP, 98, 995
- Mathis (2000) Mathis, J. S. 2000, ApJ, 544, 347
- Mathis et al. (1983) Mathis, J. S., Mezger, P. G., & Panagia, N. 1983, A&A, 128, 212
- Mathis & Wood (2005) Mathis, J. S., Wood, K. 2005, A&A, 360, 227
- Martins et al. (2005) Martins, F., Schaerer, D., & Hillier, D. J. 2005, A&A, 436, 1049
- Mattila et al. (2007) Mattila, K., Juvela, M., & Lehtinen, K. 2007, ApJ, 654, L131
- Mesa-Delgado et al. (2011) Mesa-Delgado, A., Núñez-Díaz, M., Esteban, C., et al. 2011, MNRAS, 417, 420
- Miller & Veilleux (2003) Miller, S. T., & Veilleux, S. 2003, ApJ, 592, 79
- Moustakas & Kennicutt (2006) Moustakas, J., & Kennicutt, R. C., Jr., 2006, ApJ, 651, 155
- Moustakas et al. (2006) Moustakas, J., Kennicutt, R. C., Jr., & Tremonti, C. A. 2006, ApJ, 642, 775
- Oey et al. (2007) Oey, M. S., Meurer, G. R., Yelda, S., et al. 2007, ApJ, 661, 801
- O’Dell & Goss (2009) O’Dell, C. R., & Goss, W. M. 2009, 138, 1235
- O’Dell et al. (2011) O’Dell, C. R., Ferland, G. J., Porter, R. L., & van Hoof, P. A. M. 2011, ApJ, 733, 9
- Pauldrach et al. (2001) Pauldrach, A. W. A., Hoffmann, T. L., & Lennon, M. 2001, A&A, 375, 161
- Petuchowski & Bennett (1995) Petuchowski, S. J., & Bennett, C. L. 1995, ApJ, 438, 735
- Pickles (1998) Pickles, A. J. 1998, PASP, 110, 863
- Pogge et al. (1992) Pogge, R. W., Owen, M., & Atwood, B. 1992, ApJ, 399, 147
- Rand (2000) Rand, R. J. 2000, ApJ, 537, L13
- Raymond (1992) Raymond, J. C. 1992, ApJ, 384, 502
- Relaño et al. (2010) Relaño, M., Monreal-Ibero, A., Vílchez, J. M., & Kennicutt, R. C. 2010, MNRAS, 402, 1635
- Reynolds (1985) Reynolds, R. J. 1985, ApJ, 294, 256
- Reynolds (1987) Reynolds, R. J. 1987, ApJ, 323, 118
- Reynolds (1988) Reynolds, R. J. 1988, ApJ, 333, 341
- Reynolds (1991) Reynolds, R. J. 1991, in IAU Symp. 144, The Interstellar Disk-Halo Connection in Galaxies, ed. H. Bloemen (Dordrecht: Kluwer), 67
- Reynolds & Cox (1992) Reynolds, R. J., & Cox, D. P. 1992, ApJ, 400, L33
- Reynolds et al. (1999) Reynolds, R. J., Haffner, L. M., & Tufte, S. L. 1999, ApJ, 525, L21
- Reynolds & Tufte (1995) Reynolds, R. J., Tufte, S. L. 1995, ApJ, 439, L17
- Rossa & Dettmar (2003) Rossa, J., & Dettmar, R.-J. 2003, A&A, 406, 505
- Sánchez et al. (2007) Sánchez, S. F., Cardiel, N., Verheijen, M. A. W., et al. 2007, A&A, 465, 207
- Sembach et al. (2000) Sembach, K. R., Howk, J. C., Ryans, R. S. I., & Keenan, F. P. 2000, ApJ, 528, 310
- Seon (2009) Seon, K.-I. 2009, ApJ, 703, 1159
- Seon et al. (2011a) Seon, K.-I., Edelstein, J., Korpela, E. J., et al. 2011a, ApJS, 196, 15
- Seon et al. (2011b) Seon, K.-I., Witt, A. N., Kim, I.-J., et al. 2011b, ApJ, 743, 188
- Shapiro & Benjamin (1993) Shapiro, P. R., & Benjamin, R. A. 1993, in Star Formation, Galaxies, and the Interstellar Medium, ed. J. Franco, F. Ferrini, & G. Tenorio-Tagle (Cambridge: Cambridge Univ. Press), 275
- Simón-Díaz & Stasińska (2008) Simón-Díaz, S., & Stasińska, G. 2008, MNRAS, 389, 1009
- Slavin et al. (1993) Slavin, J. D., Shull, J. M., & Begelman, M. C. 1993, ApJ, 407, 83
- Sodré & Stasińska (1999) Sodré, L., & Stasinńka, G. 1999, A&A, 345, 391
- Sokolowski & Bland-Hawthorn (1991) Sokolowski, J., & Bland-Hawthorn, J. 1991, PASP, 103, 911
- Sternberg et al. (2003) Sternberg, A., Hoffmann, T. L., & Pauldrach, A. W. A. 2003, ApJ, 599, 1333
- Störzer & Hollenbach (2000) Störzer, H., & Hollenbach, D. 2000, ApJ, 539, 751
- Straižys & Kuriliene (1981) Straižys, V., & Kuriliene, G. 1981, Ap&SS, 80, 353
- Subrahmanyan et al. (2001) Subrahmanyan, R., Goss, W. M., & Malin, D. F. 2001, ApJ, 121, 399
- Terzian (1974) Terzian, Y. 1974, ApJ, 193, 93
- Toller et al. (1987) Toller, G., H. Tanabe, H., & Weinberg, J. L. 1987, A&A, 188, 24
- Topasna (1999) Topasna, G. A. 1999, PhD thesis, Virginia Polytechnic Institute and State University
- Tüllmann & Dettmar (2000) Tüllmann, R., & Dettmar, R.-J. 2000, A&A, 362, 119
- Vielleux & Osterbrock (1987) Veilleux, S., & Osterbrock, D. E. 1987, ApJS, 63, 295
- Vidal et al. (2011) Vidal, M., Casassus, S., Dickinson, C., et al. 2011, MNRAS, 414, 2424
- Voges (2006) Voges, E. S., 2006, PhD thesis, New Mexico State University.
- Walterbos & Braun (1994) Walterbos, R. A. M., & Braun, R. 1994, ApJ, 431, 156
- Walterbos & Braun (1996) Walterbos, R. A. M., & Braun, R. 1996, in ASP Conf. Ser. 106, The Minnesota Lectures on Extragalactic Neutral Hydrogen, ed. E. D. Skillmand (San Francisco: ASP), 1
- Witt (1977) Witt, A. N., 1977, ApJS, 35, 1
- Witt et al. (1982) Witt, A. N., Walker, G. A. H., Bohlin, R. C., & Stecher, T. P., 1982, ApJ, 261, 492
- Witt et al. (2010) Witt, A. N., Gold, B., Barnes, F. S., III, et al. 2010, ApJ, 724, 1551
- Wood et al. (2005) Wood, K., Haffner, L. M., Reynolds, R. J., et al. 2005, ApJ, 633, 295
- Wood et al. (2010) Wood, K., Hill, A. S., Joung, M. R., et al. 2010, ApJ, 721, 1397
- Wood & Mathis (2004) Wood, K., & Mathis, J. S.. 2004, MNRAS, 353, 1126
- Wood & Reynold (1999) Wood, K., & Reynolds, R. J. 1999, ApJ, 525, 799
- Yusef-Zadeh et al. (1984) Yusef-Zadeh, F., Morris, M., & White, R. L. 1984, ApJ, 278, 186
- Zurita et al. (2000) Zurita, A., Rozas, M., & Beckman, J. E. 2000, A&A, 363, 9
- Zurita et al. (2002) Zurita, A., Beckman, J. E., Rozas, M., & Ryder, S. 2002, A&A, 386, 801
| scattered intensity / total intensity | scattered flux of halo | scattered flux over all regions | ||||||||||||
| model | at source center | / total flux over all regions | / total flux over all regions | |||||||||||
| 5 cm-3 | 10 cm-3 | 15 cm-3 | 20 cm-3 | 5 cm-3 | 10 cm-3 | 15 cm-3 | 20 cm-3 | 5 cm-3 | 10 cm-3 | 15 cm-3 | 20 cm-3 | |||
| sphere 10 pc | 6.93% | 12.5% | 18.4% | 24.1% | 41.2% | 56.9% | 65.5% | 71.2% | 45.5% | 63.0% | 72.7% | 79.0% | ||
| sphere 20 pc | 11.5% | 21.9% | 31.1% | 39.4% | 37.5% | 51.1% | 58.3% | 62.9% | 45.4% | 62.8% | 72.5% | 78.8% | ||
| sphere 40 pc | 18.9% | 33.9% | 45.4% | 54.5% | 31.4% | 41.5% | 45.8% | 48.0% | 45.1% | 62.2% | 71.7% | 77.7% | ||
| shell 10 pc | 9.10% | 17.5% | 25.2% | 32.2% | 41.3% | 56.9% | 65.6% | 71.3% | 45.5% | 63.0% | 72.7% | 79.0% | ||
| shell 20 pc | 18.1% | 32.4% | 43.7% | 52.7% | 37.8% | 51.6% | 58.9% | 63.5% | 45.4% | 62.8% | 72.4% | 78.7% | ||
| shell 40 pc | 28.2% | 45.8% | 57.0% | 64.7% | 32.5% | 43.0% | 47.5% | 49.7% | 44.9% | 61.9% | 71.2% | 77.1% | ||
| Element | WNM | WNM2 | ISM | Orion | Bstar | Solar |
|---|---|---|---|---|---|---|
| H | 12.00 | 12.00 | 12.00 | 12.00 | 12.00 | 12.00 |
| He | 11.00 | 11.00 | 11.00 | 11.00 | 11.00 | 11.00 |
| C | 8.15 | 8.15 | 8.40 | 8.48 | 8.27 | 8.39 |
| N | 7.88 | 7.88 | 7.90 | 7.85 | 7.80 | 7.93 |
| O | 8.50 | 8.50 | 8.50 | 8.60 | 8.56 | 8.69 |
| Ne | 8.07 | 8.07 | 8.09 | 7.78 | 8.20 | 8.00 |
| S | 7.07 | 7.27 | 7.51 | 7.00 | 6.97 | 7.27 |
| Sp. Type | (K) | (cm) | (H0) (s-1) | (He0) (s-1) | |
|---|---|---|---|---|---|
| O3V | 48,410 | 1.24 | 9.73 | 2.35 | 3.98 |
| O4V | 45,180 | 1.13 | 5.46 | 1.14 | 3.94 |
| O5V | 42,160 | 1.03 | 2.93 | 4.95 | 3.90 |
| O6V | 39,350 | 9.39 | 1.62 | 2.04 | 3.86 |
| O7V | 37,150 | 8.37 | 8.63 | 7.32 | 3.85 |
| O8V | 35,480 | 7.29 | 4.30 | 1.92 | 3.87 |
| O9V | 33,490 | 5.92 | 1.48 | 2.16 | 3.95 |
| B0V | 31,620 | 5.04 | 4.69 | 2.52 | 4.00 |
| B1V | 26,600 | 4.10 | 1.77 | 6.70 | 4.00 |