Department of Physics “E. Amaldi,” University of Roma Tre - CNISM - I - 00146 Roma, Italy
Laboratoire National des Champs Magnétiques Intenses, LNCMI-CNRS (UPR3228), UJF, UPS and INSA, BP 166, 38042 Grenoble Cedex 9, France
Ames Laboratory USDOE and Department of Physics and Astronomy, Iowa State University - Ames, IA 50011, USA
Nuclear magnetic resonance (NMR) - in superconductors Properties of vortex phases Vortex pinning (superconductivity)
Glassy Transition in the Vortex Lattice of Ba(Fe0.93Rh0.07)2As2
superconductor probed by NMR and ac-susceptibility
Abstract
By using Nuclear Magnetic Resonance and ac-susceptibility, the characteristic correlation times for the vortex dynamics, in an iron-based superconductor, have been derived. Upon cooling, the vortex dynamics displays a crossover consistent with a vortex glass transition. The correlation times, in the fast motions regime, merge onto a universal curve which is fit by the Vogel-Fulcher law, rather than by an Arrhenius law. Moreover, the pinning barrier shows a weak dependence on the magnetic field which can be heuristically justified within a fragile glass scenario. In addition, the glass freezing temperatures obtained by the two techniques merge onto the de Almeida-Thouless line. Finally the phase diagram for the mixed phase has been derived.
pacs:
74.25.njpacs:
74.25.Uvpacs:
74.25.Wx1 Introduction
The discovery of iron-based superconductors has brought to a renewed interest in the study of the mixed phase of type-II superconductors and of the nature of the frozen vortex state. In this regard, the effect of quenched disorder on the flux lines lattice (FLL) properties has to be considered, together with the onset of a vortex glassy state[1, 2, 3, 4]. In the case of weakly anisotropic superconductors, such as the 122 family of iron-pnictides, the high temperature () region of the phase diagram is dominated, just below the transition temperature , by a high mobility state of vortex lines[5]. On the other hand, the nature of the low temperature vortex lattice (VL) dynamics is still debated, since it involves the complex interplay among the pinning forces, the intervortex repulsion/attraction [6] and the thermal excitations. In a recent theoretical work[7] the free energy of the vortex matter was explicitly calculated for a three dimensional (3D) superconductor, in presence of quenched disorder. Two transitions were found: a first-order melting, at which the quasi-long-range order is destroyed, and a second-order glassy transition. Such double transition has been recently experimentally observed in cuprates[8]. By taking advantage of the work carried out in cuprates, it is worth extending the investigation of the VL to the iron-based superconductors, keeping in mind the different structural and physical properties.
ac-susceptibility and Nuclear Magnetic Resonance (NMR) spin-lattice relaxation, are excellent probes to investigate the frequency () and magnetic field () dependence of the correlation times () of vortex motions, and their joint employ is particularly effective. In both cases the VL excitations are probed in the radio-frequency range but, while the former technique is sensitive to dissipative/dispersive mechanisms taking place at wave-vector , the latter is sensitive to the -integrated dynamics.
In this paper, measurements of the real and imaginary part of the ac-susceptibility are presented and discussed, together with 75As NMR spin-lattice relaxation rate , in a single crystal of Ba(Fe0.93Rh0.07)2As2 superconductor. The temperature dependence of the vortex correlation times, extracted both from the peaks in and , lead to an interpretation of the motion, characteristic of a liquid-glassy phase transition. It is noticed that the peaks in associated with the VL motions have been found only in a few iron-pnictides.[9, 10, 11] This effect cannot be ascribed to a coherence peak. In fact it has been theoretically predicted [12] that for an s wave superconductor, which is the most likely scenario in these compounds, no divergence in the density of states (DOS) is expected. Moreover, as shown in [10], even in the case of s-wave pairing the exponential dependence of the spin-lattice relaxation rate, at low temperature, is not consistent with a superconducting gap of the order of meV. [13]
2 Experimental details
The ac-susceptibility measurements were carried out by means of a Quantum Design MPMS-XL5 Squid ac-susceptometer. The sample was mounted on the experimental setup, with both the static and the oscillating fields laying in the crystallographic plane. The sample dimensions, compared to the ones of the experimental setup, allowed to measure the spin susceptibility for the geometry only. The ac-susceptibility measures the energy dissipation due to vortex dynamics at wavevector and is complementary to NMR which, using local probes, measures the -integrated dynamics.
A magnetic characterization of the sample was previously carried out, to extract both K and the irreversibility curve . All the measurements were performed in Field Cooled (FC) conditions, on a flat 0.8 x 5 x 7 mm3 single crystal of Ba(Fe0.93Rh0.07)2As2. The details regarding the sample growth can be found in Ref. [10]. During the experiment the intensity of the oscillating magnetic field was kept constant at = 1.5 Oe, while the field intensity ranged from = 500 Oe to 4.8 T, so that the mixed phase regime could be explored. The ac field frequency range was = 37.5-1488 Hz.
Fig. 1 shows the real and imaginary part of the spin susceptibility. From the real part the transition temperature can be evaluated, whereas the peak in provide information about the dissipative mechanisms occurring in the mixed phase. Fig. 2 shows a peak in the imaginary part of the ac-susceptibility and its evolution with the ac-frequency: the reader can observe that the peak moves to higher temperature when increasing the frequency. Fig. 3 displays the imaginary part of the spin susceptibility as a function of the real part of the spin susceptibility, with the temperature as implicit parameter. This curve is usually known as ColeCole plot. The inset of the figure shows that the ColeCole plot lays on a circle, whose center has a negative ordinate, pointing out that there is a likely distribution of correlation times .[14]
[width=8.5cm]chi.eps
[width=8.5cm]raw_chi.eps
[height=6cm]ccp.eps
The 75As () NMR measurements were performed on the same single crystal, by using standard radio-frequency pulse sequences, on irradiating and detecting only the central line. The spin-lattice relaxation time was measured by means of a saturation recovery pulse sequence and the recovery of nuclear magnetization was fit by the law:
| (1) |
with , as expected for the central transition of a nuclear spin . Fig. 4 shows the raw saturation recovery data with the fitting function, at 8.5 T, in the mixed phase.
[width=8.5cm, keepaspectratio]recovery.eps
Earlier experiments, performed in the mixed phase of the same compound, evidenced a peak in the spin-lattice relaxation rate, whose position and amplitude depend on intensity [10]. As shown in Ref. [10], and reported in Fig. 5 for clarity, the peaks are visible solely in geometry, as expected for a layered superconductor, where the nuclear relaxation is driven by the vortex dynamics.
[width=8.5cm, keepaspectratio]T1_7T.eps
The contribution of the vortex dynamics to the spin-lattice relaxation rate , for is found by subtracting from the raw data the electronic contribution, estimated by extrapolating the data out of the peak region. This procedure is in practice equivalent to subtracting the data taken for , properly rescaled by the hyperfine factors[10], since for that orientation the nuclear spin-lattice relaxation is only given by the electronic spin fluctuations (Fig. 5). Namely, one has
| (2) |
where the first term is the vortex-lattice contribution, whilst the latter is due to electronic spin fluctuations.
Fig. 6 shows the relaxation rate versus temperature, at all the applied fields. By increasing the field intensity, the peak in shifts towards lower temperatures and it is rapidly reduced above 7 T, so that only a small kink remains at 11 T and 15 T. The results of Fig. 6 show remarkable similarities with earlier studies on oriented powders of the cuprate YBa2Cu4O8 (YBCO124)[15, 16].
Before concluding this section it is worth noting that, below the temperature of the peak in , a marked growth in the acoustic ringing was observed at all field values, mostly for . In analogy with an ultra-sound experiment[17], this effect can be qualitatively understood if one assumes that a magneto-acoustic coupling between the VL and the crystal lattice is affecting the magnetic susceptibility of the sample inside the NMR resonating coil. If a liquid-glassy phase transition occurred in the the vortex matter, the thermal excitation would not allow the vortices to overcome the pinning barrier in the glassy state, so they would transfer their elastic energy to the lattice, causing the latter to vibrate.
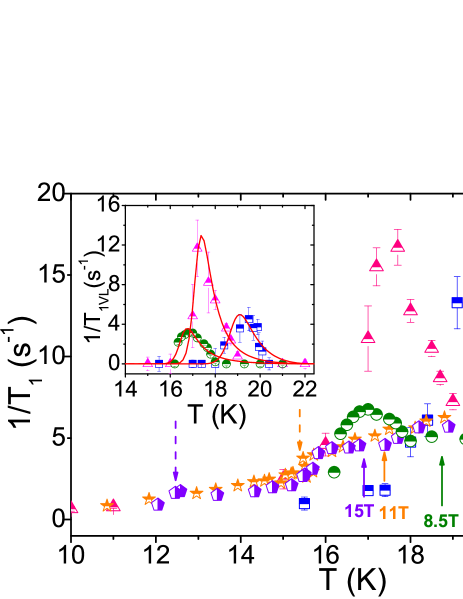
. The inset shows the peak due to the VL dynamics, namely after the subtraction of the electronic contribution. The solid lines are guides to-the-eye.
3 Discussion
To gain insights into the VL dynamics, the maximum in has to be carefully analyzed. Just below the onset of superconductivity, evidenced in the curve, a sharp peak in the appears (Fig. 1). The peak shifts towards higher temperature, when increasing the frequency, thus excluding the occurrence of the Bean critical state[18]. The peak in the imaginary part of the susceptibility could be interpreted as the result of magnetic flux reaching the center of the specimen and giving a resultant magnetization . This effect would be strongly dependent on the sample geometry and on the intensity of the applied field. In such a case, the peak temperature would not depend on the ac-frequency, at variance with the experimental findings. However, to definitely rule out the occurrence of Bean critical state, a further analysis should be carried out, by varying the intensity of the ac-field.
Another interpretation relies on the following consideration. The peak in is dominated by the onset of irreversible behavior of the magnetization, occurring when the vortex lines are thermally excited across the pinning barriers.[19] This leads to a resonant absorption of energy for . The absolute value of the imaginary part of the susceptibility tends to increase, while increasing the frequency . The peak height of the ColeCole plot grows when increasing the ac-frequency, and so does the peak in the imaginary part of the spin susceptibility . These findings are in agreement with the numerical simulations of Adesso et al. as well as with their experimental results on YBCO [20] and LaFeAsO0.9F0.08[21]. As a further proof we point out that the same behavior has been recently observed in the Cobalt optimally doped Ba122 [22].
To give quantitative information about the vortex dynamics, the correlation time dependence on the field H and the temperature T, is extracted through the Debye relation
| (3) |
Given the sharpness of the peaks in , and the previous consideration on the Cole-Cole plot, a small distribution of correlation times may be assumed. Accordingly, the value of shall be considered as an average value.
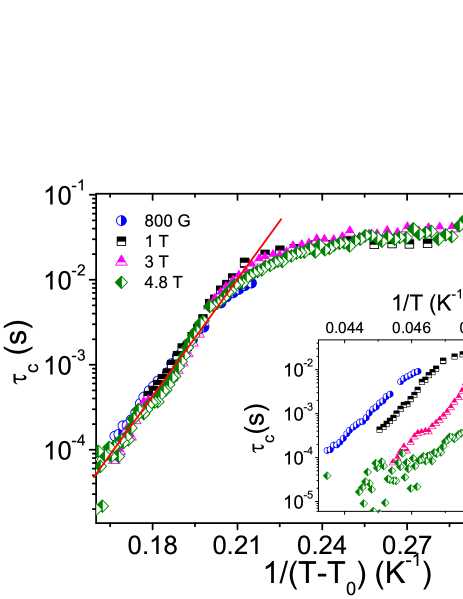
Fig. 7 shows a crossover occurring in , during the slowing-down of the FLL motion, upon cooling. Hence the Arrhenius law, typically employed in cuprates[23] and in the SmFeAsO0.8F0.2[24], fails in this system. One can further realize that the Arrhenius law has to be abandoned, by plotting versus the temperature of the peak, as recently done in the optimally doped Ba(Fe1-xCox)2As2 [22]. Furthermore, the inset of Fig. 7 shows that the curves have the same slope. Then, if the data are properly shifted by a temperature , they merge onto a universal curve that can be fit by the Vogel-Fulcher (VF) law [25]:
| (4) |
The data can be fit by a nearly field-independent activation barrier ( K), in contrast with certain families of superconductors, where the barrier decreases as [23] (see next paragraph).
While the ac-susceptibility is sensitive to excitations, the nuclear spin-lattice relaxation is driven by the -integrated dynamics of the thermally excited vortices. As shown in Ref. [10], a correspondence between and the -integrated correlation time can be found. However here, instead of fitting the peaks, as already carried out on the same compound and on YBCO[15], the following equation is numerically solved, in order to extract the T-dependence of the correlation time :
| (5) |
where is the 75As gyromagnetic ratio, the root mean-squared amplitude of the local field fluctuations [26], is the inter-vortex spacing, is the nuclear Larmor frequency, is the inter-planar spacing[27], is the London penetration depth when the magnetic field is oriented along the c axis, the coherence length and the magnetic flux quantum. This procedure is more reliable, because no multiple fitting parameters are involved, and the crossover between two dynamical regimes can be better evidenced.
One may wonder if the approach of Ref. [10] is the best one to describe in this weakly anisotropic system, since it starts from the assumption that the 3D vortex lines can be represented as stacks of 2D pancake vortices oscillating around their equilibrium positions. To check whether the dimensionality of the vortex is playing a role in the description of the dynamics, a further analysis was done, by employing a relation where the correlation time has a 3D isotropic character[28]. No significant difference in the qualitative behavior of was observed. Notice that the different absolute values of and display a dispersive behavior in the VL excitations.
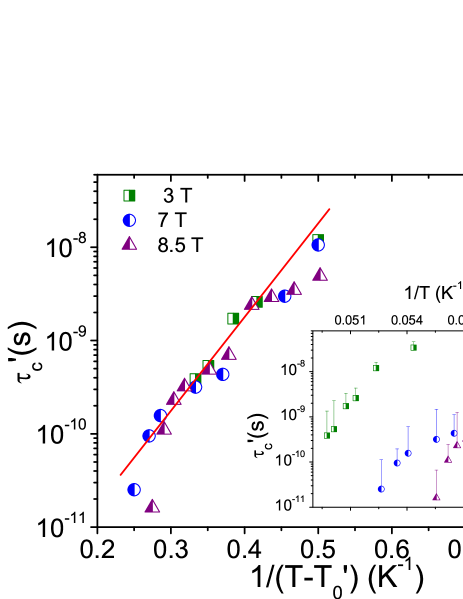
As it was observed for , also the data merge onto a universal trend, after being properly rescaled by (Fig. 8). The VF fit value of the pinning barrier is K, not far from the ac-susceptibility value. It is noticed that the energy barriers are field independent both for NMR and ac-susceptibility. This result, together with the VF-like behavior, suggests the occurrence of a glass state that, by resorting to the ”glass terminology”[29], can be named fragile glass. The field independence of can be justified by the following qualitative consideration: in case of weak pinning and high magnetic fields, namely in case of a high vortex density, the pinning energy distribution can be characterized by close meta-stable minima, in the bottom of spatially extended and deeper energy minima, as in the fragile glass scenario[30, 31]. Hence, upon varying the magnetic field strength, the VL can be rearranged within those meta-stable minima without having to overcome the high energy barrier. Accordingly, the barrier will correspond to an average energy distribution , determined solely by the quenched disorder, and not by the magnetic field.
When reporting and in the phase diagram, one finds a surprising result (see Fig. 9): the temperatures estimated by the two techniques merge onto the de Almeida-Thouless line[32]
The exponent is in agreement with spin and superconductive glasses[33].
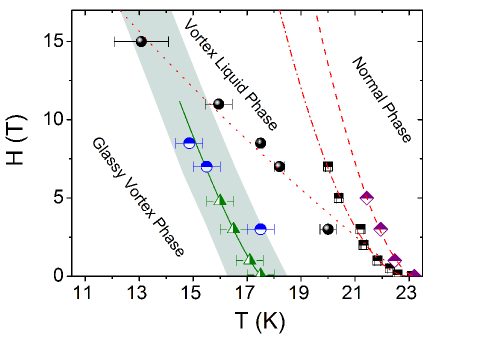
Before closing this section it is worth noting that both and lines intersect the axes at a temperature that is close to the zero field limit for the thermal ”disruption” of a vortex line. By assuming that a vortex line is made by piling up many pancakes across the Fe-As planes, Clem predicted that the thermal disruption of a vortex line would occur at the Kosterlitz-Thouless transition temperature:[34]
| (6) |
where is the Fe-As layer thickness. The calculated value of for this compound is 18.5 K.[35] This observation agrees with the picture of vortices passing from a glass/solid phase to a liquid phase, namely a regime of poorly correlated vortices.
4 Conclusions
NMR and ac-susceptibility are complementary techniques that allow to shed light into the mixed phase of Ba122 superconductors. From both the techniques the correlation times of the vortex dynamics were derived and it was shown that they obey the VF law, in the fast motion regime. The behavior of and with the field, and the analysis of , unambiguously show that a vortex glass phase is present in the low-T regime of the phase diagram of the 122 family of iron-pnictides. and have been found to merge onto the de Almeida Thouless line. To gain further insights into the behavior of with the field, and on the predicted Kosterlitz-Thouless transition, resistivity measurements will be performed.
Acknowledgements.
We are indebted to A. Rigamonti and G. Jug for fruitful discussions. We gratefully acknowledge C. Pernechele, M. Mazzani, and R. DeRenzi for the support during the ac-susceptibility measurements. We also acknowledge H. Mayaffre and M.-H. Julien of LNCMI-Grenoble. This work was supported by Fondazione Cariplo (research grant n.2011-0266) and by the European Commission through the EuroMagNET II network (Contract No. 228043). Work done in Ames Lab (PCC and AT) was supported by the U.S. Department of Energy, Office of Basic Energy Science, Division of Materials Sciences and Engineering. The research was performed at the Ames Laboratory. Ames Laboratory is operated for the U.S. Department of Energy by Iowa State University under Contract No. DE-AC02-07CH11358.References
- [1] \NameD. A. Huse, M. P. A. Fisher D. S. Fisher \REVIEWNature3585531992.
- [2] \NameG. Blatter, V. Geshkenbein, A. Larkin H. Nordborg \REVIEWPhys. Rev. B54721996.
- [3] \NameM. C. Marchetti D. R. Nelson \REVIEWPhys. Rev. B59136421999.
- [4] \NameM. P. A. Fisher \REVIEWPhys. Rev. Lett.6214151989.
- [5] \NameE. Zeldov \Book100 Years of Superconductivity \EditorH. Rogalla P. H. Kes \PublCRC Press, Boca Raton, FL \Year2012 \Page228.
- [6] \NameG Blatter, M. Y. Feigel’man, Y. B. Geshkenbein, A. I. Larkin, V. M. Vinokur \REVIEWRev. Mod. Phys.6611251994.
- [7] \NameD. Li B. Rosenstein \REVIEWPhys. Rev. Lett.901670042003.
- [8] \NameH. Beidenkopf, N. Avraham, Y. Myasoedov, H. Shtrikman, E. Zeldov, B. Rosenstein, E. H. Brandt T. Tamegai \REVIEWPhys. Rev. Lett.952570042005.
- [9] \NameY. Laplace J. Bobroff, F. Rullier-Albenque, D. Colson, A. Forget \REVIEW Phys. Rev. B80140501(R)2009.
- [10] \NameL. Bossoni, P. Carretta, A. Thaler P. C. Canfield \REVIEW Phys. Rev. B 851045252012.
- [11] \NameS.-H. Baek, H. Lee, S. E. Brown, N. J. Curro, E. D. Bauer, F. Ronning, T. Park, and J. D. Thompson \REVIEW Phys. Rev. Lett. 1022276012009.
- [12] \NameD. Parker, O. V. Dolgov, M. M. Korshunov, A. A. Golubov, and I. I. Mazin \REVIEWPhys. Rev. B.781345242008.
- [13] \NameC. Lester, Jiun-Haw Chu, J. G. Analytis, T. G. Perring, I. R. Fisher, and S. M. Hayden \REVIEWPhys. Rev. B.810645052010.
- [14] \NameE. R. Mosgnaschi and A. Rigamonti \REVIEWPhys. Rev. B1420051976.
- [15] \NameM. Corti, J. Suh, F. Tabak, A. Rigamonti, F. Borsa, M. Xu B. Dabrowski \REVIEWPhys. Rev. B5494691996.
- [16] \NameA. Rigamonti, F. Borsa P.Carretta \REVIEWRep. Prog. Phys.6113671998.
- [17] \NameJ. Pankert, G. Marbach, A. Comberg, P. Lemmens, P. Fröning S. Ewert \REVIEWPhys. Rev. Lett.6530521990.
- [18] \NameC. P. Bean \REVIEWPhys. Rev. Lett.82501962.
- [19] \NameA. P. Malozemoff, T. K. Worthingtin, Y. Yeshurun, F. Holtzberg P- H. Kes \REVIEWPhys. Rev. B(R)3872031988.
- [20] \NameM. G. Adesso, M. Polichetti S. Pace \REVIEWPhysica C4011962004.
- [21] \NameM. Polichetti, M. G. Adesso, D. Zola, J. Luo, G. F. Chen, Z. Li, N. L. Wang, C. Noce S. Pace \REVIEWPhys. Rev. B782245232008.
- [22] \NameG. Prando, M. Abdel-Hafiez, S. Aswartham, A.U.B. Wolter, S. Wurmehl B. Buchner \REVIEWarXiv:1207.2457v12012unpublished. \NameG. Prando, P. Carretta, R. De Renzi, S. Sanna, H.-J. Grafe, S. Wurmehl, B. Büchner \REVIEWPhys. Rev. B 85 144522 2012.
- [23] \NameT. M. Palstra, B. Batlogg, R. B. van Dover, L. F. Schneemeyer J. V. Waszczak \REVIEWPhys. Rev. B4166211990.
- [24] \NameG. Prando, P. Carretta, R. De Renzi, S. Sanna, A. Palenzona, M. Putti M. Tropeano \REVIEWPhys. Rev. B831745142011.
- [25] \NameF. Rao, A. Cristanti F. Rotort \REVIEWEurophys. Lett.628692003.
- [26] \NameL. I. Glazman A. E. Koshelev \REVIEWPhys. Rev. B4328351991.
- [27] The used value for the inter-planar spacing is Å.
- [28] \NameL. C. Hebel C. P. Slichter \REVIEWPhys. Rev.11315041959.
- [29] \NameF. Varnik K. Binder \REVIEWJourn. of Chem. Physics11763362002.
- [30] \NameP. G. Debenedetti F. H. Stillinger \REVIEWNature4102592001.
- [31] \NameC. A. Angell \BookInsulating and semiconducting glasses, Series on Directions in Condensed Matter Physics \EditorP. Boolchand \Vol17 \PublWorld Scientific Publishing, Singapore \Year2000 \Page18.
- [32] \NameJ. R. L. de Almeida D. J. Thouless \REVIEWJ. Phys. A119831978.
- [33] \NameK. A. Müller, M. Takashige J. G. Bednorz \REVIEWPhys. Rev. Lett.5811431987.
- [34] \NameJ. R. Clem \REVIEWPhys. Rev. B4378371991.
- [35] For the estimate of , the used numerical values are the plane thickness Å, and the bulk penetration depth nm. Notice that takes into account the T-dependence of , according to the two-fluid model.