Asymmetric light transmission through a photonic crystal with relaxing Kerr nonlinearity
Abstract
The idea of asymmetric light transmission through a photonic crystal with relaxing Kerr nonlinearity is presented. This idea is based on the symmetry breaking due to the self-trapping of intensive pump pulse inside the structure. As a result, the asymmetric transmission of the secondary (probe) pulses through the perturbed photonic crystal can be observed. The cases of short and long (quasi-continuous) probe pulses are considered.
pacs:
42.70.Qs, 42.65.Re, 42.65.JxI Introduction
The problem of asymmetric light propagation attracts much attention in modern scientific literature. The essence of this phenomenon is the situation when light transmission through the optical system in two opposite directions give different radiation characteristics. In the limiting case, one can observe the so-called optical diode action when light is transmitted or entirely blocked depending on the propagation direction. The importance of such effects is connected with the perspectives of integrated optics and all-optical logics and can lead to construction of all-optical diodes, isolators and other devices. To achieve asymmetric or unidirectional transmission, a number of optical structures were recently proposed on the basis of different operation principles. A number of suggestions is connected with the use of multilayer systems (or one-dimensional photonic crystals), for example, the passive optical diode based on nonlinear effects near the band edge Scalora ; Tocci , the hybrid Fabry-Perot-resonator photonic-crystal structure with strongly asymmetric resonant modes Zhukovsky , photonic crystal heterostructure with broken spatial inversion symmetry Cuicui , metal-dielectric multilayer diode due to a light-tunneling mechanism Chunhua , asymmetric multilayer with left-handed materials Feise and so on. A class of systems utilizes the effects of photonic crystal defects to achieve unidirectionality, such as coupling of nonlinear defects Cai or microcavities with the modes of opposite parity Grigoriev , asymmetrically placed nonlinear defect in the structure with chiral Tuz1 or magnetic layers Tuz2 , photonic crystal waveguide with uncoupled microcavities which is subject to a Fano-like mechanism and asymmetric light localization Ding . In ref. Feng two-dimensional photonic crystal heterostructure was used to obtain diode action due to a self-collimation behavior. Another type of structures considered in literature uses the so-called metamaterials, for example, planar split-ring resonators with chiral symmetry breaking Plum , bilayered chiral metamaterial with polarization-dependent asymmetry Huang , artificial structure with polarization selectivity due to magnetoelectric coupling and light tunneling Mutlu . Asymmetry in transmission was recorded in the nonlinear waveguide with a localized phase discontinuity Gallo , nonlinear directional couplers with longitudinally varying coupling coefficient Tran , etc. A similar effect of asymmetric reflection suppression (known as unidirectional invisibility) was found in parity-time symmetric periodic structures Lin ; Ge . Finally, it is worth to mention the possibility of asymmetric transmission of ultrashort pulses through a resonantly absorbing two-level medium discussed in ref. Novit12 .
In this paper we theoretically search for evidence of asymmetric transmission of ultrashort light pulses interacting with a one-dimensional photonic crystal (multilayer structure) made from materials possessing relaxing cubic (Kerr) nonlinearity. The need to take noninstantaneousness of nonlinearity into account was realized soon after appearance of nonlinear optics as a separate discipline. To name a few examples, one can mention studies of relaxation effects on laser beam self-focusing Fleck or parametric amplification Trillo . The effects of finite relaxation time become apparent when this time is comparable with pulse duration. This situation seems to be very actual nowadays as the methods of production of ultrashort (femtosecond) pulses are established. In the context of photonic crystals, the concept of relaxing Kerr nonlinearity was applied to the phenomena such as pulse compression Vlasov and optical switching Meng . The latter work also suggests that the polymeric materials are perspective media for applications due to both high nonlinearity coefficient and fast relaxation.
The main feature of the nonlinear photonic structure important for our study is the self-trapping effect analyzed in our previous works Novit ; Novit1 ; Novit2 . This effect occurs when both periodic modulation of linear refractive index and relaxation of nonlinearity are present. In this letter we suggest that self-trapping can be used to break the symmetry of the photonic crystal: the powerful pump pulse trapped inside the system changes the distribution of the refractive index which, in turn, influences the interaction of the secondary (probe) pulse with the structure. Such a variant of pump-probe technique is possible due to the relaxation of nonlinearity and allows to use pump and probe one after another. Simultaneously, this solves the common problem of separation between pump and probe signals. The paper includes the formulation of our theoretical model, the description of the main features of self-trapping effect, the results on asymmetric transmission in the cases of short-pulse and quasi-continuous regimes. Finally, we discuss the importance of probe intensity to obtain the asymmetric transmission.
II The description of the model
In this letter we consider an ultrashort (femtosecond) pulse interaction with nonlinear photonic crystal taking into account the relaxation process. Light propagation in this system is governed by the Maxwell wave equation,
| (1) |
where is the electric field strength, is the light speed, is the nonlinear refractive index. The relaxation of nonlinearity is described by the Debye model,
| (2) |
where is the nonlinear part of refractive index, is the Kerr nonlinear coefficient, is the light intensity. The full refractive index is
| (3) |
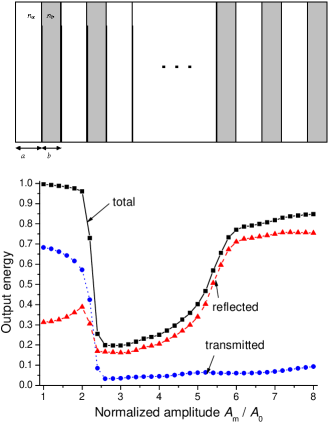
where is the linear part of the refractive index varying periodically along the axis and defining the structure of the photonic crystal. To simulate pulse propagation in this system, we solve self-consistently together with the eqs. (2) and (3) using the finite-difference time-domain method described in ref. Novit . In our calculations we assume the light pulses to have the Gaussian shape with the amplitude , the duration fs, and the central wavelength of the initial pulse spectrum m. As regards the photonic crystal (see the upper panel of fig. 1), the linear parts of refractive indices of the alternating layers are and , respectively; their thicknesses and m; the number of layers . The nonlinear coefficient of the materials is defined through the nonlinear term of the refractive index, so that ; this means that the pulse amplitude is normalized by the value . The relaxation time of the nonlinearity of all layers is fs (fast electronic Kerr nonlinearity). Note that we adopt equal nonlinearity parameters for both types of the layers that do not limit generality as was shown in the study of the different variants of the structure including the half-linear one Novit2 . The changes in light spectra in such situation were studied in ref. Novit1 , so that we do not consider the spectral effects in this paper.
III Self-trapping effect and trap position
The essence of self-trapping inside the photonic crystal is the localization of light pulse due to formation of a nonlinear ”cavity” (or trap) which dynamically adjusts its properties to light intensity and which is stabilized by nonlinearity relaxation. This trap has a form of bell-shaped distribution of intensity and refractive index variation. This variation preserves its form for a relatively long time (more than transmission times in the linear case) Novit . Thus, there are three temporal parameters of the system: pulse duration , nonlinearity relaxation time , and pulse propagation time . Obviously, the effects of relaxation become important when and are comparable; must be not too short for relaxation processes to have enough time to show themselves. In other words, the structure must be long enough for a pulse to be trapped inside it. For our photonic crystal described above, which is a large enough value.
The effect of self-trapping can be indicated by the value of light energy leaving the photonic crystal as a result of reflection and transmission. This value is calculated by the integration of radiation intensity over the certain time interval. If this output energy normalized by the energy of the initial pulse and integrated over a large enough time is much less than the unity, one can claim that the pulse is trapped inside the structure. The results of calculation of the output energy as a function of the incident pulse amplitude for the above stated parameters are shown in fig. 1. This value is integrated over the time which is about times larger than the propagation time of the pulse through the photonic crystal in linear regime. It is seen that for the amplitudes larger than the critical one (about ), the output energy abruptly drops which is the evidence of the pulse self-trapping. There is the region of optimal light-matter coupling. However, as the amplitude increases, the output energy goes up due to reflection. This is explained by the trapping of the pulse near the very entrance of the structure Novit .
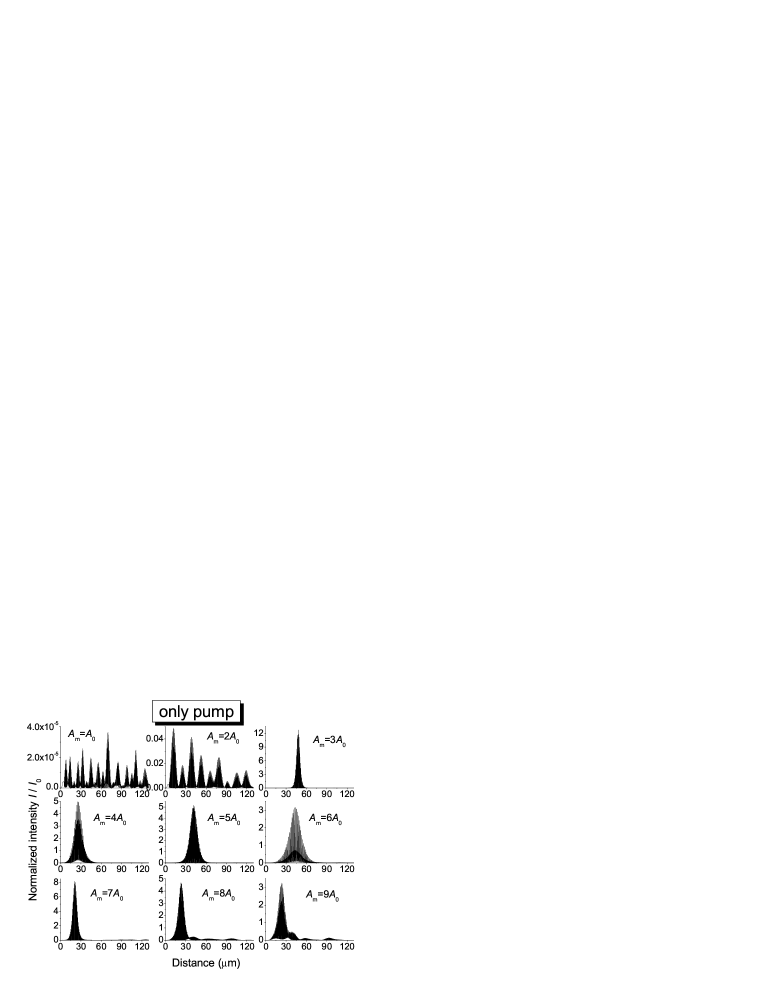
As it was mentioned above, the result of the pulse self-trapping is the formation of the quasi-stationary trap confining most part of the pulse energy. This trap can be viewed as a characteristic distribution of light intensity inside the system (its total length is m). In fig. 2 we plot such distributions at the instant after the pulse incidence and at different values of the pulse amplitude. It is seen that at low amplitudes ( and ), the intensity of radiation in the photonic crystal is very low and its distribution looks disordered and is extended over the whole structure. Above the critical amplitude ( and so on), the distribution takes a bell-shaped form (due to the similar shape of the pulse) which is formed closer to the entrance of the system for stronger pulse amplitudes. This change of position is connected with the increase of reflection with the amplitude noted in fig. 1. Simultaneously, the peak value of intensity inside this trap tends to decrease (the trap gets wider) though its absolute value can sometimes become larger due to a larger absolute value of the pulse amplitude.
The most important feature of the distributions considered is their position inside the photonic crystal. The initial pulse propagates from left to right, so that the position of the trap is closer or farther from the left side of the structure depending on the pulse amplitude. Obviously, the photonic crystal which was initially perfectly symmetric obtains some attribute of asymmetry when the trap is located inside it. Let us calculate how this asymmetry shows itself in the secondary (probe) pulse propagation in two variants: from left to right (LR) and vice versa (RL). The initial pulse forming the trap is further called the pump pulse and is launched at the instant (the time of maximum incidence at the input).
IV Short probe pulse transmission
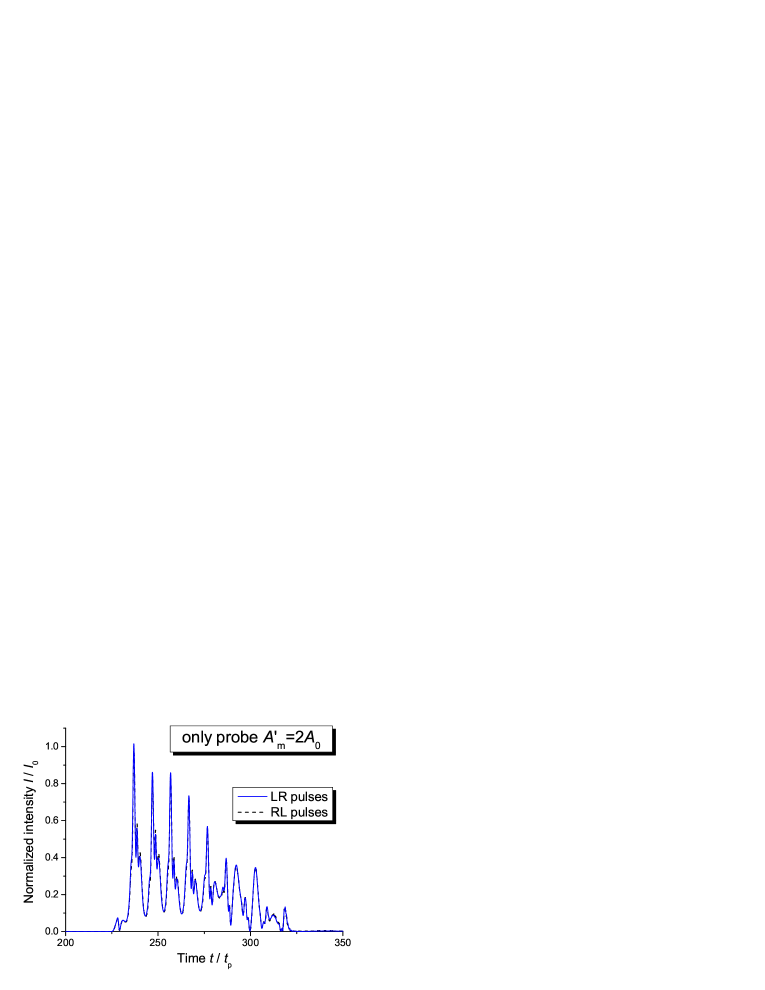
To study the problem of asymmetry, we take a series of probe pulses: the first starts at the instant , while the interval between the other is . All probe pulses are identical and have the same subcritical amplitude . First of all, we consider propagation of LR and RL pulses in the absence of any pump pulse, i.e. without a trap inside the structure. Figure 3 shows the resulting profiles of subcritical probe pulses transmitted through the nonlinear photonic crystal. One can easily see that the transmission in this case is perfectly symmetric: the profiles are identical for both directions, though every individual pulse behaves in a different way comparing with its neighbors. This is the evidence of interaction between the pulses which occurs due to the shortage of the interpulse interval.
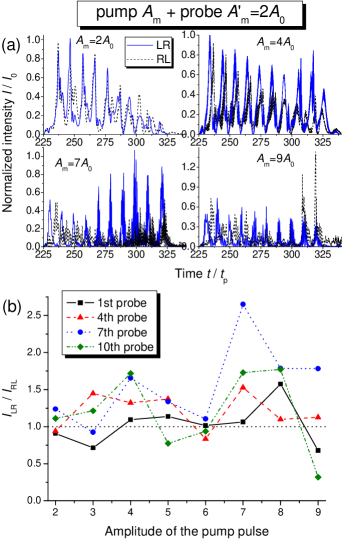
Now we can analyze the influence of light distributions formed by the initial (pump) pulse (see fig. 2) on the properties of the transmitted probe pulses. The results of calculations of intensity profiles at different amplitudes of the pump pulse are depicted in fig. 4(a). The probe pulses start at as previously. It is seen that even at the subcritical amplitude of the pump pulse (), when the residual light intensity inside the photonic crystal is very low (), the perfect symmetry between LR and RL transmission is already broken. Of course, the difference between these two cases is not dramatic, though it gets more pronounced for the latest probe pulses than for the first ones. This is the case for all the variants shown in fig. 4(a) and is perhaps connected with the influence of the first pulses on the trap. However, the correspondence between the LR and RL pulses is still close for . For larger amplitudes ( and ), as the trap forms closer to the entrance of the system, the difference appears even between the first probe pulses moving in opposite directions. They are not equal not only in intensity, but also they need significantly different times to transmit through the structure: LR pulses propagate faster than RL ones. The disparity in intensity grows for latest pulses, so that they can differ by a factor of two and more. This point is illustrated by fig. 4(b) where the ratio of the peak intensities is shown. It is seen that the deviation of this value from unity tends to get greater for the latest probe pulses and for larger pump amplitudes. This figure also suggests the choice of proper pump intensity to achieve the optimal contrast between the LR and RL transmission.
V Quasi-continuous regime
In the previous section, we have considered the case of probe pulses of the same duration as the pump (trapped) pulse. Such situation when the probe pulses effectively experience the relaxation of nonlinearity (due to ) should be discriminated from the quasi-continuous regime. In this last case , so that the influence of the relaxation on the pulse propagation should be not so dramatic. Let us analyze propagation of the probe pulse with the duration ps, while leaving the relaxation time ( fs) and pump pulse duration ( fs) unchanged. The results of calculations in absence of pump are plotted in fig. 5 for different cases: the linear photonic crystal, the nonlinear one without relaxation, and, finally, the nonlinear structure with relaxing Kerr nonlinearity. As previously, we see the symmetry in pulse transmission in all cases. It is also worth to point to the narrow peaks appearing in the profiles of the pulse transmitted through the system with nonlinearity. Obviously, this is the clear evidence of the well-known effect of modulation instability which leads to the breakup of the long pulse into a train of short ones Agrawal . As the comparison between figs. 5(b) and 5(c) shows, the relaxation of nonlinearity promotes the modulation instability and precipitates the breakup. The study of these processes is beyond the scope of this paper, therefore we only make here this short comment and turn to discussion of the influence of the pump pulse on the probe behavior.
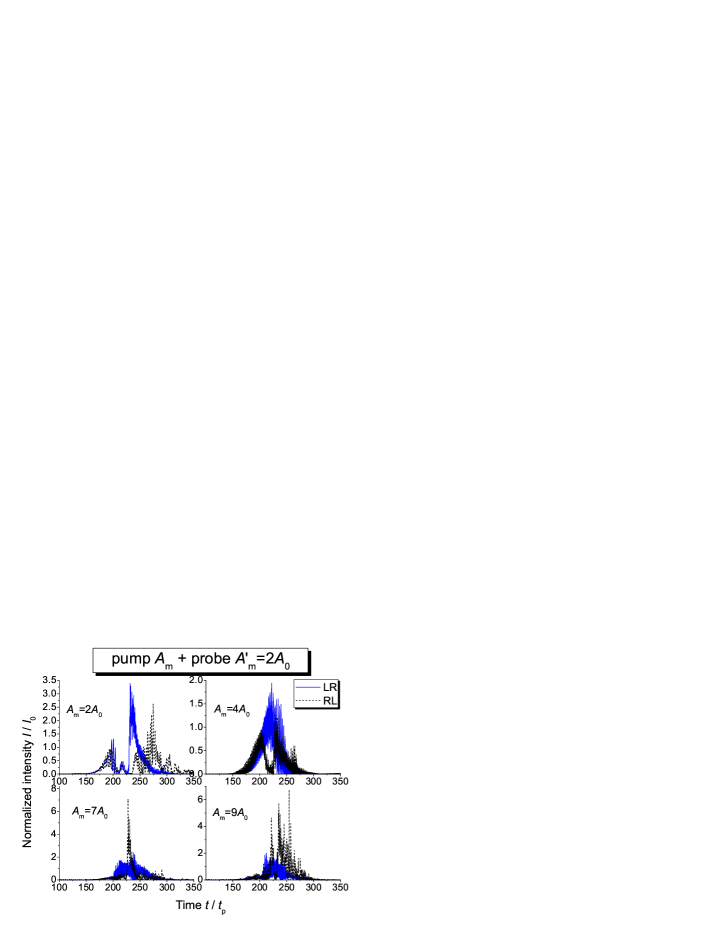
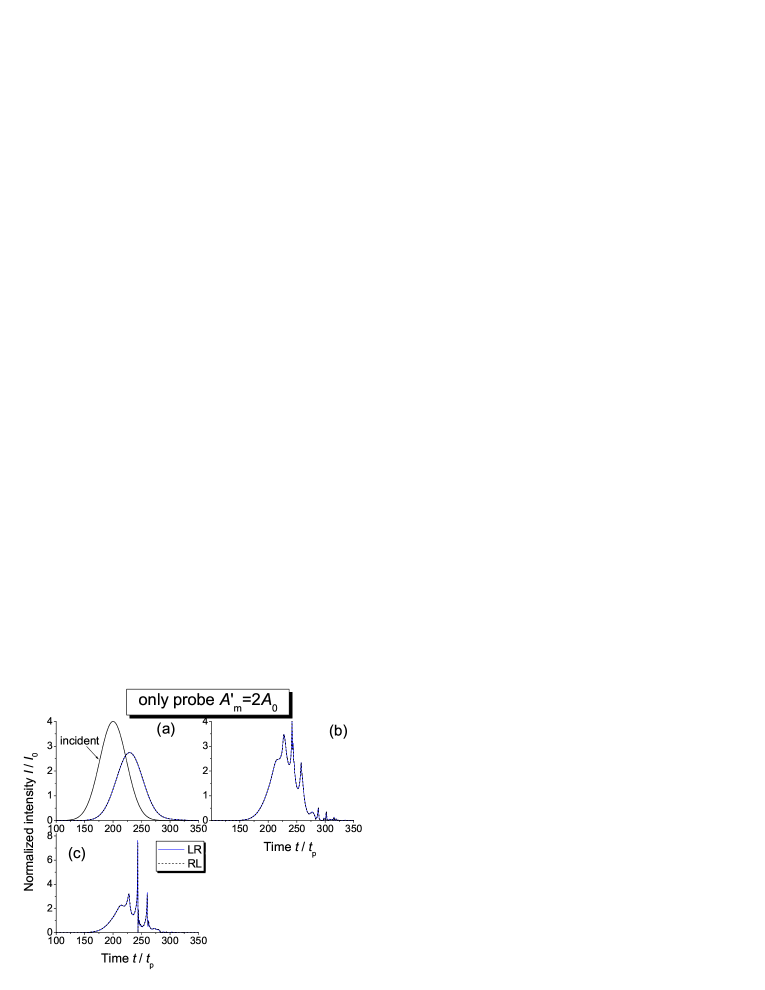
The dramatically increased efficiency of this influence can be easily seen in fig. 6. Even a subcritical pump pulse () appears to be enough to break the symmetry in the propagation of the quasi-continuous probe pulse. Perhaps, this is connected with the heightened sensitivity of such nonlinear processes as the modulation instability to the changes in external conditions. This results in the strong change of the pulse profile, which, together with the asymmetric distribution of the refractive index, leads to the strengthening of the dependence of transmission on the propagation direction. As a result, the sharp rise-up portion of the LR pulse is obtained with the subsequent gradual decrease in intensity. The profile of the RL pulse is fundamentally different. However, at larger amplitudes of the pump pulse ( and ), the situation is inverted: the sharp peaks for the RL pulse and unstructured radiation for the LR one. This can be explained as a result of the probe pulse interaction with the trap localized near the very left end of the photonic crystal: under these conditions, the LR probe is perturbed in the very beginning of propagation and does not have enough time to form a characteristic profile. The contrast in light intensity also increases at higher amplitudes of the pump, so that the peak intensity in one direction exceeds the same value in the other by the factor of three as can be seen in the lower panels of fig. 6.
VI Is the intensity of probe important?
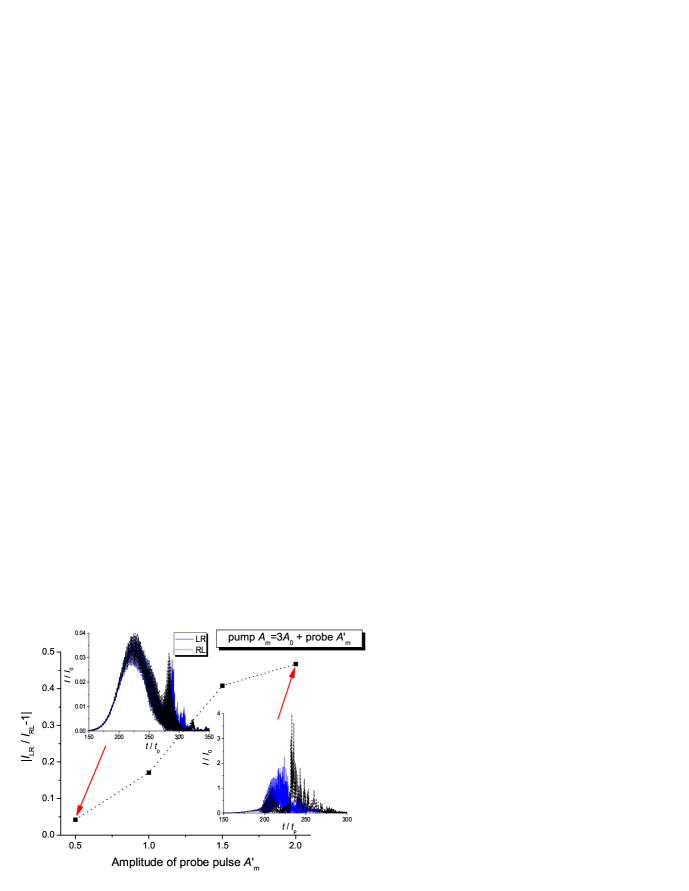
This question should by studied to understand, whether the self-trapping effect is the only process responsible for asymmetric propagation or the interaction of the probe pulse with nonlinear structure must be taken into account as well. Previously we have considered probe pulses with relatively strong amplitude (), not far from the amplitude of self-trapping. Since we are interested only in absolute value of asymmetry, we calculate the quantity as a characteristic of direction dependence. The results of calculations for the quasi-continuous -ps-long probe pulse are shown in fig. 7. One can see that the value of asymmetry strongly depends on the probe amplitude and is close to zero already for . The insets visually demonstrate the difference in pulse profiles in the cases of strongly asymmetrical and almost symmetrical propagation. Similar dependence takes place for short probe pulses (not shown here).
The results of fig. 7 imply that the strong interaction of the probe pulse with the nonlinear photonic structure is necessary to observe asymmetric transmission as well as additional refractive index modulation due to self-trapping. In other words, strong amplitudes of both pump and probe are needed to obtain the described effect. It is hard to demarcate the influence of pump self-trapping and probe interaction in the situations considered. Perhaps, the study of change of asymmetry as a function of slow temporal change of the trap can give some additional clues. However, the situation seems to be similar to that described in ref. Zhukovsky where the asymmetric distribution of refractive index is used to localize the radiation which further nonlinearly interacts with the structure. In our case, the asymmetry in refractive index is caused by the pump pulse (quasi-stationary trap), then the probe pulse nonlinearly interacts with the modified periodic system. We should also emphasize that the nonlinearity relaxation is necessary to obtain the trap Novit and, hence, to obtain a quasi-stationary (and large) change of materials refractive indices which influence the probe pulse. It is also worth noting that high probe intensity makes the proposed scenario of asymmetric transmission different from a typical pump-probe technique.
VII Conclusion
To sum it up, we have considered the possibility of asymmetric light transmission in the regime of pulse self-trapping in the photonic crystal with relaxing Kerr nonlinearity. It is shown that the position of the trap formed by the high-intensity pump pulse strongly influences the propagation of probe pulses and leads to the dependence of the transmission characteristics on the propagation direction. In the case of a series of short probe pulses, this asymmetry is sharp enough only for the late components of the series, while the single long (quasi-continuous) pulse feels the pump radiation much stronger. The light dynamics in this latter case are more complex and include the processes such as the modulation instability. As a result, the efficiency of asymmetric transmission is higher under the quasi-continuous conditions than in the short pulse regime. The dependence of this effect on probe pulse intensity allows to suggest that the role of pump comes to formation of asymmetric refractive index modulation which modifies nonlinear interaction of probe with the material of photonic crystal. Additional evidence for the asymmetric transmission is likely to be given in the study of the effects such as asymmetric bistable response.
Acknowledgement. The work was supported by the Belarusian Foundation for Fundamental Research (Grant No. F11M-008).
References
- (1) M. Scalora, J. P. Dowling, C. M. Bowden, and M. J. Bloemer, J. Appl. Phys. 76, 2023 (1994).
- (2) M. D. Tocci, M. J. Bloemer, M. Scalora, J. P. Dowling, and C. M. Bowden, Appl. Phys. Lett. 66, 2324 (1995).
- (3) S. V. Zhukovsky and A. G. Smirnov, Phys. Rev. A 83, 023818 (2011).
- (4) C. Lu, X. Hu, Y. Zhang, Z. Li, X. Xu, H. Yang, and Q. Gong, Appl. Phys. Lett. 99, 051107 (2011).
- (5) C. Xue, H. Jiang, and H. Chen, Opt. Express 18, 7479 (2010).
- (6) M. W. Feise, I. V. Shadrivov, and Y. S. Kivshar, Phys. Rev. E 71, 037602 (2005).
- (7) X. Cai, X. Wang, and S. Li, Opt. Commun. 285, 1959 (2012).
- (8) V. Grigoriev and F. Biancalana, Opt. Lett. 36, 2131 (2011).
- (9) V. R. Tuz and S. L. Prosvirnin, J. Opt. Soc. Am. B 28, 1002 (2011).
- (10) V. R. Tuz, S. L. Prosvirnin, and S. V. Zhukovsky, Phys. Rev. A 85, 043822 (2012).
- (11) W. Ding, B. Luk yanchuk, and C.-W. Qiu, Phys. Rev. A 85, 025806 (2012).
- (12) S. Feng, C. Ren, W. Wang, and Y. Wang, Europhys. Lett. 97, 64001 (2012).
- (13) E. Plum, V. A. Fedotov, and N. I. Zheludev, Appl. Phys. Lett. 94, 131901 (2009).
- (14) C. Huang, Y. Feng, J. Zhao, Z. Wang, and T. Jiang, Phys. Rev. B 85, 195131 (2012).
- (15) M. Mutlu, A. E. Akosman, A. E. Serebryannikov, and E. Ozbay, Phys. Rev. Lett. 108, 213905 (2012).
- (16) K. Gallo and G. Assanto, J. Opt. Soc. Am. B 16, 267 (1999).
- (17) T. X. Tran and F. Biancalana, Opt. Lett. 37, 1772 (2012).
- (18) Z. Lin, H. Ramezani, T. Eichelkraut, T. Kottos, H. Cao, and D. N. Christodoulides, Phys. Rev. Lett. 106, 213901 (2011).
- (19) L. Ge, Y. D. Chong, and A. D. Stone, Phys. Rev. A 85, 023802 (2012).
- (20) D. V. Novitsky, Phys. Rev. A 85, 043813 (2012).
- (21) J.A. Fleck and P.L. Kelley, Appl. Phys. Lett. 15, 313 (1969).
- (22) S. Trillo, S. Wabnitz, G.I. Stegeman, and E.M. Wright, J. Opt. Soc. Am. B6, 889 (1989).
- (23) R.A. Vlasov and A.G. Smirnov, Phys. Rev. E61, 5808 (2000).
- (24) Z.-M. Meng, F. Qin, and Z.-Y. Li, J. Opt. 14, 065003 (2012).
- (25) D. V. Novitsky, Phys. Rev. A81, 053814 (2010).
- (26) D. V. Novitsky, Phys. Rev. A84, 053857 (2011).
- (27) D. V. Novitsky, J. Nonlin. Opt. Phys. Mater. 21, 1250010 (2012).
- (28) G. P. Agrawal, Nonlinear fiber optics (San Diego, Academic Press, 2007, 4th ed.).