Herschel-PACS observations of [OI]63 m towards submillimetre galaxies at 1⋆
Abstract
We present Herschel-PACS spectroscopy of the [OI]63 m far-infrared cooling line from a sample of six unlensed and spectroscopically-confirmed 870 m-selected submillimetre (submm) galaxies (SMGs) at from the LABOCA Extended Chandra Deep Field South (ECDFS) Submm Survey (LESS). This is the first survey of [OI]63 m, one of the main photodissociation region (PDR) cooling lines, in SMGs. New high-resolution ALMA interferometric 870 m continuum imaging confirms that these six Herschel-targeted SMG counterparts are bona fide sources of submm emission. We detect [OI]63 m in two SMGs with a SNR, tentatively detect [OI]63 m in one SMG, and constrain the line flux for the non-detections. We also exploit the combination of submm continuum photometry from 250–870 m and our new PACS continuum measurements to constrain the far-infrared luminosity, LFIR, in these SMGs to per cent. We find that SMGs do not show a deficit in their [OI]63 m–to–far-infrared (FIR) continuum luminosity ratios (with ratios ranging from –1.5 per cent), similar to what was seen previously for the [CII]158 m–to–FIR ratios in SMGs. These observed ratios are about an order of magnitude higher than what is seen typically for local ultra luminous infrared galaxies (ULIRGs), which adds to the growing body of evidence that SMGs are not simply ‘scaled up’ versions of local ULIRGs. Rather, the PDR line–to–LFIR ratios suggest that the star formation modes of SMGs are likely more akin to that of local normal (lower-luminosity) star-forming galaxies, with the bulk of the star formation occurring in extended galaxy-scale (kpc) regions. These observations represent the first step towards a census of the major PDR cooling lines in typical SMGs that will be attainable with ALMA, enabling detailed modelling to probe the global properties of the star formation and the evolutionary status of SMGs.
keywords:
galaxies: high-redshift – submillimetre: galaxies – galaxies: star formation – galaxies: starburst – galaxies: ISM – infrared: ISM⋆Herschel is an ESA space observatory with science instruments provided by European-led Principal Investigator consortia and with important participation from NASA.
1 Introduction
Far-infrared bright galaxies comprise some of the most luminous galaxies in the local Universe, but they contribute just 0.3 per cent of the total local galaxy luminosity density (Sanders & Mirabel, 1996). At first glance it appears that they are an unimportant component of the galactic zoo, however, sensitive (sub)millimetre cameras have revealed that ultraluminous infrared galaxies (ULIRGs; L L⊙) are much more abundant at high redshifts (). Since their discovery (Smail, Ivison & Blain 1997; Hughes et al. 1998; Barger et al. 1998), nearly 13 years of piece-meal survey work has so far produced samples totalling 850–1200-selected (sub)mm galaxies (SMGs; e.g. Coppin et al. 2006; Austermann et al. 2010; Weiß et al. 2009), with extreme star formation rates (SFRs) of –1000 M⊙ yr-1 (e.g. Kovács et al. 2006; Coppin et al. 2008; Magnelli et al. 2012) and fuelled by vast reservoirs of cold molecular gas (M M⊙; Greve et al. 2005; Tacconi et al. 2006, 2008; Bothwell et al. 2012). Spectroscopic follow-up of a subset of SMGs suggests that the volume density of ULIRGs increases times out to (Chapman et al. 2005; Banerji et al. 2011). Therefore, luminous obscured galaxies likely dominate the total bolometric emission from star formation at early epochs (e.g. Pascale et al. 2009; Marsden et al. 2009; Eales et al. 2009, 2010; Oliver et al. 2010), and possibly correspond to the active starburst progenitor phase of massive spheroidal galaxies (e.g. Lilly et al. 1999).
However, several critical questions about SMGs remain unanswered. The most fundamental of these is: How is the immense luminosity of an SMG powered? – by an intense single compact nuclear starburst (as seen in local ULIRGs) or by a more extended starburst (as seen in local normal star-forming galaxies)? One route to tackle this question is to ask what are the local analogues of SMGs and can these be used to understand the physics of the star formation activity within the distant SMG population? Are SMGs simply ‘scaled up’ ULIRGs, where the star formation occurs in a compact and highly obscured nuclear region – potentially with a significant contribution from an active galactic nucleus (AGN; e.g. Alexander et al. 2005b)? Or does some fraction of the population resemble very scaled up ‘normal’ star-forming infrared (IR) galaxies, which have far-IR emission arising from an extended, cooler component (termed ‘cirrus’; Efstathiou & Rowan-Robinson 2003)? If we could empirically match subsets of the SMG population to local galaxies, then this would provide significant insights into the physical processes occuring within this important population. The synergy of Herschel and the Atacama Large Millimetre Array (ALMA) provides a novel opportunity to move beyond the first generation of detection experiments by beginning to examine the interplay between the interstellar medium (ISM) and the power source of high-redshift luminous dusty star-forming galaxies.
1.1 Far-infrared spectroscopy: a probe of SMG astrophysics
The primary diagnostic lines of the ISM in the far-IR have traditionally included the fine-structure lines of [OIII]52, [NIII]57, [OI]63, [OIII]88, [NII]122, [OI]146, [CII]158 m, [CI]370 m, and [CI]610 m. The relative strengths of these lines can be modeled as a function of the neutral gas cloud density and the cloud-illuminating far-UV radiation field intensity in photodissociation regions (PDRs; e.g. Tielens & Hollenbach 1985; Kaufman et al. 1999; Wolfire et al. 2003; Meijerink & Spaans 2005), providing diagnostics of the physical conditions of the ISM. While much has been learned about the ISM conditions in Galactic star-forming regions and local galaxies through facilities such as the Infrared Space Observatory (ISO; e.g. Malhotra et al. 2001; Luhman et al. 1998, 2003; Negishi et al. 2001) and the Kuiper Airborne Observatory (KAO; e.g. Crawford et al. 1985; Stacey et al. 1991; Poglitsch et al. 1995), due to previously poor instrument sensitivity and inaccessibility from the ground, dedicated surveys probing the ISM conditions in samples of high redshift dusty galaxies have only recently begun in earnest (e.g. Stacey et al. 2010; Decarli et al. 2012) with the commissioning of purpose-built instrumentation like the redshift () and Early Universe Spectrometer (ZEUS; Stacey et al. 2007; Hailey-Dunsheath 2009). For galactic and extragalactic systems, the ‘classical’ PDR tracers are the brightest fine-structure emission lines [CII]158 m and [OI]63 m, acting as the primary coolants for the dense (–105 cm-3), warm (T–1000 K), and neutral material. Since [CII]158 m and [OI]63m correlate well with SFR and are sufficiently luminous (accounting for as much as –1% of the bolometric luminosities in nearby galaxies and are thus much more luminous than molecular lines; Stacey et al. 1991), they have the potential to be used as powerful tracers of ISM conditions out to high-. However, ISO observations of local ULIRGs revealed that the [CII]158 m emission is about an order of magnitude lower relative to the far-IR (FIR) continuum flux than is seen in normal and starburst galaxies (e.g. Malhotra et al. 2001; Luhman et al. 2003). And this has recently been shown by Graciá-Carpio et al. (2011) using Herschel-PACS to be a general aspect of far-IR fine structure lines (see Section 4 and Graciá-Carpio et al. 2011 for a discussion of a possible physical explanation). The potential weakness of [CII]158 m has implications for its use as a star formation tracer for high-redshift studies (; e.g. Maiolino et al. 2005; although cf. Maiolino et al. 2009; De Breuck et al. 2011). In order to make further progress in understanding the driver of star formation in luminous high-redshift SMGs in relation to galaxy populations in the local Universe, we need to begin compiling a similar set of (multi-transition) CO, [CII]158 m, and [OI]63 m data (which provide strong joint constraints on the PDR and star formation conditions such as the Hydrogen volume density, , and the far-UV radiation field strength, in Habing units) for typical luminous star-forming SMGs at the epoch where their population peaks (1–3).
1.2 This paper: New Herschel observations of [OI] 63 m in SMGs
In the present paper we will be discussing observations performed with the ESA Herschel Space Observatory (Pilbratt et al., 2010), in particular employing Herschel’s large telescope and powerful science payload to perform photometry and spectroscopy using the Spectral and Photometric Imaging REceiver (SPIRE; Griffin et al. 2010) and the Photodetector Array Camera and Spectrometer (PACS; Poglitsch et al. 2010). This paper presents the first attempt at compiling a census of the strength of [OI]63 m in far-IR luminous SMGs at the peak of star formation activity in the Universe (1–2), enabling us to determine its suitability as a star formation tracer at high redshift. These Herschel observations represent a key stepping stone to future ALMA studies of [CII]158 m and (multi-transition) CO to investigate the ISM physics of SMGs in detail, since [OI]63 m emission can only be measured in SMGs with Herschel-PACS, as the emission line falls outside of the ALMA bands for all but the highest redshifts ().
This paper is organized as follows: the sample selection, Herschel-PACS spectroscopic observations and data reduction are described in Section 2. In Section 3, we present the main analysis and results of the PACS spectrocopy and combine these measurements with LFIR estimates obtained from the combination of Large Apex Bolometer Camera (LABOCA; Siringo et al. 2009) and new Herschel-SPIRE and PACS photometry. We discuss the implications of our results in Section 4. Finally, our conclusions are given in Section 5. Throughout the paper we assume cosmological parameters of , , and km s-1 Mpc-1 (Spergel et al., 2003).
2 Observations and data reduction
| SMG IAU name | Nickname | Counterpart Parameters | Observation Parameters | Spectral Measurements | |||||||
|---|---|---|---|---|---|---|---|---|---|---|---|
| R.A. | Dec. | zopt | OD | ObsID | AOR | [OI]63 m Flux | Continuum Flux | Spectrum rms | |||
| (J2000) | (s) | ( W m-2) | (mJy) | ( W m-2) | |||||||
| LESS J033329.9–273441 | LESS21 | 3:33:29.73 | -27:34:44.4 | 1.235a | 1020 | 1342239701 | 8146 | [141 m] | 3.9 | ||
| LESS J033217.6–275230 | LESS34 | 3:32:17.61 | -27:52:28.1 | 1.0979b | 1020 | 1342239703 | 7874 | [133 m] | 4.1 | ||
| LESS J033331.7–275406 | LESS66 | 3:33:31.92 | -27:54:10.3 | 1.315c | 1013 | 1342239369 | 8349 | [146 m] | 4.1 | ||
| LESS J033155.2–275345 | LESS88 | 3:31:54.81 | -27:53:41.0 | 1.269a | 1020 | 1342239705 | 8214 | [143 m] | 4.2 | ||
| LESS J033140.1–275631 | LESS106 | 3:31:40.17 | -27:56:22.4 | 1.617a | 1019 | 1342239753 | 11444 | [165 m] | 4.4 | ||
| LESS J033150.8–274438 | LESS114 | 3:31:51.09 | -27:44:37.0 | 1.606a | 1020 | 1342239702 | 11444 | [165 m] | 5.3 | ||
2.1 Sample selection and multi-wavelength properties
The requirement of our survey is a sufficient number of SMGs selected in a uniform manner that have been spectroscopically confirmed to lie between so that the redshifted [OI]63m emission line will lie within the most sensitive region of the first order of the PACS spectrometer (107–189 m; Poglitsch et al. 2010). The SMGs also need to be accessible by ALMA for future studies (i.e. ). One such field is that covered by the 870 m LABOCA Extended Chandra Deep Field South (ECDFS) Submillimetre Survey (LESS; Weiß et al. 2009), which comprises a parent sample of 126 SMGs detected above 3.7- in the largest contiguous () and uniform map with a 1 rms of mJy. Biggs et al. (2011) have identified secure radio and mid-IR counterparts for 63 per cent of these SMGs. Since the ECDFS is one of the pre-eminent cosmological deep fields and has as such been extensively imaged and targeted spectroscopically, some of these counterparts already possess secure archival redshifts. Redshifts for the remaining counterparts without archival spectroscopy were targeted through a large observational programme (zLESS; Danielson et al., in preparation) using the European Southern Observatories (ESO) Very Large Telescope (VLT) FOcal Reducer and low dispersion Spectrograph v.2 (FORS2) and VIsible MultiObject Spectrograph (VIMOS). At the time the Herschel proposal was submitted in 2010, the VLT survey was per cent complete. The total number of SMGs fulfilling the requirements outlined above at that time was nine, and these nine SMGs thus comprise our Herschel-PACS spectroscopy sample. Thus, our sample is complete in terms that it is comprised of all of the spectroscopically confirmed SMGs in LESS that are radio and/or 24 m identified.
We make use of additional multi-wavelength data sets available for the radio and/or 24 m LESS SMG counterparts in order to further interpret our results, which we now briefly describe. Wardlow et al. (2011) measured the optical-mid-IR photometry for the robustly identified LESS SMG counterparts and provide photometric redshift estimates and LIR estimates. In order to assess any potential AGN contribution in the SMGs, we use the Spitzer InfraRed Array Camera (IRAC; Fazio et al. 2004) photometry from Wardlow et al. (2011) extracted from the Spitzer IRAC/MUSYC Public Legacy Survey in the ECDFS (SIMPLE; Damen et al. 2011) and the 250 ks and 4 Ms X-ray imaging and catalogues of the ECDFS/CDFS (Lehmer et al. 2005; Xue et al. 2011). Here we also make use of new public Herschel Multi-tiered Extragalactic Survey (HerMES; HerMES Collaboration et al. 2012) Herschel-SPIRE maps to extract 250–500 m photometry in combination with the zLESS spectroscopic redshifts, providing the tightest constraints on LFIR currently possible for these SMGs (to per cent). In addition, high-resolution ( full width at half maximum; FWHM) ALMA 870 m continuum data have been collected for the majority of the 126 LESS SMGs during cycle 0 to a 1 rms depth of 0.4 mJy, yielding positions accurate to (Karim et al., in preparation). The ALMA data have enabled us to verify unambiguously the validity of the radio and/or mid-IR counterparts for our SMG sample, which are used here as a basis for the PACS target positions and central frequency tuning of the spectrometer (see Section 3.1.1 for a summary of the ALMA ID results for our sub-sample).
2.2 Herschel-PACS spectroscopy observations
The [OI]63 m emission line in our sample of SMGs was observed with the Herschel Space Observatory’s PACS red camera over 112-167 m using the high-resolution range scan spectroscopy mode and employing a chop/nod to provide background subtraction. For each target, we covered a small spectral range of m, noting that only the central m of the spectra are usable, corresponding to –0.05 to account for small redshift errors and/or systematic offsets from the optical redshift, as well as to allow for a reliable continuum or baseline fit. The aim was to reach a uniform 1 line sensitivity of W m-2 across the sample (see Table reftab:obs for the actual sensitivities that were reached). Six targets were observed in 2012 February over a total of 15.4 hrs (including overheads). Table 1 gives the target list, observation mode parameters, and individual integration times. We note that an additional three sources were targeted as part of this programme (LESS10, LESS50 and LESS118; see Biggs et al. 2010), but the IDs (and therefore redshifts) have been subsequently revised based on new ALMA continuum data (Karim et al., in preparation; see also Section 3.1.1). Thus, these three observations do not provide interesting constraints on the [OI]63 m emission from SMGs and so we have dropped them from the analysis.
2.3 Data reduction
The data were reduced with the Herschel interactive processing environment (hipe v8.1.0; Ott 2010). We employed the background normalisation pipeline script distributed with hipe, which implements an alternative way to correct for drifts in the response of PACS during the observation and an alternate flux calibration than the standard pipeline. Using this alternative pipeline script results in marginally better quality data products with smoother continua, which is helpful when searching for faint spectral features atop a faint continuum. As part of the standard pipeline, the continuum in each of the 16 spectral pixels was scaled to the median value to correct for residual flat field effects, and finally the two nod positions were combined to completely remove the sky (telescope) background. Given that our targets are point sources to PACS we have measured line fluxes from spectra extracted from the central spatial pixel of the pixel field-of-view of the PACS spectrometer. The pipeline automatically applies a beam size correction factor and an additional in-flight correction of the absolute response. The spectra have been re-binned to Nyquist sample the spectral resolution element, which is appropriate for resolved lines (see Fig. 1). We have chosen not to upsample111Upsampling refers to increasing the sampling rate of a signal. Here we use upsample=1. If upsample is used, then the frequency bins are not independent (ie. they will have some data in common) and this will have the effect of changing the spectral noise properties as well as the line widths. the data, so that each bin is independent, yielding reliable estimates of the noise properties in the spectra. A similar data reduction strategy was adopted by the Survey with Herschel of the ISM in Nearby Infrared Galaxies (SHINING) team for reducing faint spectra of high-redshift galaxies (priv. comm. E. Sturm and J. Graciá-Carpio).
Third order data in the wavelength range 51–73 m are collected by the blue camera in parallel with the first order [OI]63 m data. However, these observations are not frequency-tunable and cover only m. Nevertheless, the data were reduced using the same procedure as above and examined for any serendipitous line detections, but the useful parts of the spectra do not cover any useful known lines at our source redshifts and so we do not discuss these data further.

3 Analysis and results
We present new [OI]63 m data for the SMGs, including two new detections of the emission line, and one marginal detection. For the non-detections, upper limits are only useful if both the counterpart and redshift are correct: this Herschel spectroscopy program was designed to target only the most statistically probable ‘robust’ counterparts also posessing good quality redshifts. However, given the significant time lag from the survey definition to the time of data acquisition ( years), new data have since been accumulated from zLESS and ALMA that can help us to verify if the targeted counterparts and redshifts originally chosen are still correct. In the following section we examine and discuss each PACS spectrum. We then derive the FIR continuum flux and LFIR for each SMG via a modified blackbody spectral energy distribution (SED) fit to publicly available submm data so that we can explore the [OI]63 m–to–FIR continuum ratios of our sample as a function of LFIR in context with other low- and high-redshift galaxy populations.
3.1 Spectral line and continuum measurements
We detect weak [OI]63 m emission in LESS66, LESS106 and tentatively in LESS88 (see Fig. 1). We can derive useful upper limits for the cases where the line emission is not detected, and only in those cases where we are certain that the correct redshift and/or SMG counterpart was targeted. We detect continuum emission in LESS66, LESS88, and LESS114 at , and for the continuum non-detections we derive upper limits to the continuum flux density in the PACS spectral range.
For the detections, a Gaussian profile and continuum are fitted simultaneously to the Nyquist sampled spectra by performing non-linear Levenberg-Marquardt least-squares minimization using the MPFIT IDL package (Markwardt, 2009). Since the pipeline-calculated errors in the PACS spectrum are known to be unreliable, we have clipped off the noisy edges from each spectrum ( m on each side) and weight each of the remaining central channel data points equally. To calculate the velocity-integrated flux of the [OI]63 m emission line, we integrate the best-fitting (continuum-subtracted) Gaussian profile. The 1 errors on the velocity-integrated flux and continuum flux density are derived from a bootstrap estimate generated by adding random noise with a 1 rms equivalent to the 1 rms of the line-free channels, repeated 1000 times with replacement (e.g. see Wall & Jenkins 2003). This should provide a reasonable estimate of the uncertainties since our choice of spectral binning (upsample=1) ensures that the noise should not be strongly correlated between channels.
For the non-detections we calculate 3 upper limits assuming a Gaussian profile with a 3 peak height centred at the expected position of the [OI]63m emission line. We use the channel-to-channel 1 rms noise across the clipped spectra and adopt an instrumental resolution-corrected emission line FWHM of 300 km s-1, which is consistent with our detections and those of other high-redshift galaxies that have been observed with PACS (e.g. Sturm et al. 2010).
Integrated emission line fluxes, upper limits and continuum flux densities are summarized in Table 1. Note that the rms uncertainties associated with the absolute calibration of PACS have not been folded into the quoted flux uncertainties and are estimated to be per cent222See http://herschel.esac.esa.int/twiki/bin/view/Public/PacsCalibrationWeb.
In the following we first summarize the counterpart identifications in light of the new ALMA data, and then discuss the details of the counterpart identifications and redshift robustness for each targeted SMG in turn, along with the new PACS spectroscopy results. Reference to a ‘robust’ counterpart is meant in a statistical sense: given a potential radio or mid-IR counterpart with its flux density and radius from the SMG position, the a priori probability, , of finding at least one object within that radius of at least that flux density from the expected number of events at random is . A ‘tentative’ counterpart refers to sources with and is often still low enough to indicate a likely counterpart. Ivison et al. (2002, 2007) and Biggs et al. (2011) provide a more in depth explanation on this subject. Even though this is the only feasible route for precisely pin-pointing the positions of the bulk of SMGs in the absence of very high-resolution interferometric continuum submm data (ie. in the pre-ALMA era), this is only a statistical identification method. Recent submm inteferometric observations of SMGs have demonstrated that potentially a large fraction of ‘robust’ SMG identifications may be more complicated (with up to per cent breaking up into multiple components; see e.g. Cowie et al. 2009; Wang et al. 2011; Hatsukade et al. 2010). Armed with new deep high-resolution ALMA 870 m continuum data (Karim et al., in preparation), we can test the reliability of the counterpart identifications using the radio or mid-IR, which is used here as a basis for targeting the [OI]63 m emission line with Herschel-PACS. Redshifts for the counterparts were obtained by an ESO VLT FORS2/VIMOS Large Programme (zLESS; Danielson et al., in preparation) and are supplemented by the wealth of existing public archival spectroscopy in the ECDFS. The quality of the redshifts are categorized by zLESS as follows: Q=1 refers to a secure redshift (e.g. based on the identification of multiple lines) and Q=2 refers to a probable redshift (e.g. based on a single bright emission line identification).
3.1.1 Summary of the counterpart ID re-examination in light of new ALMA data
In summary, after examining the preliminary new ALMA continuum data from Karim et al. (in preparation), it appears that our original sample of nine targets (see Section 2.1) should be reduced to six. The ALMA data indicate that we have not targeted a counterpart associated with submm continuum emission in two cases (LESS10 and LESS118) and we thus discard these sources from our sample and from further discussion. The ALMA data have also not been able to validate the ID for LESS50 (whether this is because the submm emission is resolved out in the ALMA map or that the SMG has split up into several fainter sources when seen by ALMA – none of which correspond to the ID), and so to be conservative we also discard this source from the sample. Although, we note that our discarded targets are still radio or 24 m emitting galaxies (just not the source of the submm emission) with good quality redshifts and thus remain useful data for other purposes. The six remaining targets are associated with ALMA continuum emission and possess a good quality redshift so we can safely measure line fluxes or sensitive upper limits in these cases: LESS21, LESS34, LESS66, LESS88, LESS106, and LESS114.
In a few cases (LESS34, LESS106, LESS114) it appears that the LABOCA-detected SMG may be splitting up into two or more continuum sources when seen by ALMA at much higher resolution. For these, ideally the LABOCA and SPIRE photometry should first be deblended or deconvolved before calculating the LFIR values in Section 3.2. Unfortunately, without complete redshift information and multiple interferometric photometry for all of the ALMA continuum sources this is impossible to do in a robust way, and it is beyond the scope of this paper. The diagnostic we are interested in comparing with literature values is the [OI]63 m-to-FIR continuum ratio versus LFIR for the SMGs. If the FIR continuum is reduced accordingly, the [OI]63 m–to–FIR continuum ratio will increase, and so this has little bearing on our main finding in this paper that this ratio is high for SMGs compared to local galaxies with similar LFIR (see Section 3.3). Thus, by not correcting the FIR continuum luminosity we follow a conservative approach.
3.1.2 LESS21
It has a tentative 24 m counterpart (e.g. borderline secure, with ), and there is ALMA continuum emission coincident with this position, confirming the ID.
The zLESS spectroscopic redshift of this counterpart is . The zLESS VIMOS spectrum of this counterpart is consistent with the photometric redshift solution of from Wardlow et al. (2011), with the tentative detection of MgII absorption. It is not detected in the X-ray, and has a 3 upper limit on its full-band flux of S erg cm-2 s-1, derived from the 250 ks X-ray imaging of the ECDFS (Lehmer et al., 2005). The S8μm/S4.5μm colour ratio is , indicating that the galaxy contains a negligible contribution to its energetics from an AGN (see Coppin et al. 2010).
Given the optical redshift, the [OI]63 m emission line is expected to lie at 141.21 m, however no line emission near this wavelength is apparent in the spectrum. We thus calculate a 3 upper limit to the emission line flux.
3.1.3 LESS34
It neighbours LESS10 ( arcsec away) and has a single secure 24 m counterpart (and formally no secure radio counterpart), which was targeted with PACS. There does appear to be some weak ALMA continuum emission coincident with this targeted ID, however there is also another bright ALMA source lying just outside of the SMG counterpart radius adopted by Biggs et al. (2011). The archival redshift of our targeted source, (Q=1), is from Vanzella et al. (2005). The single SMG identified with LABOCA is thus possibly comprised of multiple sources of submm emission, which would have the effect of a reduced inferred LFIR for our targeted counterpart. It is not detected in the X-ray, and has a 3 upper limit to its full-band flux of S erg cm-2 s-1, derived from the 4 Ms X-ray imaging of the CDFS (Xue et al., 2011). The S8μm/S4.5μm colour ratio is , indicating that the galaxy contains a negligible contribution to its energetics from an AGN (see Coppin et al. 2010).
Given the redshift, we expect the [OI]63 m emission line to lie at 132.55 m. We do not see an emission line in the spectrum near this wavelength and so a 3 upper limit to the emission line flux is calculated.
3.1.4 LESS66
It has a single robust radio and 24 m counterpart. The ALMA continuum data reveal continuum emission coincident with this ID. The zLESS redshift of this counterpart from an excellent quality (Q=1) VIMOS spectrum is indicated to be , although zLESS FORS2 spectroscopy indicates (Q=1). A secure (Q=1) Keck-based spectroscopic redshift of was obtained by Silverman et al. (2010) from a program to target optical and near-IR counterparts of faint X-ray sources in the ECDFS. Interestingly, Silverman et al. (2010) classify this source as a Broad-Line AGN (BLAGN) based on the presence of at least one emission line having a FWHM km s-1. It is detected in the X-ray with a full-band flux of S erg cm-2 s-1 (Lehmer et al., 2005). Its X-ray flux is consistent with that expected for an optically classified QSO given its submm flux density and is higher than typically seen in SMGs ( erg cm-2 s-1; Alexander et al. 2005b). Although there is clearly a luminous AGN in this SMG, its S8μm/S4.5μm colour ratio of indicates that the AGN is likely not dominating its mid–to–far-IR energetics (see Coppin et al. 2010).
Given the optical redshifts, the [OI]63 m line is expected to lie between 145.95–146.20 m. We find a weak detection of [OI]63 centred at m (corresponding to a redshift of ), offset by km/s from the Keck optical redshift (), which is similar in magnitude to the difference between the two zLESS optical redshifts. This shift in the [OI]63 m emission from the optical-based redshift is likely a real effect since offsets of this magnitude are often seen in BLAGN. The best-fitting FWHM of the line emission is km s-1, which is narrower than the instrumental resolution at this wavelength ( km s-1), which is unphysical. We thus proceed to fit the spectrum holding the line FWHM fixed to the instrumental resolution to yield a less biased line flux (although we note that this will artificially decrease the quoted error budget on the fitted integrated line flux in Table 1). In any case, the best-fitting observed line width (the line is unresolved) implies that there is no sign of an outflow with velocities significantly above the typical Keplerian motions of an SMG ( a few 100 km s-1). This despite the high SFR of LESS66 of M⊙ yr-1 (see Table 2) which would yield supernova (SN) per year assuming a Salpeter (1955) initial mass function (IMF), resulting in a significant input of mechanical energy (1 SN J) into the ISM.
3.1.5 LESS88
It has a single secure robust radio counterpart, which is also detected at 24 m (formally a tentative counterpart). The ALMA data show a single continuum source coincident with this ID. The zLESS spectroscopic redshift is (Q=2). It is not detected in the X-ray, and has a 3 upper limit to its full-band flux of S erg cm-2 s-1, derived from the 250 ks X-ray imaging of the ECDFS (Lehmer et al., 2005). Its S8μm/S4.5μm colour ratio is , indicating that an AGN is unlikely to be contributing significantly to the energetics of the system (see Coppin et al. 2010).
Given the optical redshift, the [OI]63 m line is expected to lie at 143.36 m, and there appears to be some weak emission near this position in the spectrum and we claim a tentative detection of [OI]63 m in LESS88. The emission is weak, which precludes a successful Gaussian fit. We thus fix the centre and height of a Gaussian by eye and proceed to fit for the FWHM (resulting in a FWHM of km s-1 which has been corrected for an instrumental resolution of 261 km s-1 at this wavelength). We note that holding the two Gaussian parameters fixed will artificially decrease the quoted error budget on the fitted integrated line flux in Table 1. This results in a reasonable line shape and we overplot it on Fig. 1. The line emission is offset approximately by 300 km s-1 from the optical redshift, noting that offsets of –300 km s-1 from the H and CO derived redshifts are often seen in infrared-bright high-redshift star-forming galaxies (e.g. Sturm et al. 2010; Steidel et al. 2010).
3.1.6 LESS106
It has a single secure robust IRAC 8.5 m counterpart which is also detected in the radio (formally only a tentative ID on its own) and at 24 m (not a formal robust or tentative ID). This is the ID we targeted with PACS. This counterpart also shows some coincident ALMA continuum emission, although we note that the emission is rather weak and that the sensitivity of the beam is only per cent at this location. There are actually a few weak ALMA continuum sources present in the beam, and so several sources could be responsible for producing the submm flux density seen as a single SMG in the LABOCA map. The zLESS spectroscopic redshift of our target is (Q=2). It is detected in the X-ray with a full-band flux of S erg cm-2 s-1 (Lehmer et al., 2005), which is consistent with typical X-ray detected SMGs ( erg cm-2 s-1; Alexander et al. 2005b). Although there is an AGN in this SMG, its S8μm/S4.5μm colour ratio is , indicating that an AGN is unlikely to be contributing significantly to the energetics of the system (see Coppin et al. 2010).
Given the optical redshift of our Herschel-targeted counterpart, , the [OI]63 m line is expected to lie at 165.34 m, and a emission line is seen at this wavelength (and consistent with the 1 error on the optical spectroscopic redshift). The line has a FWHM of km s-1 (corrected for an instrumental resolution of 227 km s-1 at the observed wavelength). We note that this FWHM is similar to the mean CO FWHM for SMGs ( km s-1; Bothwell et al. 2012).
SMG nickname S250 S350 S500 S870 FIR continuum flux LFIR Td SFR (mJy) (mJy) (mJy) (mJy) ( W m-2) ( L⊙) (K) (M⊙ yr-1) LESS21 LESS34 LESS66 LESS88 LESS106 LESS114
3.1.7 LESS114
It has a single secure robust radio and 24 m counterpart, which was targeted with PACS. The zLESS FORS2 spectroscopic redshift is (Q=1). This counterpart also shows some ALMA continuum emission. However, there appears to be a nearly-equivalently bright ALMA continuum source present in the field, and so it is likely that two sources could be responsible for producing the submm flux density seen as a single SMG in the LABOCA map. It is detected in the X-ray with a flux of S erg cm-2 s-1 (Lehmer et al., 2005), which is consistent with typical X-ray detected SMGs ( erg cm-2 s-1; Alexander et al. 2005b). Although there is an AGN in this SMG, its S8μm/S4.5μm colour ratio is , indicating that an AGN is unlikely to be contributing significantly to the energetics of the system (see Coppin et al. 2010).
Given the optical redshift, the [OI]63 m line is expected to lie at 164.65 m, but there is no apparent emission near this position in the spectrum. We therefore derive a 3 upper limit to the line flux.

3.2 Far-infrared SED fitting
We have constrained the far-IR SEDs of our SMG sample by fitting their observed submm photometry with a simple modified blackbody spectrum of the form multiplied by an emissivity function , where the dust temperature, , determines the location of the SED peak and is the power law index of our simplified dust emissivity power law. Observations of local and distant galaxies constrain to between 1 and 2 in the Rayleigh-Jeans side of the emission spectrum so we fix (e.g. Hildebrand 1983; Agladze et al. 1994; Dunne & Eales 2001). By fixing , we are assuming that the dust properties are similar in all the SMGs, but note that we do not account for possible systematics in our quoted errors. For reference, changing the value of by changes the best-fitting dust temperatures by about –10 K and the integrated IR luminosities by –15 per cent. As in Section 3.1, we have used the least-squares minimization MPFIT IDL package from Markwardt (2009) to perform the fitting.
The submm photometry used in each SED fit includes the deboosted LABOCA 870 m flux densities from Weiß et al. (2009), SPIRE 250, 350, and 500 m photometry (see Table 2), and also our new PACS continuum flux densities or upper limits (from 114–165 m, depending on the redshifted [OI]63 m location; see Table 1). We have extracted the SPIRE 250, 350, and 500 m flux densities and instrumental errors for our SMGs from the publicly available HerMES DR1 maps333The public SPIRE maps used in this paper were obtained through the Herschel Database in Marseille, HeDaM (hedam.oamp.fr/HerMES). (HerMES Collaboration et al., 2012) at the radio or 24 m counterpart positions. Our SPIRE flux density measurements should be less biased on average than other methods that could be employed, such as peak matching or measuring the flux density at the submm position, since there is less combined uncertainty in the true source position when using the more precise radio or mid-IR positions to measure the SPIRE flux densities (e.g. Coppin et al. 2008). We have added confusion noise estimates of 4.8, 5.5, and 6.1 mJy from Nguyen et al. (2010) in quadrature to the instrumental errors at 250, 350 and 500 m, respectively, and these errors are used in the SED fitting routine, as per the standard practice (e.g. Magnelli et al. 2012).
We then calculate LFIR and the FIR continuum flux using the following common definitions for ease of comparing with the literature compilation of Graciá-Carpio et al. (2011) who use the same definitions. We integrate the best-fitting rest frame SED between 40–500 m to derive LFIR, as defined by Sanders & Mirabel (1996). Following Sanders & Mirabel (1996), we also calculate the FIR continuum flux by integrating the rest frame SED between 42.5–122.5 m and dividing this by D, where DL is the luminosity distance. The errors on FIR and LFIR are derived from the formal 1 errors in the fitted parameters computed from the covariance matrix returned by MPFIT. Because our single temperature modified blackbody model does not reproduce the Wien side of the far-IR SED well for some of the SMGs (see Fig. 2) we are likely to be underestimating the true value of FIR and LFIR in these cases. To check this we use the range of SEDs from the Dale & Helou (2002) template library normalised such that they are consistent with our measured photometry in order to estimate approximate correction factors to our values in Table 2 for each SMG (which are of course dependent on the SED templates used). We find that our FIR continuum flux and LFIR values for both LESS21 and LESS34 in Table 2 are potentially underestimated by factors of and 1.7, respectively, and that our FIR continuum flux and LFIR values for LESS114 are potentially underestimated by factors of and 1.5, respectively. Applying these correction factors to these SMGs would move these sources down and to the right in Fig. 3 by the same factors. We find negligible correction factors for our other sources, whose SEDs are better sampled at rest frame wavelengths 120 m (see Fig. 2).
We calculate the SFR for each SMG following Kennicutt (1998): . This relation assumes that the IR luminosity is predominantly powered by star formation (i.e. a negligible contribution from an AGN, which is a good assumption in general for SMGs; e.g. Alexander et al. 2005a, b; Pope et al. 2008; Menéndez-Delmestre et al. 2009; Coppin et al. 2010; see also Section 3.1) and comes from a starburst less than 100 Myr old with a Salpeter (1955) IMF. This relation also assumes that LIR is calculated between 8–1000 m. Because our single temperature modified blackbody model does not reproduce the Wien side of the far-IR SED needed in order to infer the full rest-frame LIR from 8–1000 m (e.g. Blain, Barnard & Chapman 2003), we use the approach of Magnelli et al. (2012) for calculating LIR: we have inferred LIR using the definition of Helou et al. (1988), L–122.5 m], and applied a bolometric correction factor of 1.91 from Dale et al. (2001). As Magnelli et al. (2012) note, this introduces uncertainties in our LIR estimates of the order of per cent due to the variation of intrinsic SED shapes, which is not included in our quoted SFR uncertainties.
Table 2 lists our SED-fit derived FIR, LFIR, Td and SFR for each SMG, and Fig. 2 gives our best-fitting SEDs. The SED fitting has confirmed that our sample of SMGs are far-IR luminous galaxies with L–3 L⊙ (and correspondingly L–5 L⊙) and T–40 K and harbour intense starbursts with SFRs of –1000 M⊙ yr-1, consistent with (while lying towards the lower luminosity end of the distribution) previous SMG SED measurements (e.g. Kovács et al. 2006; Coppin et al. 2008; Magnelli et al. 2012), and reminiscent of the local (U)LIRG population (Sanders & Mirabel, 1996).
3.3 Probing the [OI]63 m strength in high-redshift SMGs
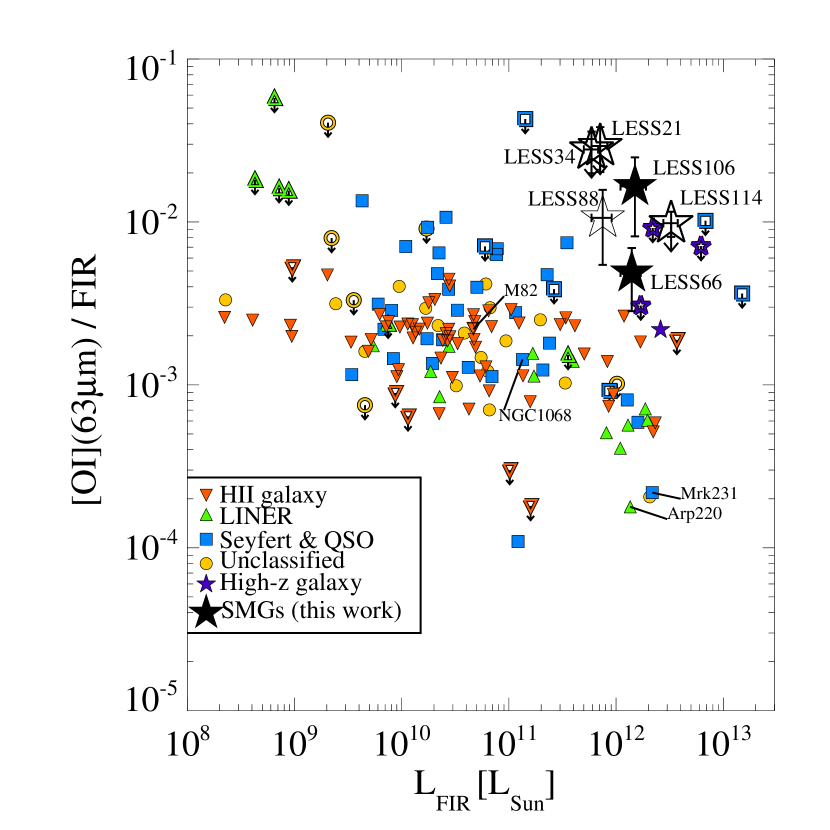
It has been an important objective of recent studies to measure the strength of the major dense ISM cooling emission lines relative to the total FIR emission. Here we investigate this for the important [OI]63 m fine structure line, which along with [OI]146 m and [CII]158 m, is a major coolant in the transition layers between the molecular and atomic gas in so called PDRs. The [OI]63 m emission line has been relatively unexplored at high-redshift, but a well-known ‘deficit’ or decrease in the strength of PDR cooling lines relative to the far-IR continuum emission as a function of LFIR has been observed in local infrared-luminous galaxies (e.g. Luhman et al. 2003; Graciá-Carpio et al. 2011). Our new Herschel-PACS data can test whether this deficit extends from that seen in local (U)LIRGs to high-redshift SMGs.
The SMGs detected in [OI]63 m emission in our sample have an [OI]63 m–to–FIR ratio of 0.5–1.5 per cent. Fig. 3 shows the [OI]63 m emission line to FIR continuum ratio plotted against LFIR for the SMGs alongside all other low and high-redshift galaxy populations with measured [OI]63 m emission available from the literature. The plot reveals that our SMGs do not show an [OI]63 m deficit, which is different from what is seen in local ULIRGs (galaxies with L L⊙ in Fig. 3), the purported local analogues of SMGs. It thus appears that [OI]63 m is a reliable tracer of star formation in high-redshift SMGs. Our observations suggest that local ULIRGs and AGNs are not good analogues of typical SMGs, and that SMGs appear to be more like local normal/starburst galaxies in terms of their PDR cooling line properties relative to their far-IR emission, which we now discuss in detail.
4 Discussion
The [CII]158 m fine-structure emission line is the predominant coolant of the cold neutral medium, since the C+ ion is abundant and the 158 m emission line is relatively easy to excite ( K). In warmer and denser environments (where and cm-3), [OI]63 m becomes the dominant coolant of the interstellar gas ( K; Hollenbach & Tielens 1999). A substantial fraction of the [OI]63 m emission is believed to originate in PDRs at the interfaces between the HII regions and molecular clouds (e.g. Malhotra et al. 2001; Contursi et al. 2002), with additional contributions to the line emission originating from the diffuse neutral medium or shocks (e.g. Spinoglio & Malkan 1992; van der Werf et al. 1993). [OI]63 m is thus an ideal tracer of the warm, dense, neutral ISM, where star formation occurs.
The detection of [OI]63 m in two SMGs in our sample thus confirms the presence of a warm dense neutral ISM in these systems, and indicates that [OI]63 m is an important cooling line for SMGs. The marginal detection and the non-detections are also consistent with this picture. If [OI]63 m is the dominant cooling channel, then the [OI]63 m–to–FIR ratio can be interpreted as a proxy of the gas heating efficiency through the dust photo-electric effect for a relatively dense gas ( cm-3; Meijerink, Spaans & Israel 2007; Kaufman et al. 1999). If on the other hand [CII]158 m contributes significantly to the cooling, then we can place a lower limit to this heating efficiency. Only such dense gas can excite the [OI]63 m emission line and achieve a relatively high gas heating efficiency of %, since the dense gas helps to keep the dust grain charge low and thus the photo-electric yield high.
But what can these observations tell us about the star formation mode in SMGs, i.e. how their immense luminosities are powered? The [OI]63 m–to–FIR ratios seen in local starbursts are %, and even higher ratios are seen in more ‘normal’ star formation driven galaxies (Lord et al. 1995; Malhotra et al. 2001; Graciá-Carpio et al. 2011). As mentioned above, local ULIRGs tend to show an overall ‘deficit’ in this ratio (and also for other important PDR emission lines; e.g. Graciá-Carpio et al. 2011) relative to their less extreme counterparts (see e.g. Fig. 3). One possible cause of this observed ‘deficit’ is thought to be due to high values of the ionization parameter (ie. the number of hydrogen ionizing photons, eV, per hydrogen particle) at the surface of the clouds (e.g. Abel et al. 2005; Abel et al. 2009; Graciá-Carpio et al. 2011). The effect of increasing the ionization parameter causes a larger fraction of the UV photons to be absorbed by dust (which are re-emitted in the IR) rather than being available to ionize and excite the gas, resulting in a decreased observed [OI]63 m–to–FIR ratio. Thus, high ionization parameters are the most likely cause of the PDR line deficit seen for local (U)LIRGs (Graciá-Carpio et al., 2011), which would indicate that there are intrinsic differences in the mechanism or distribution of star formation in these galaxies (ie. more concentrated, merger-induced) relative to more ‘normal’ starburst galaxies (ie. more extended, quiescent).
The fact that we do not see this deficit in high-redshift luminous star formation dominated galaxies such as SMGs suggests that the physics dominating the [OI]63 m–to–FIR ratio must be similar to that dominating the star formation activity in ‘normal’ star-forming IR-bright galaxies, which have far-IR emission arising from an extended, cooler ‘cirrus’ component (e.g. Efstathiou & Rowan-Robinson 2003). Importantly, the SMGs lie about an order of magnitude above the [OI]63 m–to–FIR ratios of local ULIRGs and AGNs, indicating that SMGs are not simple scaled up analogues of local ULIRGs, where the star formation occurs in a compact and highly obscured nuclear region (and potentially with a significant contribution from an AGN).
Our result supports what is seen in the [CII]158 m emission line for SMGs. In a first modest-sized survey of the [CII]158 m emission line in a heterogeneous sample of 13 far-IR luminous galaxies, Stacey et al. (2010) find that the luminous high-redshift star formation dominated systems in their sample (including one gravitationally lensed and one unlensed SMG) do not show a [CII] 158 m deficit; whereas the AGN-dominated systems in their sample do. Stacey et al. (2010) and De Breuck et al. (2011) use the observed [CII]158 m–to–FIR ratio (which traces the far-UV field strength, ) and scaling arguments to constrain the scale sizes of the three SMGs to –5 kpc (Wolfire et al., 1990). Ivison et al. (2010) also report a [CII]158 m–to–FIR ratio in SMM J2135–0102 (a lensed SMG) which is consistent with the SMG being powered by starburst clumps distributed across kpc (Swinbank et al., 2010). These studies add to the growing body of evidence that high-redshift SMGs are host to extensive, galaxy-wide starbursts, in stark contrast to the relatively more confined starbursts seen in local ULIRGs (typically s pc; e.g. Iono et al. 2009). These galaxy-wide scale sizes are similar to high resolution interferometric mapping of the dense CO gas reservoirs of SMGs ( kpc; Tacconi et al. 2006, 2008; Bothwell et al. 2010; Engel et al. 2010; Hodge et al. 2012) and of the radio and submm continuum and CO(1–0) emission ( kpc up to 25 kpc; Chapman et al. 2004; Younger et al. 2008; Biggs & Ivison 2008; Biggs et al. 2010; Ivison et al. 2011).
Our new [OI]63 m measurements have provided a first step towards a census of the bright PDR lines in SMGs. We have shown that the SMGs in our sample do not show an [OI]63 m line deficit, similar to what was seen previously in [CII]158 m, suggestive that this is likely a global property for high-redshift luminous star-formation-dominated galaxies. These SMGs are thus ideal candidates for future observations of CO transitions and of the [CII]158 m emission line – which together could be used to provide a well-constrained PDR solution for the emitting gas (see e.g. Stacey et al. 2010) to solve for the density, , and the far-UV radiation field strength, , in the ISM in SMGs. Interestingly, it is predicted that [OI]63 m would become more important than [CII]158 m as the galaxy ISM heats up, which is most likely to occur during the most extreme star formation events such as in SMGs. At the earliest stages of the starburst event, the C/O ratio is predicted to evolve strongly – with [OI]63 m predicted to be stronger than [CII]158 m emission by at least a factor of (e.g. Henkel & Mauersberger 1993; Meijerink, Spaans & Israel 2007; Kaufman, Wolfire & Hollenbach 2007), since [OI]63 m traces denser gas ( cm-3) than [CII]158 m ( cm-3). Thus, in principle measuring the C/O ratio could help to indicate the evolutionary state of the star formation episodes of SMGs, using chemical evolutionary models such as those of Pipino & Matteucci (2004). These models predict that throughout the starburst episode, the C/O ratio would evolve strongly (since C enrichment occurs mainly from low–to–intermediate mass stars) and thus this ratio could be used as an effective way to ‘date’ a galaxy and its burst timescale in the early throes of star formation (e.g. Maiolino et al. 2005). Thus, a more complete set of diagnostic emission line data would begin to reveal a fuller picture of early nucleosynthesis and interstellar processes in high-redshift luminous star-forming galaxies, which is critical to our understanding of the driving mechanisms involved in these modes of star formation.
5 Conclusions
We used Herschel-PACS to target the [OI]63 m emission line in a sample of unlensed high-redshift 870 m-selected SMGs for the first time. Our sample originally consisted of nine statistically robust radio and/or mid-IR counterparts to the SMGs (providing precise positions for the SMGs) with high-quality spectroscopic redshifts. We used high-resolution interferometric ALMA 870 m continuum data to verify the reliability of our original target selection. The ALMA data have verified unambiguously that six of the SMG counterparts are bona fide submm-emitting sources; three of the SMG counterparts that were targeted here do not appear to be a source of submm emission and we have removed these from our sample.
We detect the [OI]63 m emission line in two of the SMGs, tentatively detect [OI]63 m emission in one SMG, and measure sensitive 3 upper limits to the line flux in the remaining three cases, secure in the knowledge that we have targeted the source of the submm emission and the correct redshift. The [OI]63 m detections confirm the presence of a warm dense neutral ISM in these systems and indicate that [OI]63 m is an important PDR cooling line for SMGs. We find that the [OI]63 m–to–FIR ratio in SMGs (ranging from 0.5–1.5 per cent) does not follow the well-documented PDR cooling line ‘deficit’ that has been observed for local ULIRGs and some local AGNs which are in a similar far-IR luminosity class to SMGs. This result suggests that local ULIRGs and AGNs are not good analogues of typical SMGs, and that SMGs appear to be more like ‘normal’ starburst galaxies in terms of their star formation properties. This offset in the [OI]63 m–to–FIR ratio compared to local (U)LIRGs has been noted previously for a small sample of SMGs in another classical PDR emission line, [CII]158 m, and together these results suggest that this could be a global property for all the bright PDR cooling lines for SMGs. We have taken advantage of a unique window of opportunity provided by Herschel to verify that [OI]63 m is thus a reliable tracer of star formation in high-redshift star formation dominated galaxies such as SMGs. These Herschel observations are a necessary stepping stone to future ALMA studies of [CII]158 m and CO emission in order to investigate the ISM physics of SMGs in detail.
Acknowledgments
We thank an anonymous referee for a helpful report which improved the clarity of the paper. We are sincerely grateful to Eckhard Sturm and Javier Graciá-Carpio for advice and analysis tips for the reduction of Herschel spectroscopy data for faint high-redshift lines and for kindly providing their literature compilation data points. We would also like to thank the staff at the NASA Herschel Science Centre for hosting very informative and useful data reduction workshops which played a key role in the success and completion of this programme. KEKC acknowledges support from the endowment of the Lorne Trottier Chair in Astrophysics and Cosmology at McGill, the Natural Sciences and Engineering Research Council of Canada (NSERC), and a L’Oréal Canada for Women in Science Research Excellence Fellowship, with the support of the Canadian Commission for UNESCO. WNB acknowledges the support of a NASA Herschel grant RSA 1438954 and a NASA ADP grant NNX10AC99G. JSD acknowledges the support of the European Research Council via the award of an Advanced Grant, and the support of the Royal Society via a Wolfson Research Merit Award. JEG is supported by an NSERC Banting Postdoctoral Fellowship. TRG acknowledges support from the UK Science and Technologies Facilities Council for support, as well as IDA and DARK. The Herschel spacecraft was designed, built, tested, and launched under a contract to ESA managed by the Herschel/Planck Project team by an industrial consortium under the overall responsibility of the prime contractor Thales Alenia Space (Cannes), and including Astrium (Friedrichshafen) responsible for the payload module and for system testing at spacecraft level, Thales Alenia Space (Turin) responsible for the service module, and Astrium (Toulouse) responsible for the telescope, with in excess of a hundred subcontractors. This research has made use of hipe, which is a joint development by the Herschel Science Ground Segment Consortium, consisting of ESA, the NASA Herschel Science Center, and the HIFI, PACS and SPIRE consortia.
References
- Abel et al. (2005) Abel N.P., Ferland G.J., Shaw G., van Hoof P.A.M., 2005, ApJS, 161, 65
- Abel et al. (2009) Abel N.P., Dudley C., Fischer J., Satyapal S., van Hoof P.A.M., 2009, ApJ, 701, 1147
- Agladze et al. (1994) Agladze N.I., Sievers A.J., Jones S.A., Burlitch J.M., Beckwith S.V.W., 1994, Nat, 372, 243
- Alexander et al. (2005a) Alexander D.M., Smail I., Bauer F.E., Chapman S.C., Blain A.W., Brandt W.N., Ivison R.J., 2005a, Nat, 434, 738
- Alexander et al. (2005b) Alexander D.M., Bauer F.E., Chapman S.C., Smail I., Blain A.W., Brandt W.N., Ivison R.J., 2005b, ApJ, 632, 736
- Austermann et al. (2010) Austermann J.E. et al. 2010, MNRAS, 401, 160
- Banerji et al. (2011) Banerji M., Chapman S.C., Smail I., Alaghband-Zadeh S., Swinbank A.M., Dunlop J.S., Ivison R.J., Blain A.W., 2011, MNRAS, 418, 1071
- Barger et al. (1998) Barger A.J., Cowie L.L., Sanders D.B., Fulton E., Taniguchi Y., Sato Y., Kawara K., Okuda H., 1998, Nat, 394, 248
- Biggs & Ivison (2008) Biggs A.D., Ivison R.J., 2008, MNRAS, 385, 893
- Biggs et al. (2010) Biggs A.D., Younger J.D., Ivison R.J., 2010, MNRAS, 408, 342
- Biggs et al. (2011) Biggs A.D. et al., 2011, MNRAS, 413, 2314
- Blain, Barnard & Chapman (2003) Blain A.W., Barnard V.E., Chapman S.C., 2003, MNRAS, 338, 733
- Bothwell et al. (2010) Bothwell M.S. et al., 2010, MNRAS, 405, 219
- Bothwell et al. (2012) Bothwell M.S. et al., 2012, MNRAS submitted, preprint (arXiv:1205.1511)
- Brauher, Dale & Helou (2008) Brauher J.R., Dale D.A., Helou G., 2008, ApJS, 178, 280
- Chapman et al. (2004) Chapman S.C., Smail I., Windhorst R., Muxlow T., Ivison R.J., 2004, ApJ, 611, 732
- Chapman et al. (2005) Chapman S.C., Blain A.W., Smail, I., Ivison R.J., 2005, ApJ, 622, 772
- Colbert et al. (1999) Colbert J.W. et al., 1999, ApJ, 511, 721
- Contursi et al. (2002) Contursi A. et al. 2002, AJ, 124, 751
- Coppin et al. (2006) Coppin K. et al., 2006, MNRAS, 372, 1621
- Coppin et al. (2008) Coppin K. et al., 2008, MNRAS, 384, 1597
- Coppin et al. (2010) Coppin K. et al., 2010, ApJ, 713, 503
- Cowie et al. (2009) Cowie L.L., Barger A.J., Wang W.-H., Williams J.P., 2009, ApJ, 697, L122
- Crawford et al. (1985) Crawford M.K., Genzel R., Townes C.H., Watson D.M., 1985, ApJ, 291, 755
- Dale et al. (2001) Dale D.A., Helou G., Contursi A., Silbermann N.A., Kolhatkar S., 2001, ApJ, 549, 215
- Dale & Helou (2002) Dale D.A., Helou G., 2002, ApJ, 576, 159
- Dale et al. (2004) Dale D.A., Helou G., Brauher J.R., Cutri R.M., Malhotra S., Beichman C.A, 2004, ApJ, 604, 565
- Damen et al. (2011) Damen M. et al., 2011, ApJ, 727, 1
- De Breuck et al. (2011) De Breuck C., Maiolino R., Caselli P., Coppin K., Hailey-Dunsheath S., Nagao T., 2011, A&A, 530, L8
- Decarli et al. (2012) Decarli R. et al., 2012, ApJ in press, preprint (arXiv:1203.6852)
- Dunne & Eales (2001) Dunne L., Eales S.A., 2001, MNRAS, 327, 697
- Eales et al. (2009) Eales S. et al., 2009, ApJ, 707, 1779
- Eales et al. (2010) Eales S.A. et al., 2010, A&A, 518, L23
- Efstathiou & Rowan-Robinson (2003) Efstathiou A., Rowan-Robinson M., 2003, MNRAS, 343, 322
- Engel et al. (2010) Engel H. et al., 2010, ApJ, 724, 233
- Fazio et al. (2004) Fazio G.G. et al., 2004, ApJS, 154, 10
- Fischer et al. (2010) Fischer J. et al., 2010, A&A, 518, L41
- Graciá-Carpio et al. (2011) Graciá-Carpio J. et al., 2011, ApJ, 728, L7
- Greve et al. (2005) Greve T.R. et al., 2005, MNRAS, 359, 1165
- Griffin et al. (2010) Griffin M.J. et al., 2010, A&A, 518, L3
- Hailey-Dunsheath (2009) Hailey-Dunsheath S., 2009, PhD thesis, Cornell Univ.
- Hatsukade et al. (2010) Hatsukade et al. 2010, ApJ, 711, 974
- Helou et al. (1988) Helou G., Khan I.R., Malek L., Boehmer L., 1988, ApJS, 68, 151
- Henkel & Mauersberger (1993) Henkel C., Mauersberger R., 1993, A&A, 274, 730
- HerMES Collaboration et al. (2012) HerMES Collaboration et al., 2012, MNRAS in press, preprint (arXiv:1203.2562)
- Hildebrand (1983) Hildebrand R.H., 1983, QJRAS, 24, 267
- Hodge et al. (2012) Hodge J.A., Carilli C.C., Walter F., de Blok W.J.G., Riechers D., Daddi E., 2012, To appear in the Conference Proceedings for “Galaxy Mergers in an Evolving Universe”, held in Hualien, Taiwan, preprint (arXiv:1112.3480)
- Hollenbach & Tielens (1999) Hollenbach D. J., Tielens A.G.G.M., 1999, Rev. Mod. Phys., 71, 173
- Hughes et al. (1998) Hughes D.H. et al., 1998, Nat, 394, 241
- Iono et al. (2009) Iono D., et al., 2009, ApJ, 695, 1537
- Ivison et al. (2002) Ivison R. J. et al., 2002, MNRAS, 337, 1
- Ivison et al. (2007) Ivison R. J. et al., 2007, MNRAS, 380, 199
- Ivison et al. (2010) Ivison R.J. et al., 2010, A&A, 518, L35
- Ivison et al. (2011) Ivison R.J., Papadopoulos P.P., Smail I., Greve T.R., Thomson A.P., Xilouris E.M., Chapman S.C., 2011, MNRAS, 412, 1913
- Kaufman et al. (1999) Kaufman M.J., Wolfire M.G., Hollenbach D.J., Luhman M.L., 1999, ApJ, 527, 795
- Kaufman, Wolfire & Hollenbach (2007) Kaufman M.J., Wolfire M.G., Hollenbach D.J., 2007, in Baker A.J., Glenn J., Harris A.I., Magnum J.G., Yun M.S., eds, ASP Conf. Ser. Vol. 375, From Z-Machines to ALMA: (Sub)Millimeter Spectroscopy of Galaxies. Astron. Soc. Pac., San Francisco, p. 43
- Kennicutt (1998) Kennicutt R.C. Jr., 1998, ARA&A, 36, 189
- Kovács et al. (2006) Kovács A., Chapman S.C., Dowell C.D., Blain A.W., Ivison R.J., Smail I., Phillips T.G., 2006, ApJ, 650, 592
- Lehmer et al. (2005) Lehmer B.D. et al., 2005, ApJS, 161, 21
- Lilly et al. (1999) Lilly S.J., Eales S.A., Gear W.K.P., Hammer F., Le Fèvre O., Crampton D., Bond J.R., Dunne L., 1999, ApJ, 518, 641
- Lord et al. (1995) Lord S. D. et al., 1995, in Haas R.A., Davidson J.A., Erickson E.F., eds, ASP Conf. Ser. Vol. 73, Airborne Astronomy Symposium on the Galactic Ecosystem: From Gas to Stars to Dust. Astron. Soc. Pac., San Francisco, p. 151
- Luhman et al. (1998) Luhman M.L. et al., 1998, ApJ, 504, L11
- Luhman et al. (2003) Luhman M.L., Satyapal S., Fischer J., Wolfire M.G., Sturm E., Dudley C.C., Lutz D., Genzel R., 2003, ApJ, 594, 758
- Magnelli et al. (2012) Magnelli B. et al., 2012, A&A, 539, 155
- Maiolino et al. (2005) Maiolino R. et al., 2005, A&A, 440, L51
- Maiolino et al. (2009) Maiolino R., Caselli P., Nagao T., Walmsley M., De Breuck C., Meneghetti M., 2009, A&A, 500, L1
- Malhotra et al. (2001) Malhotra S. et al., 2001, ApJ, 561, 766
- Markwardt (2009) Markwardt C.B., 2009, in Bohlender D., Dowler P., Durand D., eds, ASP Conf. Ser. Vol. 411, Astronomical Data Analysis Software and Systems XVIII. Astron. Soc. Pac., San Francisco, p. 251
- Marsden et al. (2009) Marsden G. et al., 2009, ApJ, 707, 1729
- Meijerink & Spaans (2005) Meijerink R., Spaans M., 2005, A&A, 436, 397
- Meijerink, Spaans & Israel (2007) Meijerink R., Spaans M., Israel F.P., 2007, A&A, 461, 793
- Menéndez-Delmestre et al. (2009) Menéndez-Delmestre K. et al., 2009, ApJ, 699, 667
- Negishi et al. (2001) Negishi T., Onaku T., Chan K.-W., Roellig T.L., 2001, A&A, 375, 566
- Nguyen et al. (2010) Nguyen H.T. et al., 2010, A&A, 518, L5
- Oliver et al. (2010) Oliver S., et al., 2010, MNRAS, 405, 2279
- Ott (2010) Ott S., 2010, in Mizumoto Y., Morita K.-I., Ohishi M., eds, ASP Conf. Ser. Vol. 434, Astronomical Data Analysis Software and Systems XIX. Astron. Soc. Pac., San Francisco, p. 139
- Pascale et al. (2009) Pascale E. et al., 2009, ApJ, 707, 1740
- Pilbratt et al. (2010) Pilbratt G.L. et al. 2010, A&A, 518, L1
- Pipino & Matteucci (2004) Pipino A., Matteucci F., 2004, MNRAS, 347, 968
- Poglitsch et al. (1995) Poglitsch A., Krabbe A., Madden S.C., Nikola T., Geis N., Johansson L.E.B., Stacey G.J., Sternberg A., 1995, ApJ, 454, 293
- Poglitsch et al. (2010) Poglitsch A. et al. 2010, A&A, 518, L2
- Pope et al. (2008) Pope A. et al. 2008, ApJ, 675, 1171
- Salpeter (1955) Salpeter E.E., 1955, ApJ, 121, 161
- Sanders & Mirabel (1996) Sanders D.B., Mirabel I.F., 1996, ARA&A, 34, 749
- Silverman et al. (2010) Silverman J.D. et al., 2010, ApJS, 191, 124
- Siringo et al. (2009) Siringo G. et al., 2009, A&A, 497, 945
- Smail, Ivison & Blain (1997) Smail I., Ivison R.J., Blain A.W., 1997, ApJ, 490, L5
- Spergel et al. (2003) Spergel D.N. et al., 2003, ApJS, 148, 175
- Spinoglio & Malkan (1992) Spinoglio L., Malkan M.A., 1992, ApJ, 399, 504
- Stacey et al. (1991) Stacey G.J., Geis N., Genzel R., Lugten J.B., Poglitsch A., Sternberg A., Townes C.H., 1991, ApJ, 373, 423
- Stacey et al. (2007) Stacey G.J. et al., in 2007, in Baker A.J., Glenn J., Harris A.I., Magnum J.G., Yun M.S., eds, ASP Conf. Ser. Vol. 375, From Z-Machines to ALMA: (Sub)Millimeter Spectroscopy of Galaxies. Astron. Soc. Pac., San Francisco, p. 52
- Stacey et al. (2010) Stacey G.J., Hailey-Dunsheath S., Ferkinhoff C., Nikola T., Parshley S.C., Benford D.J., Staguhn J.G., Fiolet N., 2010, ApJ, 724, 957
- Steidel et al. (2010) Steidel C.C., Erb D.K., Shapley A.E., Pettini M., Reddy N., Bogosavljević M., Rudie G.C., Rakic O., 2010, ApJ, 717, 289
- Sturm et al. (2010) Sturm E. et al., 2010, A&A, 518, L36
- Swinbank et al. (2010) Swinbank A.M. et al., 2010, Nat, 464, 733
- Tacconi et al. (2006) Tacconi L.J. et al., 2006, ApJ, 640, 228
- Tacconi et al. (2008) Tacconi L.J. et al., 2008, ApJ, 680, 246
- Tielens & Hollenbach (1985) Tielens A.G.G.M., Hollenbach D., 1985, ApJ, 291, 722
- Valtchanov et al. (2011) Valtchanov I. et al., 2011, MNRAS, 415, 3473
- van der Werf et al. (1993) van der Werf P.P., Genzel R., Krabbe A., Blietz M., Lutz D., Drapatz S., Ward M.J., Forbes D.A., 1993, ApJ, 405, 522
- Vanzella et al. (2005) Vanzella E. et al., 2005, A&A, 434, 53
- Wall & Jenkins (2003) Wall J.V., Jenkins C.R., 2003, Practical Statistics for Astronomers. Cambridge Univ. Press, Cambridge
- Wang et al. (2011) Wang W.-H., Cowie L.L., Barger A.J., Williams J.P., 2011, ApJ, 726, L18
- Wardlow et al. (2011) Wardlow J.L. et al., 2011, MNRAS, 415, 1479
- Weiß et al. (2009) Weiß et al., 2009, ApJ, 707, 1201
- Wolfire et al. (1990) Wolfire M.G., Tielens A.G.G.M., Hollenbach D., 1990, ApJ, 358, 116
- Wolfire et al. (2003) Wolfire M.G., McKee C.F., Hollenback D., Tielens A.G.G.M., 2003, ApJ, 587, 278
- Xue et al. (2011) Xue Y.Q. et al., 2011, ApJS, 195, 10
- Younger et al. (2008) Younger J.D. et al., 2008, ApJ, 688, 59