Measurement of the strong coupling in -annihilation
using the three-jet rate
Abstract
We present a measurement of the strong coupling using data collected with the JADE detector
at centre-of-mass energies between 14 and 44 GeV. The three-jet rate as a function
of the transition parameter is determined using the Durham jet algorithm and the
distribution is compared to QCD predictions. Recent theoretical calculations predict the
three-jet rate at next-to-next-to-leading order. For the first time a measurement of is
presented using QCD predictions at next-to-next-to-leading order matched to predictions at next-to-leading
logarithmic approximation, with subleading terms being included as well. We obtain
,
being consistent with the world average value of .
keywords:
QCD , strong coupling , three-jet rate , NNLO , NLLA1 Introduction
The strong coupling is one of the fundamental parameters of the Standard Model of particle physics. Several possibilities exist to determine this parameter, one method being presented in this paper. In -annihilation with quarks in the final state hard gluons can be emitted from the quark with the emission probability being proportional to the strong coupling . Events with a hard gluon are identified by observing at least three particle jets in the detector. The theory of strong interaction, Quantum Chromo Dynamics (QCD), allows to predict the rate of three-jet events as a function of a single parameter, the strong coupling . Recent theoretical improvements [1, 2, 3, 4] allow to calculate the three-jet rate at next-to-next-to-leading-oder (NNLO) and a first measurement with data collected by the ALEPH detector at 91 GeV using the three-jet rate at a single resolution parameter was published [5].
In this paper we present the measurement of using data collected with the JADE detector between the years 1979 and 1986. For the first time NNLO predictions are matched with next-to-leading logarithmic approximations (NLLA), including subleading soft logarithms, to measure with the three-jet rate. The complete description of the analysis can be found in [6].
2 The three-jet rate determined with the Durham clustering scheme
In order to count the number of jets in the final state the reconstructed particle tracks and neutral clusters have to be clustered to jets. Several clustering schemes are available and we use the Durham clustering algorithm [7]. The number of jets depends on the resolution parameter , a measure indicating the separation between the second and the third reconstructed jet. The fixed order prediction of the three-jet rate determined with the Durham clustering scheme is matched to NLLA predictions using the -matching scheme. Parts of the subleading soft logarithms, which are not included in the NLLA calculations, can be systematically controlled and included by adding a renormalisation scheme dependent -term [8]. Including the -term significantly improves the description of the data. QCD predictions of the three-jet rate, without the expected contribution from hadronisation effects, are shown in Fig. 1.

3 The JADE Detector, Data and Monte Carlo sample
The JADE detector collected data in -annihilation at the PETRA accelerator at DESY between 1979 and 1986. We use data taken at 14 GeV, 22 GeV, 34.6 GeV, 35 GeV, 38.3 GeV and 43.8 GeV, adding up to a total integrated luminosity of about 195 . The number of selected hadronic events ranges between about 1000 events at 14 GeV and 20000 events at 35 GeV. The selection of hadronic events is based on the event multiplicity, momentum imbalance and on the total visible energy. The events are corrected for acceptance effects and the QCD predictions for the hadronisation of partons to hadrons. For these correction procedures Monte Carlo (MC) samples generated with PYTHIA, HERWIG or ARIADNE are used, with the generators being tuned to events taken with the OPAL detector at LEP at a centre-of-mass energy of 91 GeV. The expected contribution from -events, as predicted by simulation, is subtracted from the observed three-jet rate. The excellent description of the three-jet event rate by simulation is visualised in Fig. 2.

4 Measurement of the strong coupling
The measured and corrected three-jet rate together with the matched NNLO+NLLA+K QCD predictions is used to determine the strong coupling . A -value, obtained from the difference between the measured three-jet rate and the QCD predictions, is calculated and minimised. The QCD predictions are applied with the renormalisation scale factor set to the natural choice =1. Events simulated with the PYTHIA event generator are used to correct the predicted three-jet rate for hadronisation effects. The fit range is determined by requiring the correction from hadronisation and detector effects to be small. In addition the leading log contribution in the QCD prediction is required to be well below unity. The correlations between the different bins are determined using MC events. The result obtained at a centre-of-mass energy of 35 GeV from the fit to the three-jet rate is shown together with the three-jet rate distribution in Fig. 3.

4.1 Systematic Uncertainties
Several sources of systematic uncertainties are considered for the measurement of the strong coupling . The fit is repeated and the difference between the variation and the default analysis is taken as the symmetric systematic uncertainty. The different sources of systematic uncertainties are arranged in three categories:
-
1.
Experimental uncertainties: The fit is repeated with a somewhat modified event selection, different reconstruction software, different correction for detector effects or a slight variation of the fit range. The systematic uncertainties are evaluated applying these variations and added in quadrature. The main contribution comes from using different detector correction procedures and using different reconstruction software.
-
2.
Hadronisation uncertainties: Different MC models are applied to adjust the QCD predictions for hadronisation effects. The largest systematic uncertainty comes from evaluating the hadronisation correction with the HERWIG event generator instead of the PYTHIA event generator, as used in the default method.
-
3.
Theoretical uncertainties: In the default fit the renormalisation scale parameter = is set to the natural choise =1. As a systematic variation is set to 0.5 and 2 and the larger difference to the default fit is taken as the theoretical systematic uncertainty.
4.2 Results
The measurement of is performed at each energy point separately and the final result is obtained by combining the results of at the various centre-of-mass energies. Due to large hadronisation corrections the result from the fit to the data taken at 14 GeV is not included in the combination. The combined value for evolved to the energy is , consistent with the world average value of [9]. The measurements of at the various energy points is shown in Fig. 4. The evolution of measured with the three-jet rate as a function of the centre-of-mass energy is consistent with the expectation from QCD.

4.3 Study of the renormalisation scale dependence
Besides fixing the renormalisation scale to the natural choice the fit is repeated with and being free in the fit. The renormalisation scale obtained by the fit is consistently below unity, but with large statistical uncertainties and being consistent with one. The large uncertainty can be understood by looking in more detail to the variation of with respect to . The change in is rather flat, leading to small theoretical uncertainties and to large statistical uncertainties for the renormalisation scale . The results obtained from the various energy points are combined to a single value, leading to , again being consistent with the world average value.
4.4 Measurement of using fixed order predictions
The fit is repeated with fixed order predictions only and being set to one or leaving as free parameter in the fit. For the fit with being set to the natural choice the is considerably worse than the one obtained with matched QCD predictions (almost a factor four in the for the fit to the data collected at 35 GeV). This points to missing higher order terms in the QCD prediction. In addition the fit result also shows an increased sensitivity to the fit range. Using matched NNLO+NLLA+K QCD predictions the dependency on the fit range is almost negligible, while for NNLO predictions the choice of the lower value in the fit range has a significant impact on the result.
Leaving as well as free in the fit leads to a significantly improved description of the fit with values similar to the one obtained from the fit with matched QCD predictions. However, the value obtained for the scale is rather low (around 0.2) and within the statistical uncertainty inconsistent with being one. The uncertainty on the fitted scale parameter is about one order of magnitude smaller than the uncertainty on the scale parameter obtained with matched predictions. This indicates that the sensitivity of with respect to the renormalisation scale is increased compared to the fit with matched QCD predictions.
5 Conclusions
We present the first measurement of determined with the Durham three-jet rate using matched NNLO+NLLA+K QCD predictions. For this measurement hadronic events from -annihilation taken at centre-of-mass energies between 14 and 44 GeV are used. The result is consistent with the world average value. The largest uncertainty originates from modeling the transition from parton level, as predicted from the perturbative QCD calculations, to the hadron level, as observed by the experiment. The increased precision of perturbative QCD predictions, together with large hadronic event samples, will allow to scrutinize MC generators modeling the transition from partons to hadrons. A measurements of using fixed order predictions only cannot describe the data satisfactorily. A fit leaving as well as free returns a good description of the data, but the fitted value of is inconsistent with one.
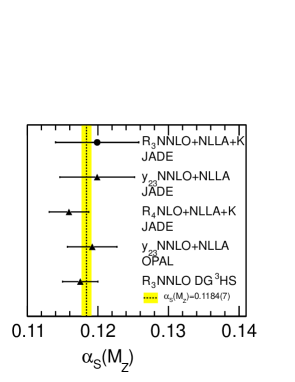
Fig. 5 summarizes the result obtained here to previous analyses using jet rates and differential jet rates. The value obtained for using a fit to the distribution returns the almost identical result for as measured with this analysis. The measurements obtained at higher centre-of-mass energies return smaller uncertainties, since the size of the hadronisation correction decreases with increasing centre-of-mass energy. The measurement of using the four-jet rate and data taken between 14 and 44 GeV returns a smaller hadronisation uncertainty, leading to a decreased overall uncertainty.
Acknowledgements
This research was supported by the DFG cluster of excellence ”Origin and Structure of the Universe” (www.universe-cluster.de).
References
- [1] A. Gehrmann-De Ridder, T. Gehrmann, E. W. N. Glover and G. Heinrich, JHEP 11, 058 (2007).
- [2] A. Gehrmann-De Ridder, T. Gehrmann, E. W. N. Glover and G. Heinrich, JHEP 12, 094 (2007).
- [3] A. Gehrmann-De Ridder, T. Gehrmann, E. W. N. Glover and G. Heinrich, Phys. Rev. Lett. 100, 172001 (2008).
- [4] S. Weinzierl, Phys. Rev. Lett. 101, 162001 (2008).
- [5] G. Dissertori et al., Phys. Rev. Lett. 104, 072002 (2010).
- [6] J. Schieck, S. Bethke, S. Kluth, C. Pahl and Z. Trocsanyi, arXiv:1205.3714 [hep-ex].
- [7] S. Catani et al., Phys. Lett. B269, 432 (1991).
- [8] Z. Nagy and Z. Trocsanyi, Nucl.Phys.Proc.Suppl. 74, 44 (1999).
- [9] S. Bethke, Eur. Phys. J. C64, 689 (2009).
- [10] S. Bethke, S. Kluth, C. Pahl and J. Schieck, Eur. Phys. J. C64, 351 (2009).
- [11] J. Schieck et al., Eur. Phys. J. C48, 3 (2006).
- [12] G. Abbiendi et al., Eur.Phys.J. C71, 1733 (2011).