Spitzer observations of young red quasars
Abstract
We present mid-infrared spectra and photometry of thirteen redshift dust-reddened quasars obtained with Spitzer IRS and MIPS. We compare properties derived from their infrared spectral energy distributions (intrinsic AGN luminosity and far-infrared luminosity from star formation) to the host luminosities and morphologies from HST imaging, and black hole masses estimated from optical and/or near-infrared spectroscopy. Our results are broadly consistent with models in which most dust reddened quasars are an intermediate phase between a merger-driven starburst triggering a completely obscured AGN, and a normal, unreddened quasar. We find that many of our objects have high accretion rates, close to the Eddington limit. These objects tend to fall below the black hole mass – bulge luminosity relation as defined by local galaxies, whereas most of our low accretion rate objects are slightly above the local relation, as typical for normal quasars at these redshifts. Our observations are therefore most readily interpreted in a scenario in which galaxy stellar mass growth occurs first by about a factor of three in each merger/starburst event, followed sometime later by black hole growth by a similar amount. We do not, however, see any direct evidence for quasar feedback affecting star formation in our objects, for example in the form of a relationship between accretion rate and star formation. Five of our objects, however, do show evidence for outflows in the [O III]5007Å emission line profile, suggesting that the quasar activity is driving thermal winds in at least some members of our sample.
Subject headings:
Quasars: general — infrared: galaxies — galaxies: starburst — galaxies: evolution1. Introduction
The study of quasars across cosmic time has proven to be important as their evolution and growth is intimately linked to that of their host galaxy. Mergers have long been invoked as the primary ignition mechanism of quasar activity, at least for the high luminosity objects (Sanders & Mirabel, 1996; Urrutia et al., 2008; Bennert et al., 2008). The loss of angular momentum during a gas rich merger allows the gas to be funneled to the center igniting a starburst and fueling the central black hole. In this model, eventually the quasar grows strong enough and develops a feedback mechanism that expels the obscuring material and shuts off star formation (Silk & Rees, 1998; Hopkins et al., 2008). This scenario is further supported by the existence of tight correlations between the properties of galaxy bulges and their central black holes (Magorrian et al., 1998; Ferrarese & Merritt, 2000).
Putting the picture together observationally is challenging, however. Populations of quasars selected via different techniques, although overlapping, differ substantially in their detailed properties and may bias towards a particular type of quasar or evolutionary phase e.g. AGN selected in the infrared may belong to different class or evolutionary phase than AGN selected in the radio or optical regime (Hickox et al., 2009). In an ideal survey we would be able to select quasars at specific points in their lifetimes. For example, to test a starburst-AGN connection we would prefer to select young, recently ignited objects to see if there is still star formation occurring in the host galaxies, and to identify likely feedback mechanisms.
One approach to finding candidates for young quasars is to search for dust obscured quasars that may correspond to objects yet to fully clear out the dust and gas surrounding them. Conventionally, obscured quasars are divided into two classes: (1) the so-called type-2 quasars - objects showing only narrow emission lines with large inferred extinctions () towards the nucleus, most likely caused by a torus surrounding the accretion disk as required in the AGN “unification by orientation” model (e.g., Antonucci et al., 1993; Urry & Padovani, 1995) and (2) moderately reddened quasars (), which still show broad emission lines in the rest-frame optical, and whose continuum is still dominated by the quasar rather than the host galaxy. These latter objects are obscured by a cold absorber along the line of sight to the quasar, most likely in the host galaxy. They may thus represent the young objects in the final stages of emerging from their dusty cocoons. Throughout this paper the terms red, dust-obscured and moderately reddened quasars all refer to the latter category of objects.
Dust obscured quasars of all types are missing from, or are severely underrepresented in optical surveys, but are present in the radio (e.g., White et al., 2003), in the X-ray (e.g., Hickox et al., 2007), when selected on the basis of narrow optical AGN emission lines (Zakamska et al., 2003), or when selected in the near-infrared (Cutri et al., 2001). Mid-infrared surveys (e.g., Lacy et al., 2004, 2007a; Stern et al., 2005; Alonso-Herrero et al., 2006; Donley et al., 2007) have also been extremely successful at finding and identifying obscured quasars over a wide range of reddenings, redshifts, and luminosities. Surveys combining deep radio and mid-infrared data show that the optically- and/or X-ray-selected quasar population constitutes less than half of the total population of quasars (Donley et al., 2005; Martínez-Sansigre et al., 2005). Joint selection using radio and near-infrared, as used for the sample in this paper, has proven to be one of the most reliable ways to select the moderately obscured quasar population. The requirement of a bright radio source and very red optical through near-infrared colors results in a set of candidates with relatively little contamination from normal galaxies, low luminosity AGN and stars (Gregg et al., 2002; Lacy et al., 2002; Glikman et al., 2004, 2007, 2012; Urrutia et al., 2009).
The success of the Spitzer Space Telescope (Werner et al., 2003) has allowed for the detailed study of quasars in the mid-infrared. Programs with the Infrared Spectrograph (IRS; Houck et al., 2004), in particular, have refined our knowledge of QSO spectral energy distributions (SEDs) in the mid-infrared. For example, the detection of silicate in emission in IRS spectra of quasars is a strong support for the unification model (Hao et al., 2005; Siebenmorgen et al., 2005). Average properties of classes of objects using IRS spectra (e.g, Spoon et al., 2007) have allowed us to constrain the physical properties of dust in AGN (e.g., Nikutta et al., 2009). On average the spectra of luminous quasars are flat, show little or no PAH emission and the silicate features are in emission, associated with dust re-emission. In contrast, the spectra of Ultraluminous Infrared Galaxies (ULIRGs) show a steep rise towards the long wavelengths, moderate PAH emission and silicate absorption troughs associated with embedded star formation (Hao et al., 2007). However, some type 2 and some reddened quasars at moderate to high redshifts show deep silicate absorption features (Lacy et al., 2007b; Martínez-Sansigre et al., 2008; Zakamska et al., 2008) in contrast to samples of X-ray selected Type-2 quasars, in which they are generally weak (Sturm et al, 2006).
The Multiband Imaging Photometer for SIRTF (MIPS; Rieke et al., 2004) on board Spitzer has also allowed us to sample the colder part of the galaxy SED. While AGN dominate the bright 24m population (Donley et al., 2008), the Spitzer 70m field population is dominated by ULIRGs which have a high merger fraction (Kartaltepe et al., 2010a, b). However, AGN and quasars still make up a significant fraction of 70m sources, and high star formation rates in quasar hosts are common (e.g. Schweitzer et al., 2006; Netzer et al., 2007). Consistent with those results Shi et al. (2009) find that Type-1 quasars show star formation rates higher than the field galaxies, with luminosities typical of Luminous Infrared Galaxies (LIRGs, ). In particular, dust reddened quasars have been found to have higher than usual 60/12m luminosity ratios, an indicator of higher star formation rates (Georgakakis et al., 2009).
In this paper we will describe Spitzer IRS and MIPS observations of 13 redshift reddened quasars selected using joint radio and near-infrared selection for which we have also obtained Hubble Space Telescope (HST) observations (Urrutia et al., 2008). We use these observations to estimate the intrinsic luminosities of the quasars, and to estimate or constrain the star formation rates in the host galaxies. We then evaluate the evidence that this population corresponds to an intermediate stage in quasar evolution by estimating black hole masses and accretion rates, comparing our HST host galaxy luminosities and morphologies to the other properties, and by searching for evidence of feedback processes at work in the hosts. Throughout this paper we adopt a flat Universe, = 70 km s-1 Mpc-1, cosmology.
| Source | IRS AORID | MIPS AORID | (mJy) | (mJy) | (mJy) |
|---|---|---|---|---|---|
| F2M07293336 | 22386176 | 22386432 | 12.93.0 | 15 | 30 |
| F2M08254716 | 22389760 | 22386688 | 36.14.7 | 8519 | 4611 |
| F2M08303759 | 22390016 | 22386944 | 26.13.9 | 3212 | 30 |
| F2M08343506 | 22390272 | 22387200 | 17.63.4 | 2613 | 30 |
| F2M08413604 | 22390528 | 22390528 | 11.73.0 | 5314 | 30 |
| F2M09152418 | 17540352† | 22387712 | 87.37.0 | 20724 | 7312 |
| F2M10122825 | 22390784 | 22387968 | 4.90.8 | 15 | 30 |
| F2M11131244 | 22391040 | 22388224 | 59.45.8 | 13825 | 6712 |
| F2M11180033 | 22391296 | 22388480 | 24.44.0 | 8024 | 4410 |
| F2M11515359 | 22391552 | 22388736 | 6.90.7 | 207 | 30 |
| F2M15073129 | 22391808 | 22388992 | 9.22.5 | 2211 | 30 |
| F2M15322415 | 22392064 | 22389248 | 28.44.0 | 3113 | 30 |
| F2M16563821 | 22392320 | 22389504 | 9.72.4 | 158 | 30 |
Note. — All observations made in cycle 4 (Jul 2007 - May 2008) except for F2M0915-2418, whose IRS spectrum was taken in May 2007 as part of program 30121.
2. Quasar sample and observations
In the past few years we have been selecting a sample of luminous lightly-obscured quasars using a combination of the FIRST radio survey (Becker et al., 1995), the 2MASS near infrared survey (Skrutskie et al., 2006) and the Cambridge APM scans of the POSS plates. Using a and color wedge for the matched point sources, we have been very effective in finding these so-called red quasars with spectroscopic follow up at Keck (ESI) and IRTF (Spex) (Glikman et al., 2004, 2007; Urrutia et al., 2009). Even though the survey is radio selected, most of the objects rather fall in the radio intermediate regime than radio-loud, so it is unlikely that the redness of the objects comes from a synchrotron component, but is in fact associated with dust-reddening. Furthermore, the excess of steep spectrum sources at faint radio fluxes and the point-source nature of the radio sources leads us to expect that the nature of the radio emission is due to a quasar and not from star formation (Glikman et al., 2007). As of early 2012, we have well over 120 spectroscopically confirmed red quasars found with this method (Glikman et al., 2012).
These red quasars are highly luminous and only moderately reddened ( mags), so they outshine their host galaxies in the rest-frame optical, and are thus not red due to galaxy starlight. Their spectral energy distributions (SEDs) are generally well fit by reddening a standard quasar template spectrum using an SMC dust-reddening law. It is only in the rest-frame UV, where the quasar light is heavily extinguished, that the host galaxy starts to play a role in terms of overall flux density. See Glikman et al. (2007); Urrutia et al. (2009) for in depth discussions of how reddening is estimated for these objects.
A representative sample of 13 dust-reddened quasars with were followed up with the ACS Wide Field Camera on HST with the F475W and F814W filters. These are very luminous quasars at having intrinsic absolute magnitudes in the range . The host galaxies show a high amount of interaction: 85% of the images show evidence of morphological disturbance (Urrutia et al., 2008). We also observed that the more reddened the objects were, the more disturbed their morphologies (as measured by the Gini coefficient combined with the Concentration Index (Lotz et al., 2004; Abraham et al., 2003)). These results support the merger-induced origin for high luminosity quasars.
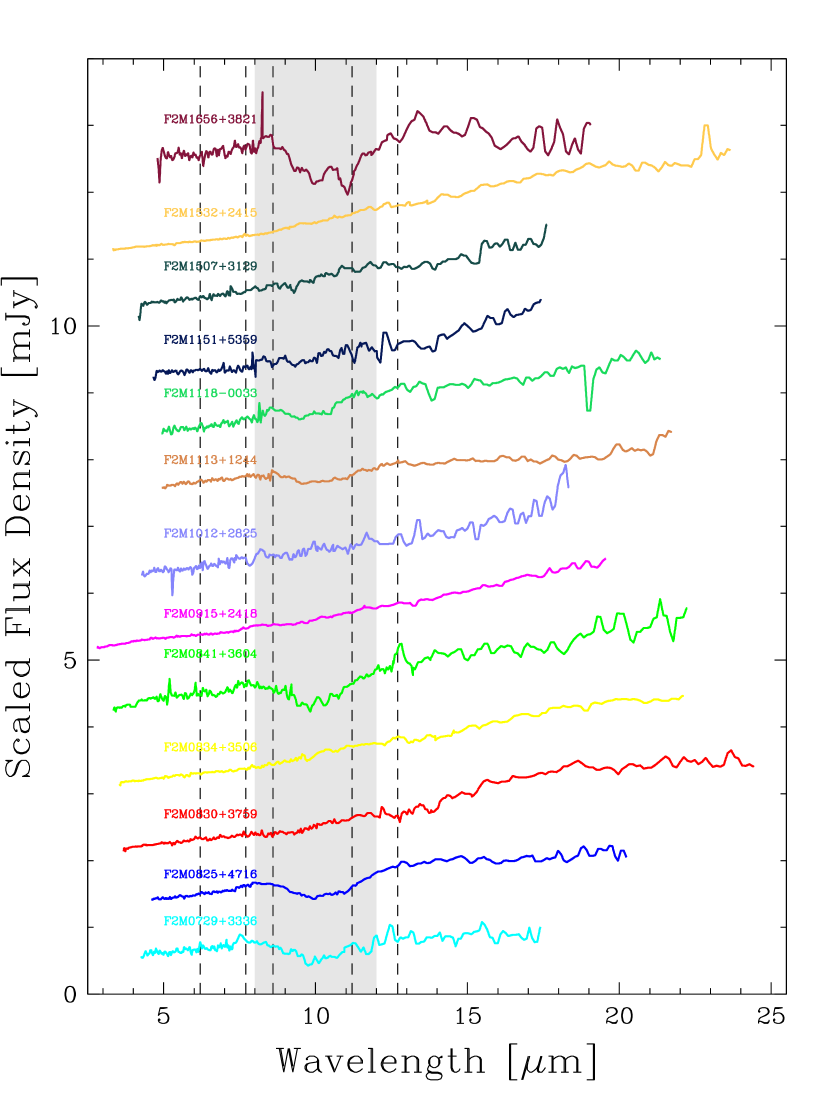
We followed up this sample of 13 red quasars with the MIPS and IRS on board the Spitzer Space Telescope (PID 40143). The IRS observations were made with the Short-Low (SL; = 5.2-14.5 µm) and Long-Low (LL; = 14.0-38.0 µm) modules of the IRS, (with some of the highest redshift objects not using the SL2 5-7.5 µm module). We also obtained MIPS 24m, 70m and 160m photometry (with the lowest redshift objects not being observed at 160 m). Table 1 provides the details for our Spitzer observations, including the IRS and MIPS AORIDs as well as the MIPS 24, 70, and 160 m fluxes.
Our infrared spectra and photometry were used for a number of purposes. We can infer star formation rates from the PAH emission in the IRS spectra and the far-infrared excesses from the MIPS photometry. The silicate feature at 9.7 m provides us with an estimate of the cold dust obscuration, and the mid-infrared continuum emission provides an estimate of the intrinsic (unreddened) quasar luminosity. Near-infrared and optical spectra of these objects are shown in Glikman et al. (2004, 2007), though we obtained an additional spectrum of FTM1507+3129, see Section 4.1.11.
3. Data Reduction and Analysis
The IRS spectra were reduced in the following manner. First we removed the
bad or hot pixels using the IDL program rsclean. The resultng spectra
were background subtracted by differencing the first and second-order
apertures. They were then extracted and flux calibrated using SPICE version
2.0.1 provided by the Spitzer Science Center. Finally, the
different orders were stitched together using a weighted average in the
overlapping orders, with no significant scaling adjustments needed in the
order-to-order jumps. A plot of the 13 different normalized spectra can be
seen in Figure 1.
We used the post-BCD products for the 24 µm MIPS images, as the quality was excellent and there was no need to re-mosaic them. For the 70 and 160 µm data we re-mosaiced the data using
OPEX  version 18.2.2 with
the default parameters. We employed two methods for the photometric
measurements: (a) The \verb APEX  package within \verb
OPEX with the default parameters and PRFs for point-source photometry and (b)
Extractor  aperture photometry with standard point-source aperture
corrections provided by the
pitzer Science Center111Using the old webpage http://ssc.spitzer.catech.edu/mips/apercorr, values can now be found in the MIPS instrument handbook at http://ssc.spitzer.caltech.edu/mips/mipsinstrumenthandbook/50/. We used 10% errors for the 70 and 160 µm sources, as
OPEX tended to
underestimate the errors.
\subsection{IRS spectral analysis}
For all the IRS spectra in our sample we measured the equivalent width
(EW) of the 6.2 \micron~PAH emission as well as the strength of the 9.7
\micron~silicate absorption feature following the methodology presented in
\cite{spoon07}. In short the PAH EW is obtained by integrating above a spline
interpolated continuum, while the silicate feature strength is inferred from
the ratio between the observed and continuum flux density:
\begin{equation}
S_{\rm Sil} = {\rm ln} \frac{f_{obs} (\mathrm{9.7 }\, \mu m)}{f_{cont}
(\mathrm{9.7 }\, \mu m)}
\end{equation}
The values are given in Table \ref{fitting} and plotted in Figure
\ref{diagnostics}. We discuss the results in the diagram in Section 4.
\begin{figure*}
\begin{center}
\hspace*{0cm}
\vspace*{0.5cm}
\includegraphics[height=2.87cm]{f3a.ps}
\includegraphics[width=2.38cm]{f3b.eps}
\hspace*{0.1cm}
\includegraphics[height=2.88cm]{f3c.ps}
\includegraphics[width=2.38cm]{f3d.eps}
\includegraphics[height=2.87cm]{f3e.ps}
\includegraphics[width=2.38cm]{f3f.eps}
\hspace*{0.1cm}
\vspace*{0.5cm}
\includegraphics[height=2.87cm]{f3g.ps}
\includegraphics[width=2.38cm]{f3h.eps}
\includegraphics[height=2.87cm]{f3i.ps}
\includegraphics[width=2.38cm]{f3j.eps}
\hspace*{0.1cm}
\vspace*{0.5cm}
\includegraphics[height=2.87cm]{f3k.ps}
\includegraphics[width=2.38cm]{f3l.eps}
\includegraphics[height=2.87cm]{f3m.ps}
\includegraphics[width=2.38cm]{f3n.eps}
\hspace*{0.1cm}
\vspace*{0.5cm}
\includegraphics[height=2.87cm]{f3o.ps}
\includegraphics[width=2.38cm]{f3p.eps}
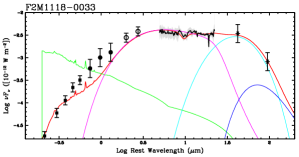
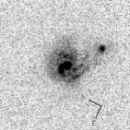
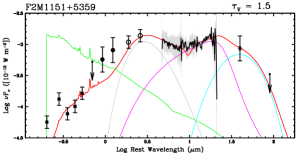
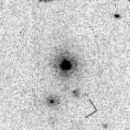
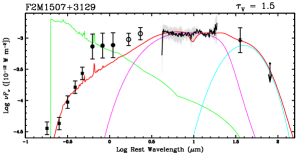
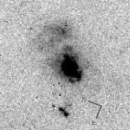
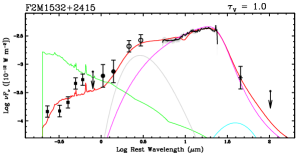
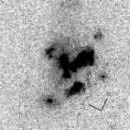
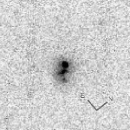
\caption{Broadband rest-frame spectral energy distributions (SEDs) of the red
quasars. The five photometry measurements from the SDSS are shown as squares,
the ones from 2ASS as filled circles, the ones from WISE Band 1+2 as open
circles and the ones from MIPS as stars (three of the low redshift quasars
were not observed at MIPS 160µm). Also shown is the IRS spectrum with a
corresponding grey error area. The fitted SEDs of the quasars are shown in
red. They are built up from a quasar component (in green) and AGN hot dust
component (pink), both of which are reddened by an SMC extinction law.
Furthermore a very hot quasar dust component (grey), a warm dust component
(cyan) and a cold dust component (blue) are added. The corresponding HST
image is shown to the right of each SED as an arcsec greyscale
image.
3.1. Multiwavelength Modeling
To obtain a complete view of the physical phenomena that are affecting the quasar, we modeled the SEDs of our sample from the optical out to the mid-infrared. We used the available -band SDSS photometry222Except for F2M07293336, which has no SDSS coverage. We obtained synthetic photometry corresponding to the SDSS filters from the optical spectrum in the optical. In addition, we used 2MASS (Skrutskie et al., 2006), WISE Band 1+2 (Wright et al., 2010), our MIPS photometry and IRS mid-IR spectra.

To model the SEDs we used a phenomenological model based on that of Sajina et al. (2006) due to the current lack of a good physical understanding of the nature and geometry of the dust emitting regions. Many of the parameters thus do not have a direct physical interpretation. Nevertheless, we considered the effort worthwhile as it allows an empirical breakdown of the contributions of starlight, hot dust emission from the AGN, and cooler dust emission from star formation. The model fits are shown in Figure 1. Full details of the model components as applied to quasars are given in Hiner et al. (2009), but are summarized below. (1) The composite quasar spectrum. As the composite of Vanden Berk et al. (2001) suffers from noticeable host galaxy contamination at the long wavelength end, we constructed a new composite by subtracting the continuum from the composite of Vanden Berk et al. (2001), and adding the residual emission line composite to a new continuum constructed using line-free optical/near-infrared SED points from the composite of Richards et al. (2006). In Figure 1 this is the green line. (2) A power-law component for the mid-infrared emission, with an exponential cutoff at short wavelengths to represent dust sublimation, and a Fermi function cutoff at long wavelengths. The functional form used was:
| (1) |
where the normalization, , power-law index and (a proxy for the sublimation temperature) are allowed to vary, and and were fixed at Hz and Hz, respectively ( and are the Planck and Boltzman constants, respectively). This component is represented by the magenta line in Figure 1. After addition, components (1) and (2) were reddened by the Galactic Center extinction curve of Chiar & Tielens (2006) to fit any silicate absorption feature. (3) A warm dust component to represent the small grain emission from Hii regions, represented by a power-law with fixed high and low frequency cutoffs:
| (2) |
this component is poorly constrained in most of the fits, so was fixed at a typical value of two (e.g. Sajina et al. (2006)). The high and low frequency cutoffs, and were set to Hz and Hz, respectively. Figure 1 shows this component in light blue. (4) a thermal greybody model for the far-infrared emission:
| (3) |
For all of the objects, we fixed the temperature of this component, , to 40K, because of the uncertainty in our 160µm photometry. was fixed at 2.0 as above (Dunne & Eales, 2001). In Figure 1 this is represented with a dark blue line. (5) Many quasars objects also required an extra near-infrared component to match the SEDs. This “very hot” component was modeled as a 1000K black body (equation 4 with ). The physical origin of this component is unclear, but it is most likely due to hot dust close to the sublimation radius (e.g., Glikman et al., 2006; Netzer et al., 2007; Mor & Trakhtenbrot, 2011). This last component can be seen in grey color in Figure 1. In addition, we tried to add a PAH model as described in Lacy et al. (2007b), however PAH emission was relatively minimal and did not improve our fits. We therefore excluded this component in the fitting process. The contribution from starlight is so small compared to the quasar and star formation components at all wavelengths except bluewards of 5000Å, so we decided to ignore the stellar contribution in our fitting process.
| Source | QSO contrib- | Starburst (FIR) | QSO / SB | E(B-V)aaDerived via spectral fitting of a quasar composite reddened by the SMC law, either from Urrutia et al. (2008) or Urrutia et al. (2009); the latter involves much more careful fitting, masking emission line regions. | E(B-V)bbDerived from the SED fitting and modeling as described in Section 3.1, the extinction () is derived from Silicate absorption, except for objects marked with a star. Note the general agreement with the Silicate depth derived via the method of Spoon et al. (2007). | cc, used as disturbance parameter. Values of G and C are from Urrutia et al. (2008), see that publication for details on how the values were obtained. D values close to 1.0 represent morphologically undisturbed systems. The higher the D value, the more disturbed the system is. | |
|---|---|---|---|---|---|---|---|
| ution (intrinsic) | contribution | Ratio | (spectrum) | (SED fit) | coefficient | ||
| (log ) | (log ) | ||||||
| F2M07293336 | 12.83 | 11.47 | 22.91 | 0.830.22 | 0.605 | -0.43 0.09 | 1.92 |
| F2M08254716 | 13.10 | 12.35 | 5.62 | 0.520.10 | 0.806 | -0.50 0.03 | 1.29 |
| F2M08303759 | 12.03 | 11.35 | 4.79 | 0.800.15 | 0.478 | 0.00 0.06 | 1.39 |
| F2M08343506 | 12.04 | 11.42 | 4.17 | 0.580.05 | 0.629 | 0.140.03 | 0.95 |
| F2M08413604 | 12.12 | 12.03 | 1.23 | 1.340.11 | 0.770 | -0.76 0.15 | 1.73 |
| F2M09152418 | 13.37 | 12.69 | 4.79 | 0.360.12 | 0.354∗ | -0.05 0.05 | 1.29 |
| F2M10122825 | 12.24 | 11.88 | 2.29 | 0.820.10 | 0.647 | 0.03 0.10 | 1.13 |
| F2M11131244 | 13.14 | 12.43 | 5.13 | 1.410.11 | 0.294 | -0.31 0.01 | 1.24 |
| F2M11180033 | 12.71 | 12.29 | 2.63 | 0.850.11 | 0.512 | -0.15 0.04 | 1.40 |
| F2M11515359 | 12.15 | 11.77 | 2.40 | 0.420.08 | 0.532∗ | -0.01 0.07 | 0.95 |
| F2M15073129 | 12.57 | 12.05 | 3.31 | 0.740.09 | 0.532∗ | -0.01 0.07 | 1.16 |
| F2M15322415 | 12.47 | 10.67 | 63.10 | 0.900.53 | 0.354∗ | -0.09 0.02 | 1.50 |
| F2M16563821 | 12.44 | 10.83 | 40.74 | 0.880.16 | 1.169 | -1.31 0.01 | 1.34 |
Most of our quasars are well-fit by this model, with relatively small values, but in some cases the fit at the near-IR regions of the spectrum described by 2MASS magnitudes provides is poor. This is most likely due to the host galaxy emission dominating the optical and/or near-infrared passbands. In the cases where the model fit the broadband SED well, the reddening values derived from the Silicate absorption feature were in general agreement to the values of derived from the SMC continuum fit to the optical spectrum (Glikman et al., 2007; Urrutia et al., 2009), confirming cold dust as the absorbing and reddening mechanism in these systems (see Table 2). However, in four cases (F2M0915+2418, F2M1151+5359, F2M1507+3129 and F2M1532+2415) there was no Silicate in absorption to account for the reddening seen in the optical and near-infrared. In those cases, we artificially fixed the extinction that would’ve been derived from the fit from the IRS spectrum manually. These objects have their modeled extinctions marked with a star in Table 2 and their fixed extinctions labeld in Figure 1. We then derived the obscured quasar luminosities by integrating over the quasar components (1)+(2); the intrinsic luminosities quoted in Table 2 are then derived by accounting for the extinction obtained from the Silicate absorption fit. Since the AGN contribution is well constrained by the IRS spectrum and optical/near-IR photometry points, the uncertainties are overall small ( dex) and only pertain to the accuracy of the Silicate absorption feature. The FIR/Starburst contribution was taken solely from the integration of the two dust bumps (light and dark blue; (3)+(4)), not from any component in the optical regime. Since that FIR contribution is largely determined by the 70 and 160 µm photometry points alone, it has the largest uncertainties in the contribution ( dex). The Starburst contribution ranges from = 10.67 – 12.67, placing the host galaxies of red quasars roughly in the LIRG regime. For the QSO contribution, we find them to have bolometric luminosities in the range of 12.03 – 13.37. These are very large values, placing these quasars among the brightest in the Universe in the IR furthermore strengthening our previous conclusion that we are only probing the tip of the quasar luminosity iceberg (Glikman et al., 2004, 2007; Urrutia et al., 2009).
3.2. Black hole masses and accretion rates
We estimated black hole masses () for the twelve of our thirteen quasars for which broad lines were visible in either the optical or near-infrared spectra (Table 3). H was our preferred line as it is relatively isolated, and most quasar black hole mass estimates are calibrated on it, but in most cases the broad H line was too heavily extinguished, so a longer wavelength line such as H or Pa was used (Pa was generally preferred as it is free of contaminating narrow lines). This assumed that the H, H and Pa lines have the same velocity widths, but was indeed the case (within the errors) for the objects in which we could measure two or more broad line widths (F2M0825+4716, H and Pa; F2M0834+3506, H and H; F2M0915+2418, H and Pa; F2M1113+1244, H, H and Pa).
| Object | Redshift | Line | FWHM | |||||
|---|---|---|---|---|---|---|---|---|
| (km s-1) | () | |||||||
| (erg s-1)aamonochromatic luminosity at 15m (rest). | (fit)bbrest-frame -band luminosity of the central component of the host galaxy as given in table 6 of Urrutia et al. (2008) (“Total” host magnitude in table 6). | (monotonic)ccrest-frame -band luminosity of the extended host galaxy (all components) (“mono” luminosity in table 6). The -band luminosities were estimated from the observed -band fluxes assuming a stellar SED flat in to perform the small k-corrections required to map observed -band to rest-frame -band. | ||||||
| F2M07293336 | 0.957 | H | 2866 200 | 45.8 | 8.70.1 | 0.10.1 | 11.06 | 10.99 |
| F2M08254716 | 0.803 | Pa | 2664 100 | 46.1 | 8.80.1 | 0.30.1 | 10.30 | 10.90 |
| F2M08303759 | 0.414 | H | 3741 200 | 45.3 | 8.60.1 | -0.40.1 | 10.97 | 11.01 |
| F2M08343506 | 0.470 | H | 105002000 | 45.2 | 9.50.1 | -1.30.1 | 10.69 | 10.65 |
| F2M08413604 | 0.553 | H | 3380 500 | 45.2 | 8.50.1 | -0.40.1 | 10.53 | 10.73 |
| F2M09152418 | 0.842 | Pa | 4186800 | 46.5 | 9.40.2 | 0.10.1 | 10.58 | 10.66 |
| F2M10122825 | 0.937 | H | 8050 1000 | 45.3 | 9.30.1 | -1.00.1 | 10.62 | 10.79 |
| F2M11131244 | 0.681 | H | 2276 300 | 46.1 | 8.60.1 | 0.40.1 | 10.91 | 10.91 |
| F2M11180033 | 0.686 | Pa | - | 45.7 | 8.7d | - | 11.01 | 11.12 |
| F2M11515359 | 0.780 | H,Pa | 5700500 | 45.4 | 9.00.1 | -0.70.1 | 10.48 | 10.88 |
| F2M15073129 | 0.988 | H | 128002000 | 45.7 | 9.90.1 | -1.3 | 10.60 | 10.96 |
| F2M15322415 | 0.562 | Pa | 117001000 | 45.6 | 9.80.1 | -1.20.1 | 10.95 | 11.09 |
| F2M16563821 | 0.732 | Pa | 3064300 | 45.4 | 8.50.1 | -0.20.1 | 10.54 | 10.67 |
Black hole mass estimates were then calculated using the broad-line widths and quasar luminosity assuming a broad line region radius, :
| (4) |
(Bentz et al., 2009) with and and estimating the intrinsic luminosity at 5500Å , by measuring the quasar luminosity at a rest-frame wavelength of 15m (where extinction should be negligible) and applying the ratio of the bolometric corrections at 5100 (12) to the correction at rest-frame 15m (9.0) from (Richards et al., 2006). The black hole mass estimate, is then given by:
| (5) |
where is the velocity dispersion of the broad line, is the gravitational constant, and we assume a geometric correction factor of . The Eddington luminosity is:
| (6) |
and Eddington ratios are estimated by dividing the intrinsic luminosity of the quasar from the fit by the Eddington luminosity.
4. Results
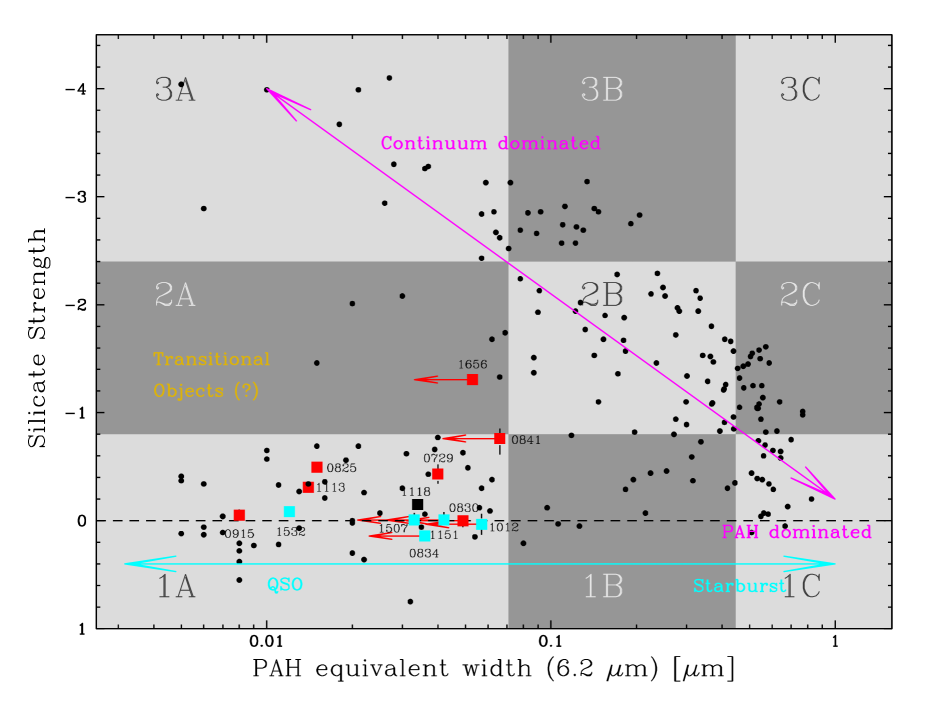
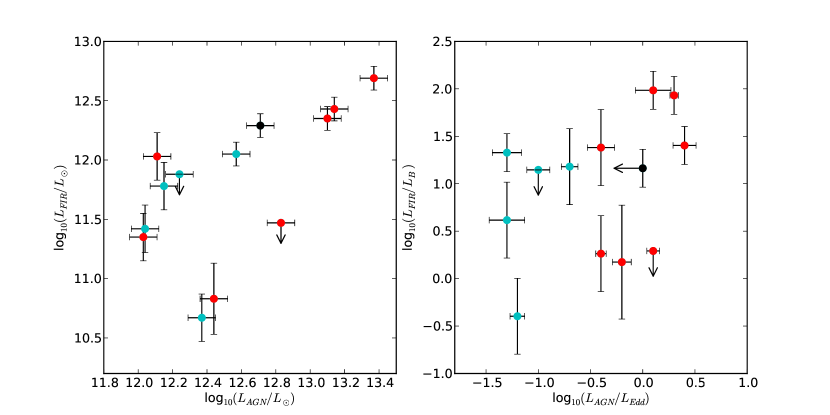
We first place our red quasars into the context of other luminous infrared galaxies using the Spoon et al. (2007) diagnostic diagram (Figure 2). This plot of silicate absorption depth versus PAH equivalent width separates the known classes of infrared-luminous galaxies into two. One sequence extends from region 1C (comprised mostly of starburst dominated objects) into 1A (comprised mostly of IR-bright quasars) as continuum replaces PAH emission in objects with little silicate emission or absorption. We plot this sequence with cyan double arrows in Figure 2. The second sequence extends from 1C through 2B through 3A in which objects again become continuum dominated, but with high silicate absorption depths (the “warm ULIRG” population), shown with magenta double arrows in Figure 2. Normal quasars are typically found in region 1A, as are the majority of our dust-reddened objects, but the fact that we see one object firmly and one barely in the the sparsely populated quadrant 2A of the diagram is noteworthy. Such objects are rare in most compilations of galaxies and AGN and are believed to be part of a transitioning population, confirming that we have indeed located an interesting class of object, perhaps intermediate between the heavily absorbed warm ULIRGs and the normal quasar population. Also, it is worth mentioning that none of the sources show silicate in emission, which is unusual for these very IR-bright quasars; it’s possible that in some of the objects (like the four we had to fix the Silicate absorption manually in the SED fitting) the silicate absortion is missing because it is being filled with an emission bump. The results of the fitting (Figure 1 and Table 2) show that the AGN component dominates the bolometric luminosity in all cases, with most of our objects having measurements or limits on their far-infrared luminosities corresponding to star formation rates of using the Kennicutt et al. (1998) conversion between far-infrared luminosity and star formation rate. Such star formation rates indicate luminous starbursts, but not at the level at which they are adding significantly to the stellar mass of the host galaxies. Next we consider the accretion luminosities of our objects. Our objects span a wide range of luminosities relative to the Eddington Limit (), including many objects with high luminosities when compared to typical quasar Eddington Ratios (e.g., Steinhardt & Elvis, 2010). This could be an artifact of partial obscuration, for example, if the inner broad line region, where the linewidths are greatest, remains somewhat obscured. However, where we are able to measure the widths of multiple broad lines in the same object, the linewidths are very similar irrespective of wavelength, making this latter possibility unlikely.
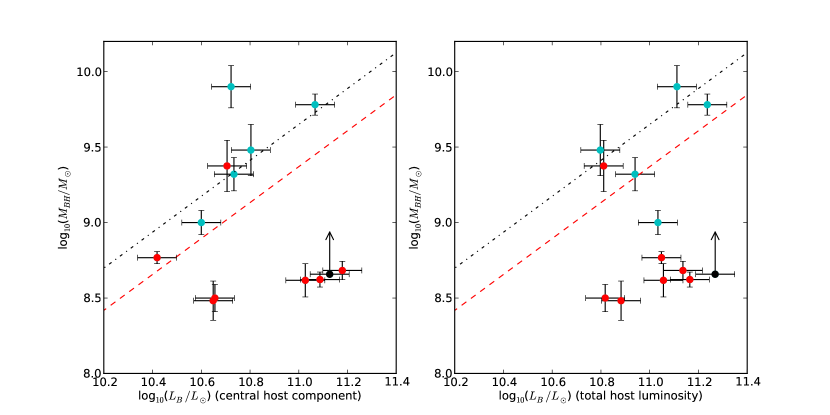
Figure 4 displays the black hole mass of our quasars versus their host luminosity, left for the central bulge component and right for the total host light. The central bulge luminosity was derived by fitting the brightest host galaxy components, while the total luminosity component included the flux in disturbed, outlying components, both after subtraction of the quasar nucleus (see Urrutia et al. (2008) for an in depth discussion on the AGN – host galaxy fitting). Objects with high accretion rates (above 0.3 Eddington) are plotted in red, objects with low rates in blue. The Figure shows that there is very little correlation between the black hole masses and the corresponding galaxy luminosities, either of the fitted central galaxy component or to the total host galaxy light. However, none of our black hole masses exceed the black hole mass – bulge luminosity relation (Marconi & Hunt, 2003) by a large factor, also when corrected for evolution according to Bennert et al. (2010), even when only the central component of a merging system (defined as the one containing the quasar nucleus) is considered. The fact that we find a significant fraction of our objects with high accretion rates below the black hole mass – bulge luminosity relation leads us to speculate that they are young, just ignited black holes. Their growth has started after the host galaxy growth via a starburst event, yet since they are accreting at such high rates they will move onto the “classical” relation within 107 years. In Figure 5 we plot both the total FIR-luminosity against the AGN luminosity, and the ratio of accretion rate to the Eddington limit of the quasar against the ratio of the far-infrared luminosity to the -band luminosity of the host galaxy (a proxy for the specific star formation rate). There is a hint of a correlation between the total FIR luminosity and AGN luminosity (as found for nearby quasars, Netzer et al., 2007), though it is not tight. There seems to be no relation between the mass-normalized quantities of specific star formation rate and accretion rate relative to the Eddington Limit.
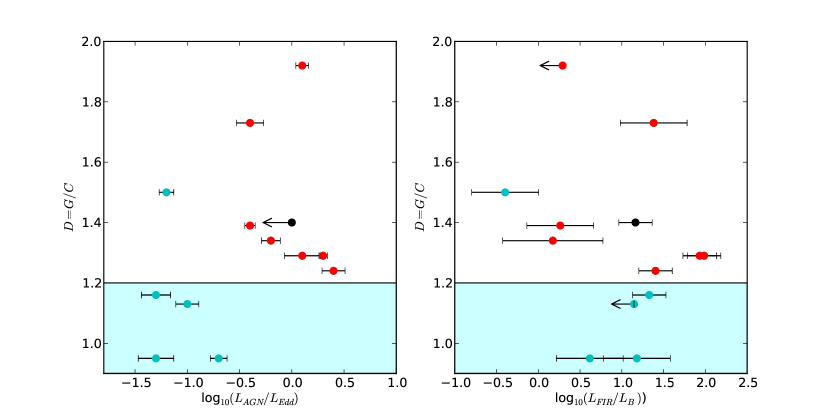
Finally, in Figure 6, we examine the relationship between the host galaxy morphology and the star formation rate and AGN accretion rate. In order to quantify the degree of disturbance of the host we use the ratio of Gini Coefficient (G) to Concentration Index (C). We showed in Urrutia et al. (2008) that the combination of these two quantities gave a robust indication of the degree of disturbance of the host galaxy. We therefore define a “disturbance parameter”, . This quantity is approximately unity for normal galaxies (Abraham et al., 2003), but is significantly greater than unity for highly disturbed systems. There is a weak (though not statistically significant) trend for high accretion rate objects to have more disturbed morphologies, though there is no apparent trend with specific star formation rate.
5. Discussion
Our aim in this study was to determine whether the infrared properties of these dust-reddened objects were consistent with the merger-driven co-evolutionary model for the growth of SMBH and their host galaxies. In particular, whether these objects are an intermediate stage between a merger-induced starburst and a “normal” quasar with an unreddened, blue continuum, with AGN feedback having stopped further star formation in the host. Our results seem to be consistent with this overall picture, but we see considerable variation in properties such as silicate absorption depth, star formation rate and AGN accretion rate on an object-by-object basis.
Much of the object to object variation is due to the heterogeneity of our sample; some have high reddenings, morphological disturbances, some do not. While they all are luminous quasars, they do span a large range in luminosities, too. In the overall picture, however, trends are evident. If an object is morphologically disturbed, it is much more likely to have a high Eddington ratio and to show Silicate in absorption (be reddened by cold dust). Similarly, the two quasars which did not show any signs of merger interaction in Urrutia et al. (2008) also do not display high Eddington ratios or Silicate in absorption and therefore should not be included characterized as “young quasars”. Not all dust-obscured quasars fit in the co-evolutionary scenario, but statistically, it is the most likely explanation and therefore our conclusions are to be taken as such. All these objects have mid-infrared (AGN) luminosities in excess of their far-infrared (presumed starburst) luminosities. This dominance of the AGN suggests that AGN feedback processes, if they are indeed important, will have started to have their impact on star formation in the host galaxy as we would have expected the starburst component to have dominated otherwise. We do not see any obvious quasar feedback “smoking guns”; broad absorption line features from AGN thermal winds, for example, are not present in any of our objects which are of high enough redshift to see Mg II absorption (0.7). However, experience from Urrutia et al. (2009), has shown that for the red quasars selected using our criteria the spectrum below 5000 Å is so extinguished that even deep absorption features are difficult to detect in objects with 0.9. Only three of our objects (F2M0729+3336, F2M1012+2825 and F2M1507+3129) have appropriate redshifts, and F2M0729+3336 is too noisy to detect absorption features. Nevertheless, an excess of low-ionization, broad absorption line quasars has been found in our full sample of red quasars, Urrutia et al. (2009), and a tentative relationship between wind properties and star formation seen has been seen by Farrah et al. (2012) in samples of reddened quasars. Blueshifted wings to [O III]5007Å, with velocities relative to the line peak of up to 1000 km s-1 are seen in five of our thirteen objects (F2M0729+3336, F2M0825+4716, F2M0915+2418, F2M1118-0033, F2M1151+5359). Of the four of these for which we can estimate accretion rates, three have accretion rates just exceeding the Eddington limit, possibly indicating a link with extremely high accretion rates, but the star formation rates in the hosts vary widely. We also lack any information on the spatial extent of these outflows, which may be confined to the nuclear regions. Blueshifted [O III] line components are common in compact radio sources: Holt et al. (2008) propose that these components are due to outflows of gas driven by the radio jets. The radio sources in our quasars are however significantly less luminous than those in the radio galaxies studied by Holt et al. (2008). Radio-quiet type-2 luminous quasars at low redshift also tend to show outflows in [O III]5007Å emission (Greene et al., 2011a), suggesting that these are not confined to radio sources, though the most spectacular object in the Greene et al. (2011a) sample, J1356+1026, is a relatively strong radio source (Greene et al., 2011b). Clearly the role of radio jets in powering these outflows needs to be established. In agreement with the evolutionary model, we see a large fraction of objects with high black hole accretion rates, consistent with the idea that quasar accretion rates are high in the early phase of growth. The objects with the highest accretion rates also tend to fall below the local black hole mass - bulge luminosity relation by dex; none of our objects with lower accretion rates are found there. This offset from the local relation is consistent with a picture in which the black hole is yet to grow to its equilibrium size following a major merger. It is also broadly consistent with numerical simulations of black hole growth in quasar merger scenarios, in which the total black mass hole grows by about 0.5 dex with every major merger event (e.g., Li et al., 2007, figure 10). Sarria et al. (2010) also find that their luminous, dust-obscured quasars at fall below the black hole mass – bulge mass relation at that redshift. An interesting exception is F2M0915+2418, which has a high accretion rate, but falls close to the black hole mass – bulge mass relation. This object also has one of the highest star formation rates in the sample, however, allowing it to evolve along a trajectory that will keep it close to the black hole mass – bulge mass relation. We do, however, have some remaining puzzles, where our data do not fit in with the most naive expectations of the evolutionary model. In Urrutia et al. (2008) we saw a relationship between and the amount of reddening in the host, but in Figure 6 there seems to be little correlation between the degree of disturbance of the host galaxy and the star formation rate, except that all high accreting quasars are also disturbed to some degree. There may, however, be a very weak trend for objects with high accretion rates relative to the Eddington Limit to have high values of , see Figure 6. Similarly, there is no clear morphological trend related to the offset of the quasar from the local galaxy luminosity – black hole mass relation. To some extent, the lack of clear trends here may be due to an admixture of objects reddened by foreground galaxies. In particular the low accretion rate objects may include some objects where the reddening is from an intervening galaxy through a chance alignment, perhaps from a galaxy in the same group or cluster. F2M1532+2415 is a good example of this, with an apparently highly-disturbed, early stage merger morphology, but both a low accretion rate and a low star formation rate, and F2M0834+3506 is a very good candidate for a low accretion rate broad-line radio galaxy reddened by a foreground irregular galaxy. In summary, our observations are consistent with the simplest evolutionary models, where a merger induced starburst triggers a obscured quasar which begins life accreting at close to the Eddington rate and later evolves into an unobscured quasar accreting at the of the Eddington rate more typically observed in the normal quasar population. We see no obvious evidence, however, of feedback affecting star formation in this particular sample (though we do see evidence of strong outflows of ionized gas in some objects). Nor do we see a clear sequence or progression from a newborn, highly obscured, high accretion rate AGN with a very disturbed host into a quiescent, almost unreddened object with a lower accretion rate. Our quasars were, however, selected within a fairly narrow range of luminosity (due to the 2MASS detection requirement and restricted redshift range) and reddening (if the reddening were too high, they would be classed as type-2s, but if it were too low they would not be picked out as red quasars), so we might not expect to be able to see much of an evolutionary sequence. These observations are most consistent with a picture in which the majority of objects undergo the starburst/merger phase well before we see these reddened quasars emerge, though not so long after that evidence for morphological disturbance of the hosts has been erased. The evolution in the black hole mass – bulge mass plane is then a shift along the bulge mass axis by dex followed yr later by a shift along the black hole mass axis by a similar amount. In one case, however, (F2M0915+2418) we do seem to see the starburst and accretion happening simultaneously. As our selection techniques for the dust-reddened quasar population expand, particularly as mid-infrared selected samples become large enough to include significant numbers of reddened type-1 quasars we expect to be able to expand our samples considerably, and trace out more of the evolutionary scenario.
References
- Alonso-Herrero et al. (2006) Alonso-Herrero, A. et al. 2006, ApJ, 640, 167
- Abraham et al. (2003) Abraham, R. G.; van den Bergh, S.; Nair, P. 2003, ApJ, 588, 218
- Antonucci et al. (1993) Antonucci, R. 1993, ARA&A, 31, 473
- Becker et al. (1995) Becker, R. H.; White, R. L.; Helfand, D. J. 1995, ApJ, 450, 559
- Bennert et al. (2008) Bennert, N.; Canalizo, G.; Jungwiert, B.; Stockton, A.; Schweizer, F.; Peng, C. Y.; Lacy, M. 2008, ApJ, 677, 846
- Bennert et al. (2010) Bennert, V. N.; Treu, T.; Woo, J.-H.; Malkan, M. A.; Le Bris, A.; Auger, M. W.; Gallagher, S.; Blandford, R. D. 2010, ApJ, 708, 1507
- Bentz et al. (2009) Bentz, M. C.; Peterson, B. M.; Netzer, H.; Pogge, R. W.; Vestergaard, M. 2009, ApJ, 697, 160
- Chiar & Tielens (2006) Chiar, J. E. & Tielens, A. G. G. M. 2006, ApJ, 637, 774
- Cutri et al. (2001) Cutri, R. M.; Nelson, B.O.; Kirkpatrick, J.D.; Huchra, J.P.; Smith, P.S. 2001, in ASP Conf. Ser. 232, The new Era of Wide Field Astronomy, ed. R. G. Clowes, A. J. Adamson and G. E. Bromage (San Francisco: ASP), 78
- Donley et al. (2005) Donley, J. L.; Rieke, G. H.; Rigby, J. R.; Pérez-González, P. G. 2005, ApJ, 634, 169
- Donley et al. (2007) Donley, J. L.; Rieke, G. H.; P rez-Gonz lez, P. G.; Rigby, J. R.; Alonso-Herrero, A. 2007, ApJ, 660, 167
- Donley et al. (2008) Donley, J. L.; Rieke, G. H.; Pérez-González, P. G.; Barro, G. 2008, ApJ, 687, 111
- Dunne & Eales (2001) Dunne, L & Eales, S. A. 2001, MNRAS, 327, 697
- Gallagher et al. (2007) Gallagher, S. C.; Richards, G. T.; Lacy, M.; Hines, D. C.; Elitzur, M.; Storrie-Lombardi, L. J. 2007, ApJ, 661, 30
- Eracleous & Halpern (2003) Eracleous, M, & Halpern, J. P. 2003, ApJ, 599, 886
- Farrah et al. (2012) Farrah, D.; Urrutia, T.; Lacy, M.; Efstathiou, A.; Afonso, J.; Coppin, K.; Hall, P. B.; Lonsdale, C.; Jarrett, T.; Bridge, C.; Borys, C.; Petty, S. 2012, ApJ, 745, 178
- Ferrarese & Merritt (2000) Ferrarese, L. & Merritt, D. 200, ApJ, 539, 9
- Georgakakis et al. (2009) Georgakakis, A.; Clements, D. L.; Bendo, G.; Rowan-Robinson, M.; Nandra, K.; Brotherton, M. S. 2009, MNRAS, 394, 533
- Glikman et al. (2004) Glikman, E.; Gregg, M.D.; Lacy, M.; Helfand, D.J.; Becker, R.H.; White, R.L. 2004, ApJ, 607, 60
- Glikman et al. (2006) Glikman, E.; Helfand, D. J.; White, R. L. 2006, ApJ, 640, 579
- Glikman et al. (2007) Glikman, E.; Helfand, D. J.; White, R. L.; Becker, R. H.; Gregg, M. D.; Lacy, M. 2007, ApJ, 667, 673
- Glikman et al. (2012) Glikman, E.; Lacy, M.; Urrutia, T.; Djorgovski, S. G.; Mahabal, A.; Myers, A.; Ross, N. P; Petitjean, P.; Ge, J. 2012, ApJ, in press, astro-ph/1207.2175
- Gregg et al. (2002) Gregg, M.D; Lacy, M.; White, R.L.; Glikman, E.; Helfand, D.; Becker, R.H.; Brotherton, M.S. 2002, ApJ, 564, 133
- Greene et al. (2011a) Greene, J. E.; Zakamska, N. L.; Ho, L. C.; Barth, A. 2011a, ApJ, 732, 9
- Greene et al. (2011b) Greene, J. E.; Zakamska N. L. & Smith, P. S. 2011b, ApJ, in press
- Hao et al. (2005) Hao, L.; Spoon, H. W. W.; Sloan, G. C.; Marshall, J. A.; Armus, L.; Tielens, A. G. G. M.; Sargent, B.; van Bemmel, I. M.; Charmandaris, V.; Weedman, D. W.; Houck, J. R. 2005, 625, 75
- Hao et al. (2007) Hao, Lei; Weedman, D. W.; Spoon, H. W. W.; Marshall, J. A.; Levenson, N. A.; Elitzur, M.; Houck, J. R. 2007, ApJ, 655, 77
- Herter et al. (2008) Herter, T. L. et al. 2008, SPIE, 7014, 30
- Hickox et al. (2007) Hickox, R. C.; Jones, C.; Forman, W. R.; Murray, S. S.; Brodwin, M.; Brown, M. J. I.; Eisenhardt, P. R.; Stern, D.; Kochanek, C. S.; Eisenstein, D.; Cool, R. J.; Jannuzi, B. T.; Dey, A.; Brand, K.; Gorjian, V.; Caldwell, N. 2007, ApJ, 671, 1365
- Hickox et al. (2009) Hickox, R. C. et al. 2009, ApJ, 696, 891
- Hiner et al. (2009) Hiner, K. D.; Canalizo, G.; Lacy, M.; Sajina, A.; Armus, L.; Ridgway, S.; Storrie-Lombardi, L. 2009, ApJ, 706, 508
- Holt et al. (2008) Holt, J.; Tadhunter, C. N.; Morganti, R. 2008, MNRAS, 387, 639
- Hopkins et al. (2008) Hopkins, P. F.; Hernquist, L.; Cox, T. J.; Keres̆, D. 2008, 175, 356
- Houck et al. (2004) Houck, J. R. et al. 2004, ApJS, 154, 18
- Kartaltepe et al. (2010a) Kartaltepe, J. S. et al. 2010a, ApJ, 709, 572
- Kartaltepe et al. (2010b) Kartaltepe, J. S. et al. 2010b, ApJ, 721, 98
- Kennicutt et al. (1998) Kennicutt, R. C. 1998, ARA&A, 36, 189
- Lacy et al. (2002) Lacy, M.; Gregg, M.D.; Becker, R.H.; White, R.L.; Glikman, E.; Helfand, D.; Winn, J.N. 2002, AJ, 123, 2925
- Lacy et al. (2004) Lacy, M. et al. 2004, ApJS, 154, 166
- Lacy et al. (2007a) Lacy, M.; Petric, A. O.; Sajina, A.; Canalizo, G.; Storrie-Lombardi, L. J.; Armus, L.; Fadda, D.; Marleau, F. R. 2007, AJ, 133, 186
- Lacy et al. (2007b) Lacy, M.; Sajina, A.; Petric, A. O.; Seymour, N.; Canalizo, G.; Ridgway, S. E.; Armus, L.; Storrie-Lombardi, L. J. 2007, ApJ, 669, 61
- Lewis & Eracleous (2006) Lewis, K.T. & Eracleous M. 2006, ApJ, 642, 711
- Li et al. (2007) Li, Y., Hernquist, L., Robertson, B., Cox, T. J., Hopkins, P. F., Springel, V., Gao, L., Di Matteo, T., Zentner, A. R., Jenkins, A., Yoshida, N. 2007, ApJ, 665, 187
- Lotz et al. (2004) Lotz, J. M.; Primack, J.; Madau, P. 2004, AJ, 128, 163
- Luo et al. (2009) Luo, B. et al. 2009, ApJ, 695, 1227
- Magorrian et al. (1998) Magorrian, J.; Tremaine, S.; Richstone, D.; Bender, R.; Bower, G.; Dressler, A.; Faber, S. M.; Gebhardt, K.; Green, R.; Grillmair, C.; Kormendy, J.; Lauer, T. 1998, AJ, 115, 2285
- Marconi & Hunt (2003) Marconi, A. & Hunt, L. K. 2003, ApJ, 589, 21
- Martínez-Sansigre et al. (2005) Martínez-Sansigre, A.; Rawlings, S.; Lacy, M.; Fadda, D.; Marleau, F. R.; Simpson, C.; Willott, C. J.; Jarvis, M. J. 2005, Nature, 436, 666
- Martínez-Sansigre et al. (2008) Martínez-Sansigre, A.; Lacy, M.; Sajina, A.; Rawlings, S. 2008, ApJ, 674, 676
- Merloni et al. (2010) Merloni, A. et al. 2010, ApJ, 708, 137
- Mor & Trakhtenbrot (2011) Mor, R. & Trakhtenbrot, B. 2011, ApJ, 737, L36
- Netzer et al. (2007) Netzer, H.; Lutz, D.; Schweitzer, M.; Contursi, A.; Sturm, E.; Tacconi, L. J.; Veilleux, S.; Kim, D.-C.; Rupke, D.; Baker, A. J.; Dasyra, K.; Mazzarella, J.; Lord, S. 2007, ApJ, 666, 806
- Nikutta et al. (2009) Nikutta, R.; Elitzur, M.; Lacy, M. 2009, ApJ, 707, 1550
- Piconcelli et al. (2010) Piconcelli, E.; Vignali, C.; Bianchi, S.; Nicastro, F.; Miniutti, G., Fiore, F. 2010, ApJ, 710, 992
- Richards et al. (2006) Richards, G. T. et al. 2006, ApJS, 166, 470
- Rieke et al. (2004) Rieke, G. H. et al. 2004, ApJS, 154, 25
- Sanders & Mirabel (1996) Sanders, D. B. & Mirabel, I. F. 1996, ARA&A, 34, 749
- Sajina et al. (2006) Sajina, A.; Scott, D.; Dennefeld, M.; Dole, H.; Lacy, M.; Lagache, G. 2006, MNRAS, 369, 939
- Sargsyan et al. (2008) Sargsyan, L.; Mickaelian, A.; Weedman, D.; Houck, J. 2008, ApJ, 683, 114
- Sarria et al. (2010) Sarria, J. E.; Maiolino, R.; La Franca, F.; Pozzi, F.; Fiore, F.; Marconi, A.; Vignali, C.; Comastri, A. 2010, A&A, 522, 3
- Schweitzer et al. (2006) Schweitzer, M. et al. 2006, ApJ, 649, 79
- Shi et al. (2009) Shi, Y.; Rieke, G. H.; Ogle, P.; Jiang, L.; Diamond-Stanic, A. M. 2009, ApJ, 703, 1107
- Siebenmorgen et al. (2005) Siebenmorgen, R.; Haas, M.; Krügel, E.; Schulz, B. 2005, A&A, 436, 5
- Silk & Rees (1998) Silk, J. & Rees, M. J. 1998, A&A, 331, 1
- Skrutskie et al. (2006) Skrutskie, M. F. et al. 2006, AJ, 131, 1163
- Spoon et al. (2007) Spoon, H. W. W.; Marshall, J. A.; Houck, J. R.; Elitzur, M.; Hao, L.; Armus, L.; Brandl, B. R.; Charmandaris, V. 2007, ApJ, 654, 49
- Stern et al. (2005) Stern, D. et al. 2005, ApJ, 631, 163
- Steinhardt & Elvis (2010) Steinhardt, C. L. & Elvis, M. 2010, MNRAS, 402, 2637
- Sturm et al (2006) Sturm, E.; Hasinger, G.; Lehmann, I.; Mainieri, V.; Genzel, R.; Lehnert, M. D.; Lutz, D.; Tacconi, L. J. 2006, ApJ, 642, 81
- Urrutia et al. (2005) Urrutia, T.; Lacy, M.; Gregg, M. D.; Becker, R. H. 2005, ApJ, 627, 75
- Urrutia et al. (2008) Urrutia, T.; Lacy, M.; Becker, R. 2008, ApJ, 674, 80
- Urrutia et al. (2009) Urrutia, T.; Becker, R. H.; White, R. L.; Glikman, E.; Lacy, M.; Hodge, J.; Gregg, Michael D. 2009, ApJ, 698, 1095
- Urry & Padovani (1995) Urry, C. M. & Padovani, P. 1995, PASP, 107, 803
- Vanden Berk et al. (2001) Vanden Berk, D. E. et al. 2001, AJ, 122, 549
- van der Marel (1999) van der Marel, R. P. 1999, AJ, 117, 744
- Werner et al. (2003) Werner, M. W. et al. 2004, ApJS, 154, 1
- White et al. (2003) White, R. L.; Helfand, D. J.; Becker, R. H.; Gregg, M. D.; Postman, M.; Lauer, T. R.; Oegerle, W. 2003, AJ, 126, 706
- Wright et al. (2010) Wright, E. L. et al. 2010, AJ, 140, 1868
- Zakamska et al. (2003) Zakamska, N. L. et al. 2003, AJ, 126, 2125
- Zakamska et al. (2008) Zakamska, N. L., Gómez, L., Strauss, M.A., Krolik, J.H. 2008, AJ, 136, 1607
Appendix A Appendix: Notes on Individual Objects
A.1. F2M0729+3336
This object lies outside the SDSS coverage, so photometry from the ESI spectrum was used when constructing the SED. Both the silicate feature and the optical SED are well fit with a reddening of . The object is detected in the X-ray by Chandra with six hard X-ray photons (Urrutia et al., 2005). It has an accretion rate close to (formally slightly in excess of) the Eddington limit, but no evidence of cool dust from substantial star formation activity, though the host galaxy appears disturbed. The inferred black hole mass lies significantly below the black hole mass – bulge luminosity relation, consistent with our observation that the black hole is still growing rapidly.
A.2. F2M0825+4716
Another high accretion rate object, but this one also has a strong starburst component in the far-infrared. The host is very disturbed, but, if the fit to the central component of the galaxy only is considered, lies close to the black hole mass – bulge luminosity relation. The strong black hole growth would thus take it significantly above the relation within a Salpeter time, if it were not for the high star formation rate, and the likelihood that some of the extended components of the host galaxy would merge with the central one in that timescale. As such, F2M0825+4816 is a prime example of black hole – host galaxy co-evolution.
A.3. F2M0830+3759
The lowest redshift (z=0.414) object in our sample, with a strong Chandra detection (Urrutia et al., 2005). A deeper X-ray spectrum with XMM reveals a cold or only moderately ionized absorber with a column density consistent with it being associated with the dust causing the quasar reddening, as well as an Fe K emission line from a reflection component (Piconcelli et al., 2010). This object has a relatively massive host galaxy, and the object lies below the black hole mass – bulge luminosity relation. Nevertheless, the accretion rate is relatively high , so again, this quasar may be able to build black hole mass effectively. The star formation rate is constrained to be relatively low, .
A.4. F2M0834+3506
This object has little or no silicate absorption, inconsistent with the observed reddening in the optical. The HST/ACS image too suggests that this, rather than being a post-merger system, may be a normal quasar obscured by a foreground irregular galaxy. The spectrum shows multiple-peaked permitted lines, with three identifiable components, one at the same redshift as the forbidden lines, one at and one at . The object is the only one of two in our sample to show multiple-peaked permitted lines, typically only seen in low accretion rate, radio-loud objects (Eracleous & Halpern, 2003), and our analysis indeed confirms a low accretion rate and a relatively low star formation rate. It lies a little above the local black hole mass – bulge luminosity relation, consistent with the idea that this object is a fairly normal quasar obscured by dust from a foreground object.
A.5. F2M0841+3604
Consistent the very irregular morphology, this object is well-fit by the simple cold dust screen model. It has both a moderately-high accretion rate and moderately-high star formation rate, lying below the black hole mass – bulge luminosity relation. The radio information reveal a steep spectrum point source, while the X-ray image shows a very hard hardness ratio (Urrutia et al., 2005).
A.6. F2M0915+2418
This object is the most luminous quasar in our sample, and is bright enough in the infrared to be detected in the IRAS Faint Source Catalog. The IRS spectrum is an archival one from Sargsyan et al. (2008). This object has both a high star formation rate and high accretion rate, and is the only one of our high accretion rate objects to fall close to the black hole mass – bulge mass relation in both plots of Figure 4. Due to its high star formation rate and high accretion rate, it will evolve with a trajectory close to the black hole mass – bulge mass relation for at least a Salpeter time (yr).
A.7. F2M1012+2825
A fairly unexceptional object in terms of its accretion rate, star formation rate and position on the black hole mass – bulge luminosity relation, it does, however have a double nucleus with a separation of only 1.2kpc (Urrutia et al., 2008).
A.8. F2M1113+1244
Another good candidate for a young quasar, with a high accretion rate (super Eddington; ), high star formation rate (FIR contribution in ULIRG regime; = 12.39), and plotting well below the black hole mass – bulge mass relation.
A.9. F2M1118-0033
This object shows no clear broad lines in either the optical or near-infrared spectrum. H is detected, but is relatively narrow (). There is a hint of broad Pa in the near-infrared -band, but it is not strong enough to allow us to estimate a linewidth. The SED is consistent with a reddened quasar. No black hole mass estimate is possible in this case, though we have obtained a limit based on the quasar luminosity and assuming Eddington-limited accretion.
A.10. F2M1151+5359
The reddening of this quasar is relatively modest, and the host almost undisturbed. Nevertheless, it has a high accretion rate and relatively high star formation rate, and lies well below the black hole mass – bulge mass relation.
A.11. F2M1507+3129
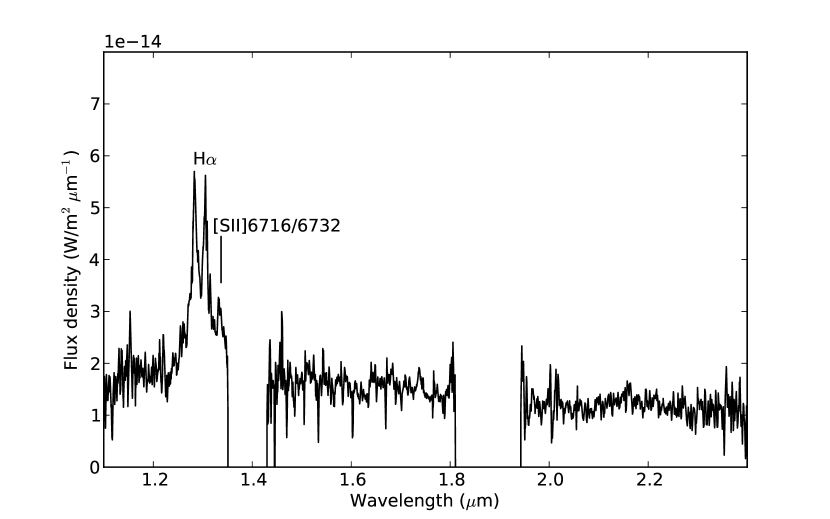
This object has a near-infrared spectrum in Glikman et al. (2004), however, we obtained an improved near-infrared spectrum with the Triplespec instrument (Herter et al., 2008) on the Hale 200-inch telescope on July 11th 2011. The data were calibrated using the A0V star HD127304. The new spectrum clearly shows a double-peaked broad H emission line in -band (Figure 7). The object is the second highest redshift double-peaked quasar currently known, and is more luminous than CXOECDFSJ0331-2755 at , the most distant double-peaked emitter (Luo et al., 2009). Like many objects in this class (Lewis & Eracleous, 2006), and indeed similar to the other double-peaked emitter in our sample, F2M0834+3506, it has a relatively low accretion rate (0.05 Eddington).
A.12. F2M1532+2415
The SED of this object is difficult to fit, consistent with the complicated structure seen in the host galaxy image. Despite a red continuum, the IRS spectrum lacks silicate absorption. The far-infrared luminosity is very low, the accretion rate is also low and the object lies close to the black hole mass – bulge mass relation. As of now the underlying physics responsible for the reddening and host disturbance is difficult to explain.
A.13. F2M1656+3821
This object has a relatively low star formation rate (barely above the LIRG regime; = 11.19), but a high accretion rate (roughly Eddington rate), and should be able to accrete matter onto the black hole to move up to the black hole mass – bulge mass relation from its current position dex below. It is also the object that is clearly in quadrant 2A of the Spoon et al. (2007) diagram, since it has such a deep Silicate absorption feature.