The first detection of the 232 GHz vibrationally excited H2O maser in Orion KL with ALMA
Abstract
We investigated the ALMA science verification data of Orion KL and found a spectral signature of the vibrationally excited H2O maser line at 232.68670 GHz (=1, 55,064,3). This line has been detected in circumstellar envelopes of late-type stars so far but not in young stellar objects including Orion KL. Thus, this is the first detection of the 232 GHz vibrationally excited H2O maser in star-forming regions. The distribution of the 232 GHz maser is concentrated at the position of the radio Source I, which is remarkably different from other molecular lines. The spectrum shows a double-peak structure at the peak velocities of 2.1 and 13.3 km s-1. It appears to be consistent with the 22 GHz H2O masers and 43 GHz SiO masers observed around Source I. Thus, the 232 GHz H2O maser around Source I would be excited by the internal heating by an embedded protostar, being associated with either the root of the outflows/jets or the circumstellar disk around Source I, as traced by the 22 GHz H2O masers or 43 GHz SiO masers, respectively.
1 Introduction
Water is one of the most abundant interstellar molecules after H2 and hence, it is important for interstellar chemistry and physics of molecular clouds (e.g. van Dishoeck et al., 2011). However, due to the large atmospheric opacity, ground-based observations of the H2O lines in radio and infrared bands are almost impossible except for the isotopic species (e.g. HDO and HO) and strong maser lines. In particular, the 61,652,3 transition at 22 GHz (lower state energy, =642 K) is known to show extremely strong maser emission in circumstellar envelopes (CSEs) around late-type stars, young stellar objects (YSOs) in star-forming regions (SFRs), and active galactic nuclei. The 22 GHz maser has been used as a unique probe of dense gas and their dynamics with very long baseline interferometers (VLBI) thanks to its extremely high brightness and compact structure (e.g. Chapman & Baan, 2007).
Other H2O maser lines are also detected in millimeter/submillimeter wavelength (Humphreys, 2007). Lower excitation lines in 183 GHz (=196 K) and 325 GHz (=454 K) are detected both in CSEs and around YSOs while some of the higher excitation lines including vibrationally excited lines are detected only in CSEs. Multi-transition studies of H2O maser lines could be powerful tools to investigate shocked regions in CSEs and YSOs at the highest spatial resolution achieved with VLBI and millimeter/submillimeter interferometers when combined with the theoretical models (Neufeld & Melnick, 1990, 1991).
In this Letter, we report the detection of the vibrationally excited H2O maser line at 232.68670 GHz (=3451 K) in a massive SFR Orion KL at a distance of 420 pc (Hirota et al., 2007; Kim et al., 2008) with the Atacama Large Millimeter/Submillimeter Array (ALMA). This line has been detected in late-type stars so far but not in YSOs including Orion KL (Menten & Melnick, 1989). Thus, this is the first detection of the 232 GHz H2O maser line in YSOs.
2 Observation
We employed the public data obtained with the ALMA science verification (SV) on 2012 January 20. They are part of a spectral line survey toward the Orion KL region at band 6 (215-245 GHz). The tracking center position of Orion KL was set to be R. A. =05h35m14.35s and decl.=05∘22′35″.0 (J2000). The data consist of several spectral settings and net on-source time for each setting was about 20 minutes. The baseline lengths ranged from 17 to 265 k (from 22 to 345 m) consisted of 1612 m antennas. The primary beam size of each 12 m antenna is about 30″ at band 6.
The spectral resolution of the ALMA correlator was 488 kHz, corresponding to the velocity resolution of 0.600.65 km s-1 at the observed frequency range. Dual polarization data were observed simultaneously. We made synthesis imaging with the calibrated data for selected observing frequency ranges by using the Common Astronomy Software Applications (CASA) package. The natural weighted beam size was 1″.71″.4 with the position angle of 171∘. The resultant typical rms (root-mean-square) noise level is 0.010.03 Jy beam-1 for each channel map. For comparison, we also made synthesized images of selected lines of methyl formate (HCOOCH3) as discussed later. The mapped lines are summarized in Table 1.
In addition to the SV data, we analyzed ALMA cycle 0 data for the continuum emission at band 6 in the Orion KL region. The observation was done in the extended configuration on 2012 April 08 with 1712 m antennas. The observed frequency ranges were 240244 GHz and 256260 GHz. The ALMA correlator was set for low resolution wideband continuum observations and the spectral resolution was 15.625 MHz. The line emissions were subtracted from the visibility data and effective bandwidth was almost half of the observed frequency range. The synthesis imaging was done with the CASA software package. The uniform-weighted synthesized beam size was 0″.740″.56 at a position angle of 101∘. The on-source integration time was 30 s and the resultant rms noise level of the continuum image was 7 mJy beam-1. Further details will be published in the forthcoming paper (T. Hirota et al., in preparation).
3 Results
First, we inspected the observed spectra of the ALMA SV data around the frequency range close to the 232 GHz H2O line. As a result, we found a significant spectral feature corresponding to a line-of-sight velocity with respect to the local standard of rest (LSR) of about 11 km s-1. We checked the database of molecular lines, Splatalogue111http://www.splatalogue.net/, which is a compilation of the JPL, CDMS, and Lovas/NIST catalogs (Pickett et al., 1998; Müller et al., 2005; Lovas, 2004), to confirm possible contamination of other spectral lines. We found that the torsionally excited HCOOCH3 line at 232.68393 GHz (=1, 1910,101810,9 E) could be another candidate of this line if the source LSR velocity is about 8 km s-1. Thus, one should be cautious in identifying the detected lines.
It is well known that Orion KL show an enormous amount of molecular lines described as a line forest (Beuther et al., 2005). The ALMA data also show a number of spectral lines and a significant fraction of them are unassigned to known molecular lines. According to previous line survey and interferometer observations, these molecular lines suggest complex velocity/spatial components in Orion KL such as the Hot Core, the Compact Ridge, SMA1, and Source I (Blake et al., 1986; Wright et al., 1996; Beuther et al., 2005; Favre et al., 2011). All of them show different radial velocity, velocity width and spatial distribution. In addition, they are known to show significant chemical differentiation. For example, oxygen-bearing organic molecules such as HCOOCH3 are known to be distributed mainly in the Compact Ridge at an LSR velocity of 8 km s-1 with a linewidth of 2 km s-1, while nitrogen-bearing species tend to peak at the Hot Core at the LSR velocity of 5 km s-1 and with wider velocity widths (Blake et al., 1986; Wright et al., 1996; Beuther et al., 2005; Favre et al., 2011). On the other hand, the SiO masers are distributed within 100 AU from the radio Source I (Menten & Reid, 1995; Reid et al., 2007; Kim et al., 2008). According to the observation with the Very Large Array (VLA), the 22 GHz H2O maser features are distributed in more extended regions, but they are concentrated around Source I, which are called the ”shell masers”, and the Compact Ridge (Gaume et al., 1998). If the detected feature really originates from the H2O masers at 232.68670 GHz, it can be distinguished based on the distribution and velocity structure of the emitting regions from other thermal lines.
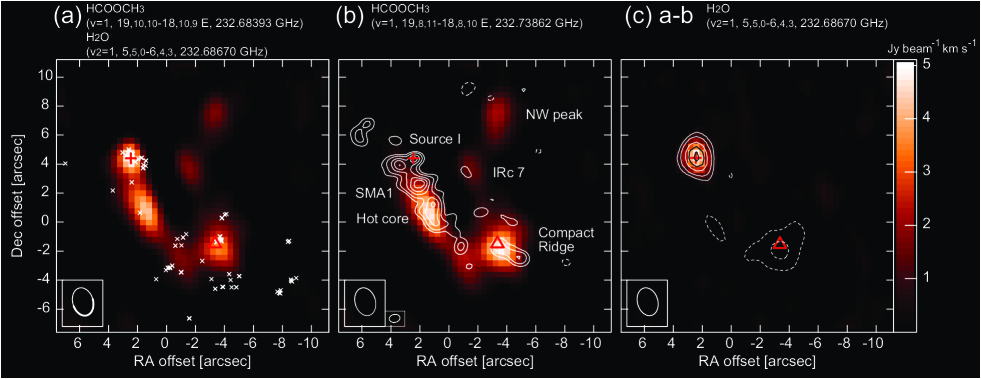
Then we made synthesis images of the spectral feature of the 232.68393 GHz HCOOCH3 line and/or the 232.68670 GHz H2O line (hereafter we call blended HCOOCH3/H2O feature) by using the calibrated SV data. The results are shown in Figure 1. For comparison, we show a reference image of another HCOOCH3 line at 232.73862 GHz (=1, 198,11188,10 E) having a similar frequency, lower state energy, and expected intensity (hereafter we call this line pure HCOOCH3 feature). As can be seen in Figure 1, overall distributions and peak intensities are quite similar. For example, both the blended HCOOCH3/H2O and the pure HCOOCH3 maps show four dominant compact condensations coincident with the Hot Core, the Compact Ridge, the Northwest peak, and IRc 7. They are consistent with previous HCOOCH3 observations (Favre et al., 2011). One of the brightest peaks is coincident with the Compact Ridge with the integrated intensities of 3.5 Jy beam-1 km s-1 and 4.9 Jy beam-1 km s-1 for the blended HCOOCH3/H2O feature and the pure HCOOCH3 line, respectively.
However, one can note a striking difference that only the blended HCOOCH3/H2O feature shows a significant peak at the position of Source I. This source is also associated with the strong SiO masers (Reid et al., 2007; Kim et al., 2008) and 22 GHz H2O masers (Gaume et al., 1998). By subtracting the pure HCOOCH3 map from the blended HCOOCH3/H2O map, the residual emission component is clearly concentrated at the Source I position as shown in Figure 1(c). It is thought to be the contribution from the H2O line. A negative component in the Compact Ridge could be due to an intensity variation of the HCOOCH3 maps between the two transitions. We also imaged five more HCOOCH3 lines which are not affected by the contamination from other molecular lines (Table 1), and we found that none of them shows a significant peak at the Source I position. Therefore, emission features in the blended HCOOCH3/H2O map can be distinguished between HCOOCH3 and H2O lines; HCOOCH3 is extended over the Hot Core, the Compact Ridge, the Northwest peak, and IRc 7 while H2O is only distributed around Source I.
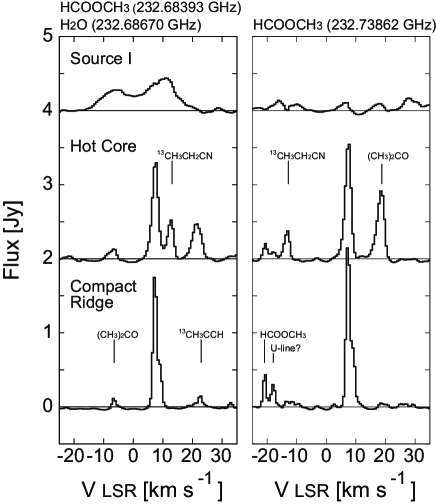
To investigate the spatial and velocity structure of the blended HCOOCH3/H2O feature more in detail, we made velocity channel maps and the spectra at the selected positions as shown in Figures 2 and 3, respectively. The dominant emission components of the blended HCOOCH3/H2O feature are found in the velocity channels from 6.9 to 17.0 km s-1 as shown in Figure 2. They are most likely attributed to the HCOOCH3 line blended with the H2O line, while higher velocity components are affected by the contamination from the ethyl cyanide (13CH3CH2CN) line at 232.67737 GHz. Other weak emission components can be seen in the velocity channels from 17.0 to 27.1 km s-1 and from 8.2 to 3.2 km s-1. They are identified as the methyl acetylene (13CH3CCH) and acetone ((CH3)2CO) lines at 232.67074 GHz and 232.69487 GHz, respectively. However, the channel maps show notable condensation around Source I with a velocity range wider than that of the HCOOCH3 and other molecular lines. These velocity structures can be seen more clearly in the spectra in Figure 3. The HCOOCH3 lines toward the Hot Core and the Compact Ridge show narrower linewidths of about 2 km s-1 at the peak velocities of 8 km s-1. In contrast, the spectrum of the blended HCOOCH3/H2O feature shows a double-peaked structure with the velocity range from 10 to 20 km s-1. Their peak flux densities are derived by the two-component Gaussian fitting to be 0.280.02 Jy and 0.430.02 Jy at the velocity of 2.10.6 km s-1 and 13.30.4 km s-1, respectively. On the other hand, no spectral feature is detected for pure HCOOCH3 toward Source I.
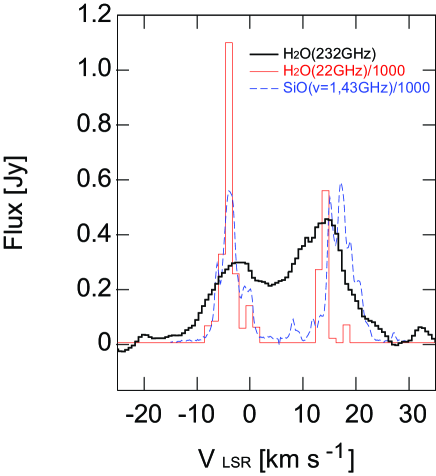
Interestingly, the spectral profile of the blended HCOOCH3/H2O feature toward Source I appears to be analogous to the 22 GHz shell masers (Gaume et al., 1998) and the 43 GHz SiO (=1) masers (Kim et al., 2008) as shown in Figure 4. One can see a common structure showing double-peaks at almost the same velocities and velocity ranges. Since the higher velocity features of the SiO (=1) maser show slightly redshifted with respect to the H2O maser lines, the blended HCOOCH3/H2O feature would have a closer relation with the 22 GHz H2O masers.
It is unlikely that other molecular lines with high velocity components contribute to this peak because no such molecular species is known except the SiO thermal (Beuther et al., 2005; Zapata et al., 2012) and maser (Reid et al., 2007; Kim et al., 2008) lines, as well as the H2O maser lines (Gaume et al., 1998). Therefore, we can safely conclude that at least the emission feature associated with Source I is the vibrationally excited H2O maser line at 232.68670 GHz.
4 Discussion
As discussed above, we can identify the 232.68670 GHz feature detected in the ALMA SV data for Orion KL as the vibrationally excited H2O maser. This is the first detection of this maser line in YSOs. The peak flux of the blended feature observed with the 2″2″ aperture is 0.43 Jy (Figures 3 and 4). It corresponds to the brightness temperature of 2.4 K. If this emitting region is as compact as this aperture size, the single-dish observation with the beam size of 30″ would yield the brightness temperature of 0.01 K. Thus, it was not detectable with the previous observations with single-dish telescopes (Menten & Melnick, 1989), although a possible spectral feature can be seen in the line survey data by Sutton et al. (1985), probably attributed to the HCOOCH3 line.
The vibrationally excited H2O masers have been detected in only several oxygen-rich late-type stars (Menten & Melnick, 1989), which could be attributed to their higher excitation levels (3451 K) than that of the 22 GHz maser (642 K). The 232 GHz H2O maser around Source I would be excited due to the internal heating by an embedded YSO as expected from a maser pumping mechanism for late-type stars. Source I is also known as a powering source of the SiO masers, which is quite rare for YSOs (Zapata et al., 2009). This observational evidence may imply similar characteristics of Source I and late-type stars. Further studies with the millimeter/submillimeter masers in Source I, along with other YSOs and CSEs in late-type stars, will be crucial in understanding the pumping mechanism of the H2O maser lines, physical and dynamical state of these maser sources, and accordingly mass-loss/accretion processes occurring in the YSOs and CSEs.
The 232.68670 GHz H2O maser emission is concentrated around Source I. However, the distribution of the 232 GHz H2O maser features could not be resolved with the ALMA SV data with the beam size of 1″.71″.4. According to the double-peaked spectra of the 22 GHz and 232 GHz H2O maser as shown in Figure 4, the 232 GHz maser features would have similar structure to that of the 22 GHz masers rather than the SiO masers. Higher resolution imaging will reveal their spatial structure and provide information about a possible powering source of the 232 GHz H2O maser; whether they are really associated with the root of outflows/jets as traced by the 22 GHz H2O masers (Gaume et al., 1998) or with circumstellar disk as traced by the 43 GHz SiO masers (Reid et al., 2007; Kim et al., 2008).
In the present study, we could not perfectly separate the contribution from the HCOOCH3 and the 232 GHz H2O maser lines mainly due to the insufficient spatial resolution. Therefore, it is still unclear whether the 232 GHz masers are distributed other than in Source I, such as the Compact Ridge where strong H2O maser lines are sometimes detected (Hirota et al., 2011; Gaume et al., 1998). A search for the 232.68670 GHz H2O maser lines with higher spatial resolution would be important to distinguish their distribution by filtering out the contribution from the thermal and extended HCOOCH3 emission.
Our results clearly demonstrate ALMA’s high possibility of detecting new millimeter/submillimeter maser lines with its high sensitivity/resolution. Further observational studies with ALMA of millimeter/submillimeter masers will reveal spatial and velocity structure of the maser sources at a resolution of 10 mas or better, providing a complementary method to the VLBI studies of the SiO and 22 GHz H2O masers.
References
- Beuther et al. (2005) Beuther, H., Zhang, Q., Greenhill, L. J., et al. 2005, ApJ, 632, 355
- Blake et al. (1986) Blake, G. A, Mundy, L. G., Carlstrom, J. E., et al. 1986, ApJ, 472, L49
- Chapman & Baan (2007) Chapman, J. M. & Baan, W. A. (ed.) 2007, IAU Symp. 242, Astrophysical Masers and their Environments (Cambridge: Cambridge Univ. Press)
- Favre et al. (2011) Favre, C., Despois, D., Brouillet, N.., et al. 2011, A&A, 532, A32
- Gaume et al. (1998) Gaume, R. A., Wilson, T. L., Vrba, F. J., Johnston, K. J., Schmid-Burgk, J. 1998, ApJ, 493, 940
- Hirota et al. (2007) Hirota, T., Bushimata, t., Choi, Y. K., et al. 2007, PASJ, 59, 897
- Hirota et al. (2011) Hirota, T, Tsuboi, M., Fujisawa, K., et al. 2011, ApJL, 739, L59
- Humphreys (2007) Humphreys, E. M. L. 2007, in IAU Symp. 242, Astrophysical Masers and their Environments, ed. J. M. Chapman & W. A. Baan (Cambridge: Cambridge Univ. Press), 471
- Kim et al. (2008) Kim, M. K., Hirota, T., Honma, M., et al. 2008, PASJ, 60, 991
- Lovas (2004) Lovas, F.J. 2004, J. Phys. Chem. Ref. Data, 33, 117
- Menten & Melnick (1989) Menten, K. M. & Melnick, G. J. 1989, ApJ, 341, L91
- Menten & Reid (1995) Menten, K. M. & Reid, M. J. 1995, ApJ, 445, L157
- Müller et al. (2005) Müller, H. S. P., Schlöder, F., Stutzki, J., & Winnewisser, G. 2005, J. Mol. Struct. 742, 215
- Neufeld & Melnick (1990) Neufeld, D. A. & Melnick, G. J. 1990, ApJL, 352, L9
- Neufeld & Melnick (1991) Neufeld, D. A. & Melnick, G. J. 1991, ApJ, 368, 215
- Pickett et al. (1998) Pickett, H. M., Poynter, R. L., Cohen, E. A., et al. 1998, J. Quant. Spectrosc. Radiat. Transfer, 60, 883
- Reid et al. (2007) Reid, M. J., Menten, K. M., Greenhill, L. J., & Chandler, C. J. 2007, ApJ, 664, 950
- Sutton et al. (1985) Sutton, E. C., Blake, G. A., Masson, C. R., & Phillips, T. G. 1985, ApJS, 58, 341
- van Dishoeck et al. (2011) van Dishoeck, E. F., Kristensen, L. E., Benz, A. O., et al. 2011, PASP, 123, 138
- Wright et al. (1996) Wright, M. C. H., Plambeck, R. L., & Wilner, D. J. 1996, ApJ, 469, 216
- Zapata et al. (2009) Zapata, L. A., Menten, K., Reid, M., & Beuther, H. 2009, ApJ, 691, 332
- Zapata et al. (2012) Zapata, L. A., Rodríguez, L. F., Schmid-Burgk, J., et al. 2012, ApJL, 745, L17
| Molecule | Transition | (GHz) | (K) | Note |
|---|---|---|---|---|
| H2O (=1) | 55,064,3 | 232.68670 | 3451 | Blended feature |
| HCOOCH3 (=1) | 1910,101810,9 E | 232.68393 | 354 | Blended feature |
| HCOOCH3 (=1) | 198,11188,10 E | 232.73862 | 331 | Pure HCOOCH3 |
| HCOOCH3 (=1) | 184,14174,13 A | 230.87881 | 290 | Not shown in this Letter |
| HCOOCH3 (=1) | 184,14174,13 E | 231.72416 | 290 | Not shown in this Letter |
| HCOOCH3 (=1) | 1910,91810,8 E | 231.74976 | 355 | Not shown in this Letter |
| HCOOCH3 (=1) | 1911,91811,8 E | 232.37770 | 368 | Not shown in this Letter |
| HCOOCH3 (=1) | 196,14186,13 E | 235.73208 | 312 | Not shown in this Letter |