Chandra grating spectroscopy of three hot white dwarfs
Abstract
Context. High-resolution soft X-ray spectroscopic observations of single hot white dwarfs are scarce. With the Chandra Low-Energy Transmission Grating, we have observed two white dwarfs, one is of spectral type DA (LB 1919) and the other is a non-DA of spectral type PG 1159 (PG 1520+525). The spectra of both stars are analyzed, together with an archival Chandra spectrum of another DA white dwarf (GD 246).
Aims. The soft X-ray spectra of the two DA white dwarfs are investigated in order to study the effect of gravitational settling and radiative levitation of metals in their photospheres. LB 1919 is of interest because it has a significantly lower metallicity than DAs with otherwise similar atmospheric parameters. GD 246 is the only white dwarf known that shows identifiable individual iron lines in the soft X-ray range. For the PG 1159 star, a precise effective temperature determination is performed in order to confine the position of the blue edge of the GW Vir instability region in the HRD.
Methods. The Chandra spectra are analyzed with chemically homogeneous as well as stratified NLTE model atmospheres that assume equilibrium between gravitational settling and radiative acceleration of chemical elements. Archival EUV and UV spectra obtained with EUVE, FUSE, and HST are utilized to support the analysis.
Results. No metals could be identified in LB 1919. All observations are compatible with a pure hydrogen atmosphere. This is in stark contrast to the vast majority of hot DA white dwarfs that exhibit light and heavy metals and to the stratified models that predict significant metal abundances in the atmosphere. For GD 246 we find that neither stratified nor homogeneous models can fit the Chandra spectrum. The Chandra spectrum of PG 1520+525 constrains the effective temperature to = K. Therefore, this nonpulsating star together with the pulsating prototype of the GW Vir class (PG 1159035) defines the location of the blue edge of the GW Vir instability region. The result is in accordance with predictions from nonadiabatic stellar pulsation models. Such models are therefore reliable tools to investigate the interior structure of GW Vir variables.
Conclusions. Our soft X-ray study reveals that the understanding of metal abundances in hot DA white dwarf atmospheres is still incomplete. On the other hand, model atmospheres of hydrogen-deficient PG 1159-type stars are reliable and reproduce well the observed spectra from soft X-ray to optical wavelengths.
Key Words.:
White dwarfs – Stars: individual: LB 1919, GD 246, PG 1520+525 – Stars: abundances – Stars: atmospheres – Stars: evolution1 Introduction
An unexpectedly small number of white dwarfs (WDs) were detected in the ROSAT PSPC X-ray all sky survey (Fleming et al. 1996). Most of them (161) are of spectral type DA (pure-hydrogen optical spectra), with an additional three DOs (helium-dominated), three DAOs (mixed H/He optical spectra), and eight PG 1159 stars (He–C–O dominated). It was realized that the atmospheric opacity of radiatively levitated metals effectively blocks the outward leakage of X-rays in the vast majority of DAs with 40 000 K (Barstow et al. 1997). Furthermore, the interstellar medium proved denser than expected in many lines of sight (see, e.g., Welsh et al. 1999), thus affecting cooler WDs.
High-resolution soft X-ray spectroscopy of hot WDs enables the identification of chemical species in their photospheres that cannot be detected in other wavelength ranges. However, such observations are rather scarce and only became feasible with the advent of the Chandra observatory with its Low-Energy Transmission Grating (LETG).
Until recently, only five WDs were observed with Chandra LETG. H 1504+65 is an extremely hot ( = 200 000 K), peculiar PG 1159 star, obviously a naked C–O or O–Ne WD, whose soft X-ray spectrum is characterized by highly ionized O, Ne, and Mg lines (Werner et al. 2004a). On the other hand, GD 246 is a DA, and its Chandra spectrum allowed the first unambiguous identification of lines from highly ionized iron (Vennes & Dupuis 2002). The Chandra spectra of the two DAs HZ 43 and Sirius~B are perfectly matched by pure-hydrogen atmospheres and are used as soft-X-ray calibration targets (Pease et al. 2000; Vennes & Dupuis 2002; Beuermann et al. 2006). A Chandra observation of the hot DO KPD 0005+5106 ( = 200 000 K) was used to prove that the soft X-ray emission is of photospheric and not coronal origin; however, the S/N ratio is insufficient to identify individual spectral lines (Drake & Werner 2005).
Few other WDs are bright enough in soft X-rays to obtain useful Chandra spectra. We have observed two of them (LB 1919 and PG 1520+525) and including archival data of GD 246 present a spectral analysis in this paper. The DA LB 1919 is of interest because previous Extreme Ultraviolet Explorer (EUVE) spectroscopy showed an unexpectedly high soft X-ray flux that reveals an unexplained low metal abundance (Wolff et al. 1998), in contrast to expectations from radiative-levitation theory. We performed X-ray spectroscopy in order to identify individual elements that could hint at the origin of the metal deficiency.
We observed PG 1520+525 in order to constrain its effective temperature. The motivation lies in the fact that this nonpulsating PG 1159 star, together with the pulsating prototype PG 1159–035, defines the blue edge of the GW Vir instability region in the Hertzsprung-Russell diagram (HRD), see e.g. Jahn et al. (2007). The homogeneous atmosphere of PG 1520+525 provides a convenient comparison for the investigated DA white dwarfs because it is not subject to the uncertainties in the treatment of radiative levitation and stratification of atmospheric composition. Thus, PG 1520+525 provides a test case for the model atmospheres employed in this study. A failure to achieve a consistent fit to the UV/optical and X-ray spectra of the homogeneous PG1159 photosphere would indicate serious model deficiencies in addition to problems that would be encountered with radiative levitation physics in the case of hot DA WDs.
This paper is organized as follows. We first describe in more detail the motivation of our soft X-ray analyses (Sect. 2). Then we specify our model atmosphere calculations and the atomic data used (Sect. 3). In Sect. 4, we report on the observations utilized in our analysis. In Sections 5 to 7 we delineate the analysis procedure of our three program stars one at a time, and in Sect. 8 we conclude.
2 Soft X-ray emission from white dwarfs
A concise presentation of past soft X-ray observations of WDs and their interpretation can be found, e.g., in Werner (2008).
2.1 DA white dwarfs
DA WDs possess almost pure hydrogen atmospheres. The high gravity in these objects results in a chemical stratification with the lightest element, hydrogen, floating atop. In hot DAs ( 20 000 K), hydrogen is almost completely ionized and the opacity in the atmosphere is strongly reduced. Soft X-ray radiation can emerge from deep, hot, photospheric layers. However, this radiation may be blocked by the opacity of heavy elements that can be kept in the atmospheres by radiative levitation (Chayer et al. 1995a, b). The increasing efficiency of this mechanism with results in only a few X-ray detected DAs with .
Since the spectral resolution of EUVE is too low to identify lines of individual species, the metal abundances of the hitherto investigated DAs were determined relative to the well-studied G 191–B2B (Wolff et al. 1998) using chemically homogeneous model atmospheres. The scaling of the metallicity in these models relative to that of G 191–B2B (the so-called metallicity index) results in satisfying spectral energy distribution (SED) fits for many, but not all, DAs.
To make further progress, non-LTE model atmospheres were developed that calculate the abundances of the elements at each atmospheric depth in a self-consistent way, assuming equilibrium between gravitational downward pull and radiative upward acceleration (Dreizler 1999). The EUVE SEDs of most DAs can be reproduced well by these models (Schuh et al. 2002). Some stars show a higher metallicity than predicted. This can be explained, for instance, by ongoing accretion of circumstellar or interstellar matter. Other stars have a lower metallicity than predicted by these models, and the reason for this is not known. A drastic example is HZ 43A ( K, Beuermann et al. 2006) whose SED is perfectly matched by a pure H model atmosphere. Another low-metallicity DA is the even hotter LB 1919 ( K, this paper), which is subjected to analysis here.
The exact knowledge of element abundances in the atmospheres of the metal-poor DAs might give hints as to an explanation for their metal deficiency. Many spectral lines of the high ionization stages of heavy elements like iron and nickel lie in the soft X-ray wavelength range. Spectroscopy with Chandra enables us to investigate these objects more closely. Our work represents the first detailed analysis of high-resolution soft X-ray spectra of DAs. Besides LB 1919, we study the more metal-rich DA GD 246 as a reference object.
2.2 PG 1159 stars
As mentioned in the introduction, only very few non-DAs (DO and PG 1159 stars) were detected in the soft X-ray band because of the additional opacity of helium and enriched metals. PG 1159 stars are hot, H-deficient (pre-) WDs with atmospheres mainly composed of He, C, and O. It is thought that their H-envelope was consumed during a late He-shell flash (Werner & Herwig 2006, and references therein). Among the PG 1159 stars, PG 1520+525 ( = 150 000 K) is one of the brightest soft X-ray sources and hence an interesting target to study the spectral characteristics of this class in that wavelength region. The surface abundances of these hot stars are not affected by gravitational and radiative acceleration because of a weak radiation-driven wind (Unglaub & Bues 1997). Consequently, their atmospheres and envelopes can be assumed to be chemically homogeneous.
Our primary aim for the Chandra observation of the nonvariable PG 1520+525 is to constrain its effective temperature. Then we can compare its position in the log – diagram with that of the prototype of the GW Vir pulsators, PG 1159–035. The blue edge of the instability region is confined by these stars (Werner et al. 1996). Based on nonadiabatic computations, the most advanced pulsation models for GW Vir stars, are those presented by Quirion et al. (2007). Accordingly, the exact location of the blue edge depends on the envelope composition, primarily on the C and O abundance and, to a smaller extent, on the metallicity. Therefore, the concept of a blue edge is necessarily “fuzzy”. It was shown by spectroscopic analyses that both stars have (within error limits) the same abundances of C, O, and Fe (see below) and thus define the blue edge for that particular composition. We can therefore prove or disprove the prediction of corresponding pulsation models as to the location of the edge. This represents a strong test for these models and their potential to derive the interior structure of PG 1159 stars by asteroseismology methods.
3 Model atmospheres and atomic data
For the spectral analysis, chemically homogeneous NLTE model atmospheres were computed with the Tübingen Model Atmosphere Package (TMAP111http://astro.uni-tuebingen.de/~TMAP, Werner et al. 2003), and chemically stratified models with a special variant, the diffusion/levitation NGRT code (Dreizler 1999). In comparison to earlier work with NGRT, refinements to the code were applied for more realistic physics. Moreover, new model atoms for Fe, Ni, and Ge were constructed. These improvements are described in the following.
3.1 Improvements to the diffusion/levitation code NGRT
In the NGRT code, the element abundance pattern at any depth point in the atmosphere is calculated self-consistently by assuming equilibrium between gravitational and radiative forces. As a result, the atmosphere is no longer chemically homogeneous but vertically stratified.
3.1.1 Bound-free transitions
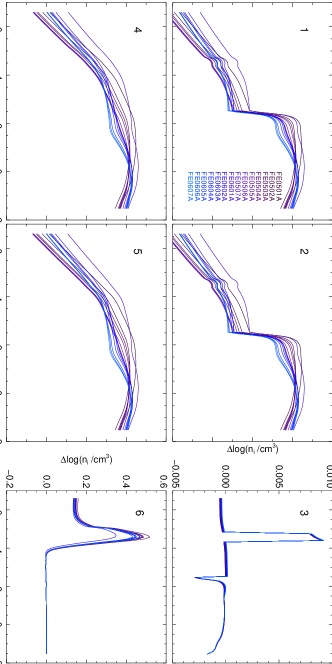
The primary assumption for the calculation of the radiative force of a bound-free (bf) transition in NGRT is that the photon momentum is transferred completely to the ion, keeping the electron out of consideration. As a consequence, the calculated radiative acceleration of the remaining ion might be overestimated. To check this assumption quantitatively, a correction according to Gonzalez et al. (1995) was implemented and tested.
The radiative force on a particle of element , with ionic charge i for a bound-bound (bb) or bf transition j, caused by photons in the frequency range () is
| (1) |
with the net momentum , transported by the radiation flux . As mentioned above, in the case of a bf transition, the momentum of the photon causing an ionization of ion is not completely transferred to ion . A part of it is taken away by the ejected electron. Thus, a correction factor has to be introduced, describing the remaining fraction of the momentum transferred to the ion .
The correction factor can be expressed in terms of the frequency of the photon, the threshold frequency necessary to eject the electron and a factor .
| (2) |
For testing purposes, the quantum calculation of Sommerfeld (1939) was taken and applied to the code. With his value of , becomes
| (3) |
with the ionization energy threshold . An interesting result of Eq. 3 was already stated by Michaud (1970). For certain frequencies the electron can be ejected with more momentum than brought in by the photon (). As a consequence, the ion will be pushed back in the atmosphere by the photoionization. Thus, including a detailed bf absorption calculation can in principle lead to either higher or lower outward directed radiative forces on an ion.
The comparison between abundances at each depth of the atmospheres calculated with old and new treatments of bf transitions reveals, however, only minor and practically unimportant deviations (Fig. 1); there is no effect on the SED, in particular on the spectral lines, of the model.
3.1.2 Bound-bound transitions
In the original NGRT code as used by Schuh et al. (2002), the redistribution of transferred photon momentum over the ionization stages and by a bb transition in was treated such that the momentum was completely transferred to the next higher ion . This treatment is based on the assumption that an ionization following the radiative excitation of the ion takes place before the ion is deexcited by an inelastic electron collision. Especially in very hot atmospheres, this need not be true. For a realistic treatment, the probabilities for ionization and collisional deexcitation would have to be evaluated. In a statistical sense, fractions of the momentum are transferred to the next higher ion and to the originally excited ion .
As a rough approach to test the maximum possible effect, the calculation of the bb transitions was modified such that the entire photon momentum is transferred to the lower ion . For example, we show the effect of the modified bb (and bf) procedures on the population numbers of iron superlevels (introduced below) in Fig. 2. While the modified bf transitions leave the occupation numbers essentially unaltered, the modification of the bb transitions results in an obvious change, although only in the outer photospheric layers. The effect on the emergent flux is below 10% and thus considered insignificant, even under the extreme assumption of the fully inverted momentum distribution. Therefore, a more complex treatment is unnecessary for our purposes.
3.2 Model atoms
For our model atmosphere calculations, we used two different sets of model atoms for the analysis of the PG 1159 star on the one hand and for the two DAs on the other hand. The first set is identical to that described in detail by Werner et al. (2004a) in their Chandra analysis of H 1504+65. It comprises He, C, O, Ne, and Mg. The second set incorporates H, He, C, O, Si, P, S, and Ge, being represented by detailed model atoms taken from the Tübingen Model Atom Database222http://astro.uni-tuebingen.de/~TMAD TMAD. It is augmented by Fe and Ni which are treated in a statistical way using superlevels and superlines (Rauch & Deetjen 2003). Table 1 summarizes the set of data used for the DA analyses.
The Ge model atom is new and presented in more detail below. We also use new Fe and Ni model atoms that comprise vastly extended line lists (Kurucz 2009) compared to all previous analyses. Their characteristics are also described in detail below.
| Elem. | Ion | NLTE levels | lines | ||
|---|---|---|---|---|---|
| H | I | 10 | 45 | ||
| II | 1 | ||||
| C | II | 16 | 37 | ||
| III | 58 | 329 | |||
| IV | 54 | 295 | |||
| V | 1 | ||||
| O | II | 16 | 26 | ||
| III | 21 | 38 | |||
| IV | 18 | 39 | |||
| V | 30 | 95 | |||
| VI | 54 | 291 | |||
| VII | 1 | ||||
| Si | II a | 20 | 48 | ||
| III | 17 | 28 | |||
| IV | 16 | 44 | |||
| V | 15 | 20 | |||
| VI | 1 | ||||
| P | III | 3 | 0 | ||
| IV | 15 | 9 | |||
| V | 18 | 12 | |||
| VI | 1 | ||||
| S | III a | 3 | 0 | ||
| IV | 17 | 32 | |||
| V | 19 | 32 | |||
| VI | 18 | 48 | |||
| VII | 1 | ||||
| Ge b | III | 14 | 0 | ||
| IV | 8 | 8 | |||
| V | 9 | 0 | |||
| VI | 1 | ||||
| Fe | III | 7 | (2467) | 27 | (537689) |
| IV | 7 | (6389) | 27 | (3102371) | |
| V | 7 | (6728) | 25 | (3266247) | |
| VI | 8 | (5464) | 33 | (991935) | |
| VII | 9 | (2690) | 41 | (200455) | |
| VIII | 8 | (694) | 33 | (19587) | |
| IX | 1 | ||||
| Ni | III | 5 | (3739) | 14 | (1033920) |
| IV | 7 | (5939) | 27 | (2512561) | |
| V | 7 | (6165) | 25 | (2766664) | |
| VI | 7 | (10985) | 27 | (7408657) | |
| VII | 8 | (11866) | 33 | (4195381) | |
| VIII | 7 | (6469) | 27 | (1473122) | |
| IX | 1 |
-
a
LB 1919 models only
-
b
GD 246 models only

3.2.1 Germanium
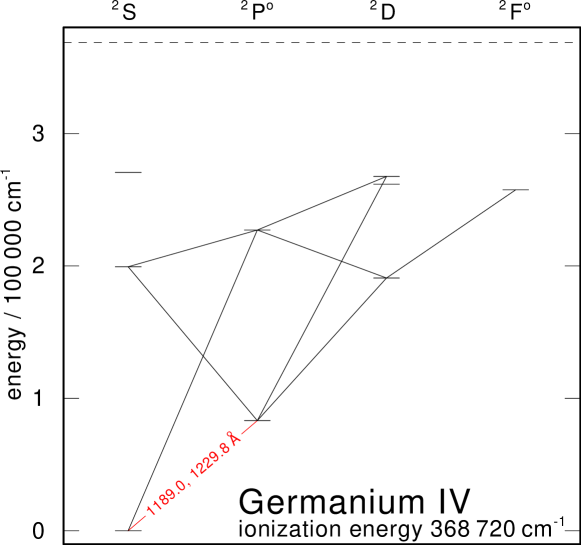
Germanium (Ge iv) was first identified in three hot DAs, among them GD 246, by Vennes et al. (2005). For GD 246, we perform the first NLTE analysis of Ge in a stellar atmosphere and investigate its radiative levitation properties. The model atom was constructed using level energies from the NIST333http://physics.nist.gov/ database. Due to the lack of data, all oscillator strengths are approximated by adopting values from the isoelectronic C iv, with the exception of the two observed Ge iv Å lines, for which we use the from Chayer et al. (2005). Very recently, new for Ge iv lines were published (Nath Dutta & Majumder 2011). A single test calculation was performed in which we use the new data for all line transitions in the model atom. The effect on the observed two lines is insignificant. Photoionization rates were computed with hydrogen-like cross sections. Electron collisional excitation and ionization rates were evaluated with usual approximation formulae following van Regemorter (1962) and Seaton (1962), respectively.
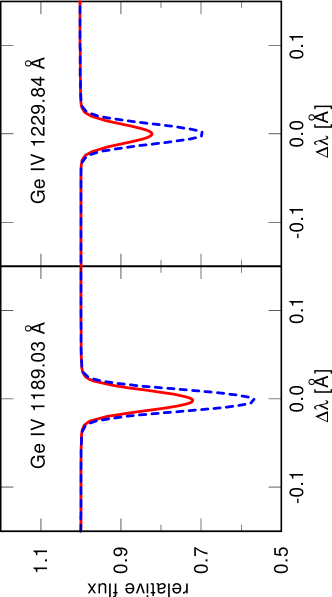
In order to check for the importance of NLTE effects, we performed another test calculation in which we enforced LTE populations for Ge levels by artificially increasing electron collisional rates. The NLTE line profiles are significantly shallower than the LTE profiles (Fig. 4). As a consequence, the derived NLTE abundances will be roughly a factor of two higher compared to LTE analyses.
3.2.2 Iron and nickel
The Iron Opacity Interface (IrOnIc) constructs model atoms for iron-group elements as input for the stellar-atmosphere code (Rauch & Deetjen 2003). During the course of this work, new Fe and Ni line data were provided by Kurucz (2009)444http://kurucz.harvard.edu/atoms.html. They include a much larger number of lines (about 20 times more), especially in the X-ray range. Figures 5 and 6 demonstrate the effect of these additional lines used in the atmosphere calculations. The new line lists were not incorporated in the bulk of the model calculations, however, the best-fitting models presented here were recalculated with the newest Kurucz atomic data sets available.

4 Observations, reddening, interstellar H and He column densities
We performed Chandra spectroscopy of LB 1919 and PG 1520+525 with the LETG/HRC-S. For GD 246, we used the Chandra observation investigated by Vennes & Dupuis (2002). Other observations used in our work were retrieved from the MAST555http://archive.stsci.edu/ archive. All observations are listed in Table 2.
| Star | Instrument (Id.) | Observation | |
| start date (UT) | (ks) | ||
| mm-dd-yyyy | |||
| LB 1919 | EUVE | 04-16-1994 | 166 |
| FUSE LWRS | 05-03-2001 | 33 | |
| IUE SWP 52808 | 11-15-1994 | 4.5 | |
| Chandra LETG/HRC-S | 02-02-2006 | 111 | |
| GD 246 | EUVE | 08-08-1994 | 14 |
| FUSE LWRS | 11-12-2000 | 1.5 | |
| FUSE MDRS | 07-14-2001 | 24 | |
| HST STIS/E140H | 11-20-1998 | 2.4 | |
| IUE SWP 40467 | 12-27-1990 | 0.33 | |
| IUE LWP 19485 | 12-27-1990 | 0.84 | |
| Chandra LETG/HRC-S | 01-14-2000 | 40 | |
| PG 1520+525 | Chandra LETG/HRC-S | 04-04-2006 | 142 |
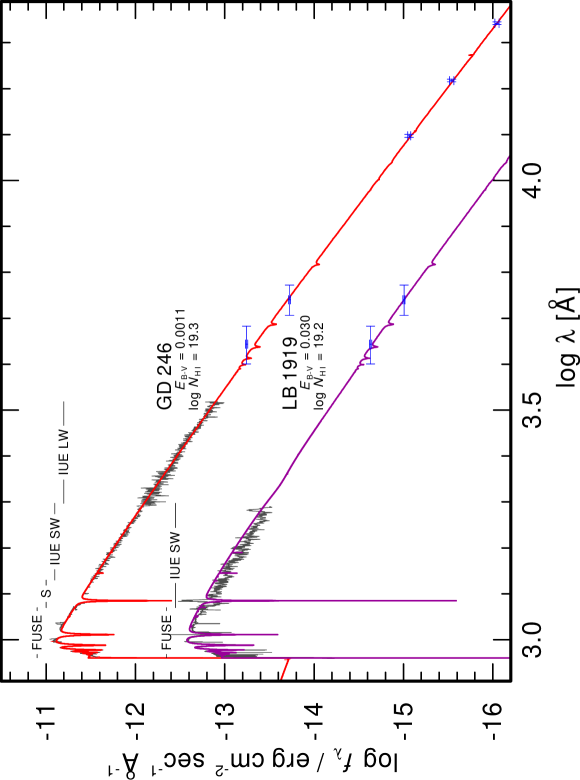
In order to determine interstellar reddening, FUSE, IUE, and HST-STIS spectra (the latter marked with “S” in Fig. 7) as well as optical and IR magnitudes from the SIMBAD and NOMAD databases were investigated. Fluxes of our final models were scaled to the reddest available photometric magnitude. The reddening law of Fitzpatrick (1999) was used with . We determined and for LB 1919 and GD 246, respectively. These quantities will be used below for distance determination. Accounting for absolute-flux uncertainties in the UV, more realistic errors are of the order . However, the error in the distance determination is dominated by the uncertainties in and , and we neglect the errors for reddening. For PG 1520+525, Dreizler & Heber (1998) derived .
Column densities for interstellar neutral hydrogen as well as neutral and ionized helium affect the analysis of EUVE and Chandra spectra.
LB 1919: Based on the values found in the EUVE analysis by Landenberger-Schuh (2005) (, , ), the interstellar H and He column densities were varied in our fitting procedure. Our values for two of the best-fitting models are depicted in Fig. 12. For our present fit to the Chandra spectrum, we used , , .
GD 246: The H i column density of was taken from Oliveira et al. (2003) and kept fixed. Our adopted values for the column densities of He i (0.12 N(H i)) and He ii (0.02 N(H i)) are close to the ones determined by Vennes et al. (1993) (, ).
Since these numbers depend on their assumed photospheric model, we adjusted the values slightly to better fit our models. For our Chandra analysis presented here we chose 0.05 and 0.026 N(H i), respectively, which is close to the values used by Landenberger-Schuh (2005).
PG 1520+525: Werner et al. (1996) used for their fit of a = 150 000 K model to the SED observed by EUVE. Dreizler & Heber (1998) determined from the Ly line profile. For the fit to the Chandra spectrum, the H i column density was treated as a free parameter. For our final model fits in this paper, we found . The variation of the He column densities had no effect on the fit quality, and were kept fixed at and .
5 LB 1919
5.1 Previous investigations
LB 1919 (WD 1056+516) was analyzed by Vennes et al. (1997) using Balmer-line spectroscopy and pure-hydrogen model atmospheres. They obtained K and (cgs units). Finley et al. (1997) excluded the star from their analysis. Their spectrum exhibited flat-bottomed Balmer-line profiles, and they suggested orbital or rotational velocities of km/s as a possible interpretation, although they may be artifacts (Koester priv. comm.). More recently, Lajoie & Bergeron (2007) determined and , and Gianninas et al. (2011) found and by pure-hydrogen model fits to the Balmer lines.
Wolff et al. (1998) investigated a sample of 20 DAs from the EUVE archive. Introducing the above-mentioned metallicity index (Sect. 2.1), they were able to reproduce the spectra of most of them. For LB 1919, they determined a metallicity at least ten times smaller compared to that of G 191–B2B, adopting and values from Vennes et al. (1997).
Based on these results, Landenberger-Schuh (2005) performed an analysis of EUVE spectra of DAs using new chemically stratified NLTE model atmospheres with equilibrium abundances. In the case of LB 1919, the use of these new models resulted, however, in a worse fit compared to the analysis of Wolff et al. (1998) with homogeneous models because of too much levitation of metals in the diffusion models. The reason for this overprediction remained unexplained.
5.2 FUSE
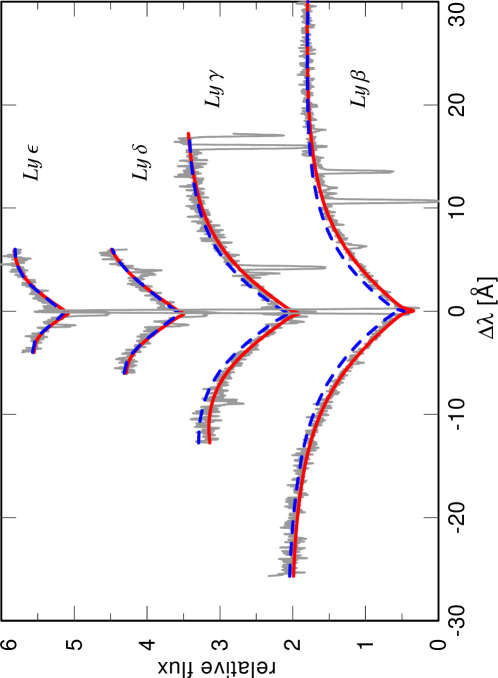
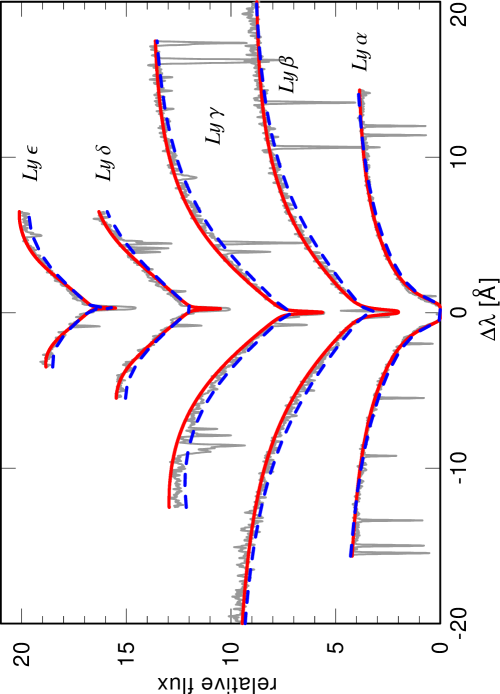
A grid of pure-hydrogen model atmospheres was used to fit the Lyman lines in the FUSE spectral range. We found K and . Somewhat hotter models with higher gravity (e.g., , ) fit almost equally well, but are excluded by the Chandra spectrum (Sect. 5.4). The temperature is significantly lower than the Balmer-line results reported above. It is remarkable that Lajoie & Bergeron (2007) arrived at a similarly low value of 57 70118 400 K from the overall UV (IUE)/optical flux distribution, and at an even lower value of 39 04518 000 K by fitting the Ly line in the IUE spectrum. Figure 8 shows the comparison between a hotter model and a better-fitting, cooler model together with the FUSE Lyman lines. Adding metals to the 56 000 K model with abundances at the upper limit derived below has no significant influence on the Lyman-line profiles.
Upper limits to metal abundances were determined with homogeneous model atmospheres. Their accuracy is estimated to be about 0.3 dex following from the error ranges in and , and they are given in number ratios relative to H. We also compare line profiles from diffusion models with observations.
Carbon and Oxygen
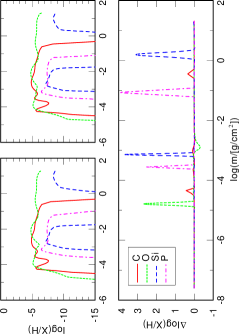
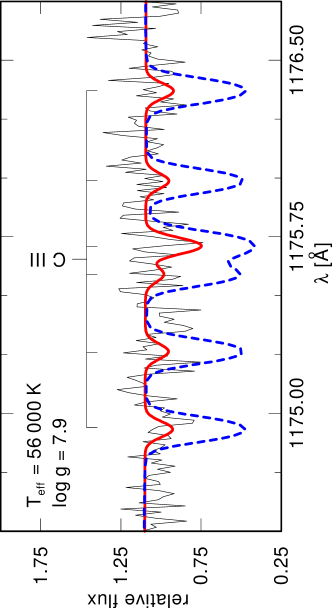
From the absence of C iii Å, we derive an upper limit of C/H = . The stratified models overpredict the line strengths (Fig. 9). Note that all computed line profiles have zero rotation velocity.
Except for the O vi 1031.91, 1037.61 Å resonance doublet, no O line is identified. Because of a possible ISM contribution, only an upper limit of O/H can be derived. The stratified models fit the observation best for . A smaller gravity results in too strong features.
Silicon, Phosphorus and Sulfur
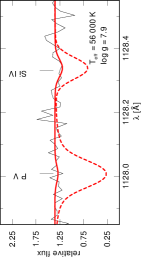
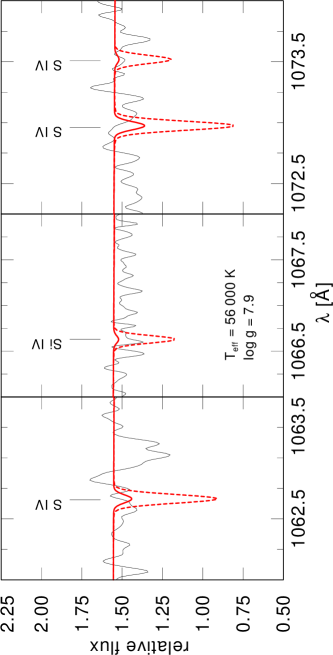
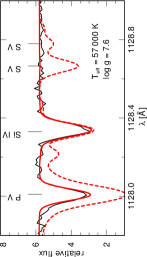
From the absence of Si iv 1066.63, 1122.48, 1128.33 Å, P v 1117.98, 1128.01 Å, and S iv 1062.66, 1072.96, 1073.508 Å, upper limits of Si/H , P/H and S/H are derived (Figs. 10, 11). In all cases, the diffusion models predict too strong line profiles.
Iron and Nickel
No lines are identified corresponding to upper limits of and . At K, the stratified models predict no detectable lines only if the surface gravity is or higher.
5.3 EUVE
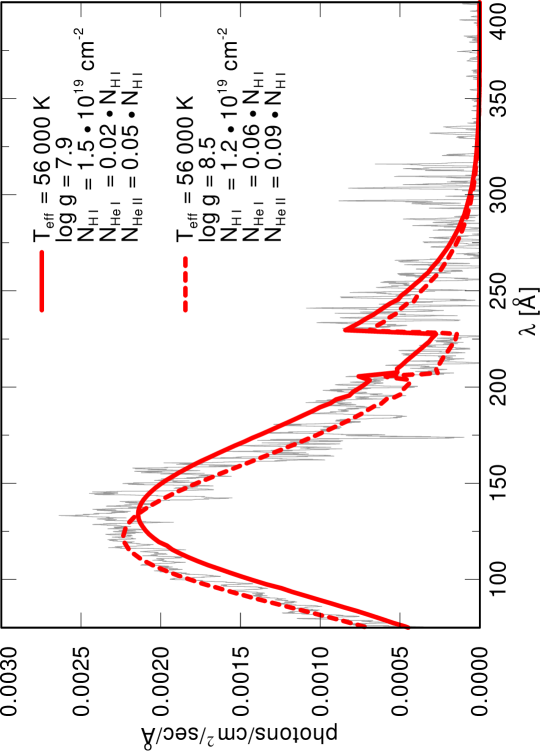
The stratified models calculated by Landenberger-Schuh (2005) had a flux too low to match the EUVE observation. The failure to derive a good fit resulted from the excessive opacity caused by the large number of elements incorporated in the model atmospheres. We tried to reproduce the EUVE observation with stratified models that include only those metals listed in Table 4, i.e., metals that have been detected in the FUSE spectra of comparable WDs, like GD 246. Our results show that the strongest influence on the EUV SED comes from the opacity of oxygen and that a satisfying fit can only be derived for a model atmosphere without this species and at high gravity ( = 8.5). We also computed homogeneous models with the same elements and abundances set to the upper limits derived from the FUSE analysis (again without oxygen) and also obtained a good fit (Fig. 12). The same result is obtained from a pure H model.
5.4 Chandra
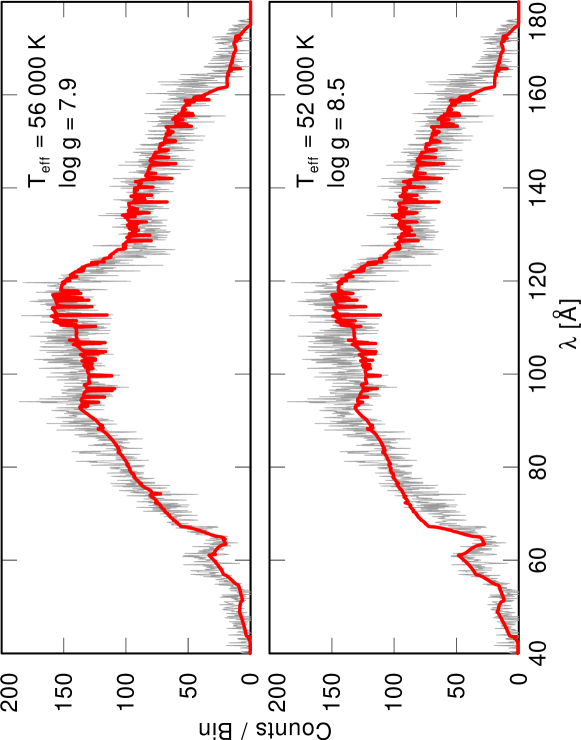
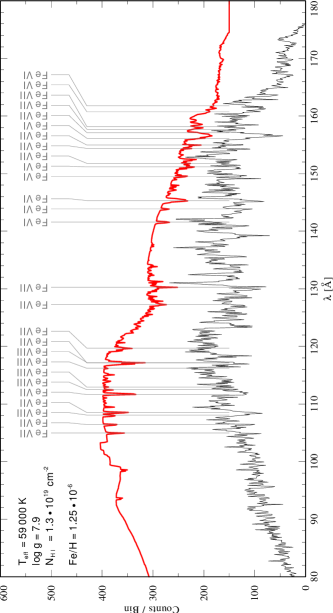
No Fe or Ni lines are detected in the Chandra spectrum, giving upper abundance limits of Fe/H and Ni/H derived from homogeneous Fe+H and Ni+H models. These limits are almost one order of magnitude more stringent than the FUSE-derived results. The observed overall SED can be reproduced successfully with both homogeneous and stratified models. The interstellar H and He column densities were kept fixed to the EUVE-derived values. For the stratified models, however, there is still enough Fe and Ni levitated that lines should be detectable in the Chandra spectrum, even at a higher gravity of .
For further analysis, homogeneous and stratified models were calculated that incorporated the same metals as the EUVE analyses in the preceding section. Individual spectral features in the observation are not recognizable, which serves as an additional constraint for the upper limits of the metal abundances determined in the FUSE analysis. Both kinds of models match the Chandra spectrum well. The models displayed in Fig. 13 include oxygen, the homogeneous model with an abundance according to the upper limit given in Table 4. The vast majority of the weak lines in these models stems from O. In essence, a pure H model gives an equally good fit.
5.5 Mass and distance
To determine the mass from and , we use DA evolutionary tracks by Althaus & Benvenuto (1998). We chose the tracks with metallicity and hydrogen-envelope fractional mass of and derive . Taking the flux calibration of Heber et al. (1984), we compute the distance, using the extinction-corrected visual magnitude that is determined from the observed magnitude V=16.41 to E(BV) with E(BV) = 0.030. With K, , and (model Eddington flux at 5454 Å) we find (see, e.g., Rauch et al. 1994)
| (4) |
5.6 Summary on LB 1919
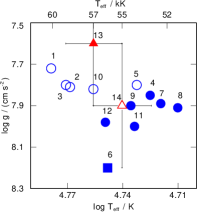
Our fit to the Lyman lines and the Chandra spectrum gave K, . The temperature is significantly lower () than that derived from previous Balmer-line fits. This result is surprising because Barstow et al. (2003a) had established that Lyman-line analyses for DAs exceeding K yield systematically higher temperatures than Balmer-line analyses, i.e., the opposite that we found for LB 1919. In their sample, however, there is also one exception to this general trend. Very similar to LB 1919, PG 1342+444 has = 66 750 K and 54 308 K derived from Balmer and Lyman lines, respectively (see also Barstow et al. 2002).
Metal lines are not detected in the FUSE and Chandra spectra. We derived upper abundance limits with homogeneous models. The respective models fit the SEDs observed by Chandra and EUVE. Stratified models, on the other hand, overpredict metal abundances. Reducing the abundances in these models to bring them into agreement with observations requires an excessively high gravity ( ), which is not compatible with the Balmer and Lyman lines. In essence, this confirms the result obtained from the EUVE analysis by Landenberger-Schuh (2005). All observations are compatible with a pure H atmosphere.
| No. | [K] | [] | Method and Model Atmospheres | Authors | ||
|---|---|---|---|---|---|---|
| 1 | 60 100 | 7.72 | LTE | Balmer | H | Vennes et al. (1997) |
| 2 | 58 700 | 7.81 | LTE | Balmer | H | Finley et al. (1997) |
| 3 | 59 000 | 7.80 | LTE | EUVE | H+metals | Wolff et al. (1998) |
| 4 | 53 100 | 7.85 | NLTE | Balmer | H | Napiwotzki et al. (1999) |
| 5 | 54 000 | 7.80 | LTE | Lyman | H | Wolff et al. (2001) |
| 6 | 56 000 | 8.20 | NLTE | EUVE | H+metals stratified | Schuh et al. (2002) |
| 7 | 52 402 | 7.89 | NLTE | Lyman | H+metals | Barstow et al. (2003a) |
| 8 | 51 300 | 7.91 | NLTE | Balmer | H+metals | Barstow et al. (2003a) |
| 9 | 54 400 | 7.90 | NLTE | Balmer | H | Liebert et al. (2005) |
| 10 | 57 007 | 7.82 | LTE | Balmer | H | Koester et al. (2009) |
| 11 | 54 150 | 8.00 | NLTE | Balmer | H | Limoges & Bergeron (2010) |
| 12 | 56 160 | 7.98 | NLTE | Balmer | H | Gianninas et al. (2011) |
| 13 | 57 000 | 7.60 | NLTE | Lyman | H | this work |
| 14 | 55 000 | 7.90 | NLTE | Chandra | H+metals stratified | this work |
6 GD 246
6.1 Previous investigations
Earlier determinations of and of GD 246 (WD 2309+105) are summarized in Table 3 and Fig. 14. The most recent study by Gianninas et al. (2011) is probably the most reliable NLTE Balmer-line analysis because it utilizes new Stark broadening data (Tremblay & Bergeron 2009). (We use the same data in our analysis.) All analyses are based on Balmer- and/or Lyman-line profiles with the exception of two, which are based on the EUVE SED. One of them (Schuh et al. 2002) uses stratified NLTE models, and it results in an exceptionally large gravity.
A small number of lines of trace metals could be identified in the FUSE and HST spectra of GD 246. Beside elements known to appear in WDs like Si, C, and P, Vennes et al. (2005) identified for the first time lines of germanium (Ge iv) in a HST observation and determined .
6.2 FUSE and HST
Pure hydrogen models were used to fit the Lyman lines. We found = K and (Fig. 15). Also plotted are the line profiles of one of our models that has parameters that are essentially equal to those found by Barstow et al. (2003a) from their Lyman-line analysis (, ). It can be seen that the differences between the two sets of profiles are rather subtle and the fit quality is similar. We verified for some model parameters that the influence of metal-line blanketing on the line profiles is negligible.
We then determined metal abundances. Some of them can be compared to the results by other authors (Table 4).
Carbon
No C line is detectable. From the absence of the C iii Å multiplet, we find an upper limit of C/H = . All stratified models predict strong C lines, indicating that they clearly overpredict the C abundance.
Oxygen
The result for O is similar. We derive an upper limit of O/H = from the absence of a photospheric O vi resonance doublet. The stratified models strongly overpredict O.
Silicon
Phosphorus
Fitting the P v Å resonance doublet (Fig. 16) gives P/H = . The stratified models predict too strong lines.
Sulfur
From the absence of the S vi Å resonance doublet, we find S/H . The stratified models produce excessively strong lines (Fig. 16).
Iron and Nickel
Fe and Ni lines are not detected in the UV range. We derive upper limits of for both species. Fe and Ni are overpredicted by the stratified models.
Germanium
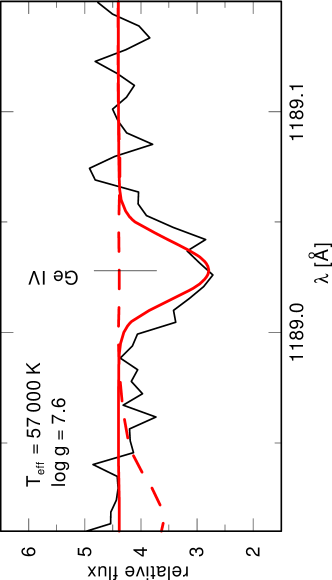
Our fit to the Ge iv Å resonance doublet gives Ge/H (Fig. 17). This is about twice the value derived by Vennes et al. (2005) for a 56 000 K model. The difference can be traced back to NLTE effects (Sect. 3.2.1). The diffusion models drastically underpredict the line strengths. At K and no Ge iv lines are visible.
| WD | Element | Abundance (X/H) | Uncertainty | Ions | Diff. | Literature |
|---|---|---|---|---|---|---|
| LB 1919 | C | C iii | ||||
| O | O vi | |||||
| Si | Si iii+iv | |||||
| P | P v | |||||
| S | S iv+vi | |||||
| Fe | Fe v | |||||
| Ni | Ni v | |||||
| GD 246 | C | C iii | ||||
| O | O vi | a | ||||
| Si | Si iv | b | ||||
| c | ||||||
| a | ||||||
| P | P v | c | ||||
| b | ||||||
| S | S vi | b | ||||
| Ge | Ge iv | d | ||||
| Fe | Fe v | b | ||||
| a | ||||||
| Ni | Ni v | a |
6.3 EUVE
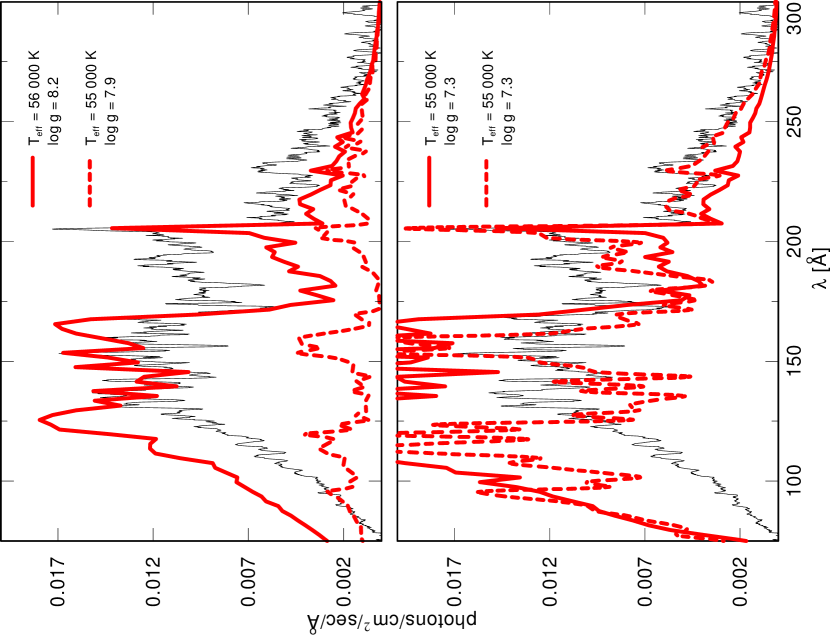
Two types of models were calculated. Both include the metals identified in the FUSE observation (the homogeneous models with the determined abundances, and C and O set to their upper limits). For one type of models, Fe is added, and the other type includes Fe plus Ni (setting Fe/H = and Ni/H = in the homogeneous models). Fig. 18 shows that the stratified models with Fe as heaviest element provide a better fit to the observation than the models also including Ni. A gravity of is needed, which is significantly higher than the result of the Lyman-line fits. The homogeneous models fail completely in reproducing the EUVE SED, whis is in agreement with the results of Landenberger-Schuh (2005).
6.4 Chandra
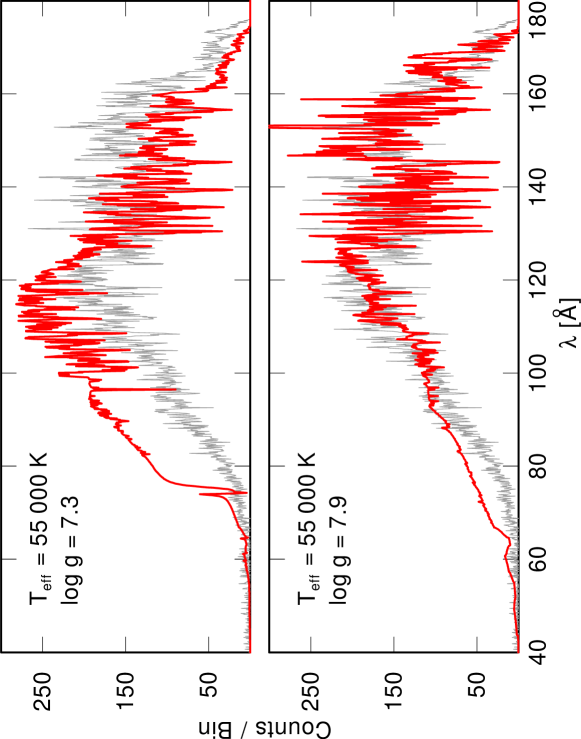
Vennes & Dupuis (2002) detected Fe lines in the Chandra spectrum of GD 246. They are identified in Fig. 19. Their NLTE analysis indicated .
Fig. 20 displays our best fits using the homogeneous and stratified model types as employed for the EUVE analysis. In general, as in the EUVE case, models excluding Ni fit better. The final homogeneous model fits worse than the Ni-truncated stratified model, and with an unrealistically low gravity of = 7.3. The best-fit (Ni-truncated) stratified model gives and that is in accordance with the most recent NLTE Balmer-line analysis of Gianninas et al. (2011); see Fig. 14. From the homogeneous models, we confirm the Fe abundance derived by Vennes & Dupuis (2002).
6.5 Mass and distance
With K, , , , E(BV) = 0.0011, we derive and pc.
6.6 Summary on GD 246
Our Lyman-line fit gave = 57 000 K and = 7.6. The Balmer-line fit by Gianninas et al. (2011) resulted in a similar temperature (56 160 K) but at a significantly higher gravity (7.98). With our parameters, the stratified model compared to the FUSE data overpredicts C, O, Fe, Ni, P, and S, but underpredicts Ge. That result remains essentially valid for stratified models with increased gravity ( = 7.9).
No acceptable fit to the EUVE spectrum was achieved. The gravity of the best fit homogeneous model is too low ( = 7.3), while that of the best-fit stratified model is too high ( = 8.2). It must be stressed that in both cases the formally best fits are very poor.
For fitting the Chandra spectrum, the stratified models are only better than the homogeneous models when Ni is arbitrarily removed. The best-fit stratified model has then = 7.9, which is closer to the Balmer-line than to the Lyman-line result. However, the fits deteriorate when Ni is included. But even when Ni is excluded, the best-fit stratified model is not satisfactory. We conclude that stratified models do not predict correctly the individual element abundances. This conclusion is corroborated by the FUSE analysis.
7 PG 1520+525
7.1 Previous investigations
The first analysis of PG 1520+525 (WD 1520+525) based on optical spectra was performed by Werner et al. (1991) and gave = K and = . A first indication that the temperature exceeds 140 000 K was derived from the shape of an EUVE spectrum (Werner et al. 1996). Utilizing UV spectra, Dreizler & Heber (1998) found = K and = . These parameters, as well as the He, C, O, and Ne abundances (Werner et al. 2004b), are given in Table 5.
7.2 Chandra analysis
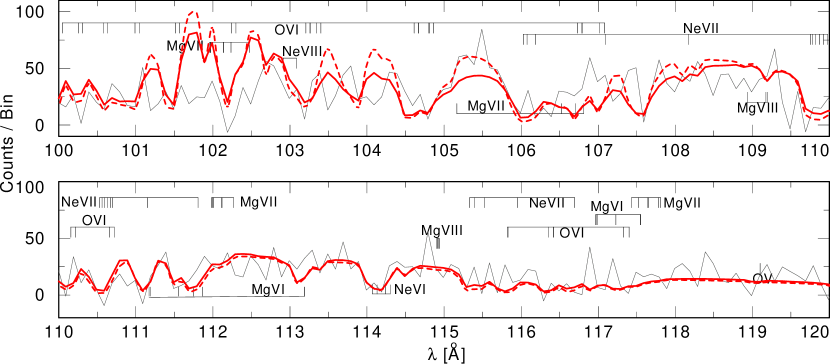
Most counts in the Chandra spectrum are located in the 100–120 Å region. At longer wavelengths, the ISM absorbs the photospheric flux, while at shorter wavelengths, the flux decreases due to photospheric O vi bf absorptions. Although the S/N ratio is rather poor, it is possible to identify individual lines from O vi and Ne vii (Fig. 22). The identification of Mg lines is ambiguous. For a detailed list of possible lines in this wavelength range we refer to the analysis of H 1504+65 (Werner et al. 2004a).
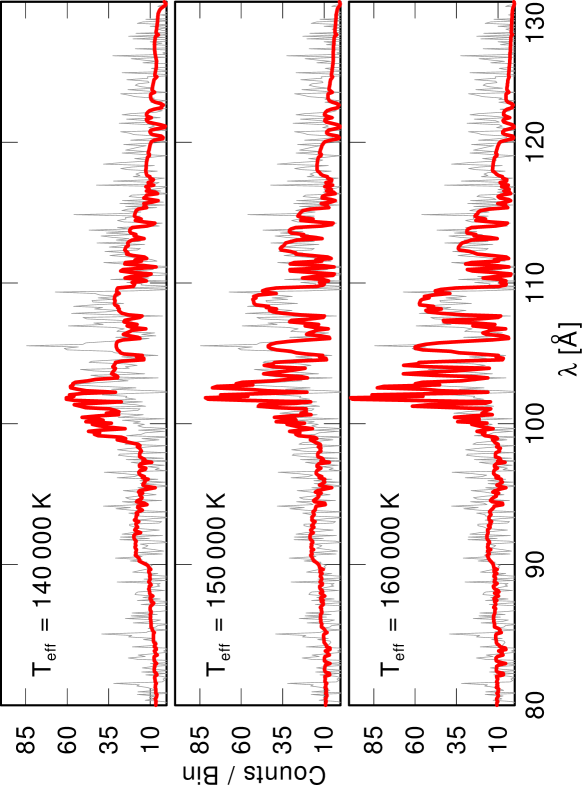
We have calculated a small grid of models for = 140 000 K, 150 000 K, 160 000 K, and = 6.4, 7.0, 7.5. We kept fixed the He/C/O/Ne abundance ratio but varied the Mg abundance from solar to ten times solar in order to derive an upper limit.
The fit is hardly affected by the particular choice of log . Instead, is the most sensitive parameter. Mainly judging from the spectral slope, we find the best fit at = K adopting = (Fig. 22). This confirms the previous temperature determination from UV/optical results, but the Chandra spectrum allows no further reduction of the error bar.
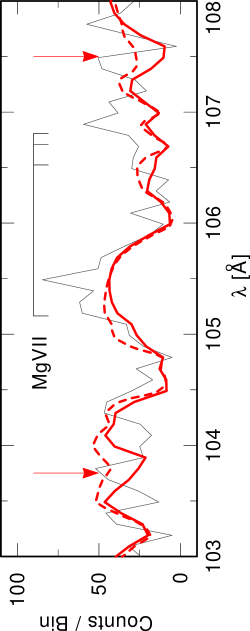
A change in the Mg abundance from solar to ten times solar affects the strength of the lines only marginally, and it is not clear which abundance is more likely to fit the observation (Fig. 23). The flux of the models is also affected in regions where no Mg lines are expected. This can be explained by the occurrence of autoionization features in the bf cross sections. These resonances can be strong and narrow, looking like a common absorption line (Werner et al. 2004a). The wavelengths of these resonances are uncertain and could thus be a possible explanation for unidentified features in the observed spectrum.
7.3 Summary on PG 1520+525
Our analysis of the Chandra spectrum gives an independent confirmation of the result on derived from previous UV spectroscopy ( K, assuming = ).
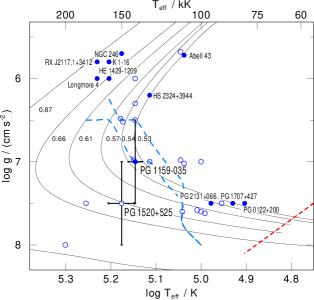
As outlined in Sect. 2.2, we may use this result to draw conclusions on the location of the blue edge of the GW Vir instability region, which is confined by the non-pulsator PG 1520+525 and the pulsator PG 1159035. The position of both stars in the – diagram is displayed in Fig. 24. Also shown there is the theoretical location of the blue edge predicted by Quirion et al. (2007) assuming He/C/O mass fractions of 0.4/0.4/0.2 in the stellar envelope, which is within error limits identical to the abundances found in both stars (Table 5). Besides these element abundances, the exact location of the edge depends on the metallicity; therefore, it is shown here for and . The edge moves to higher effective temperatures with increasing . The line is appropriate for the two stars considered here, because we had found solar Fe abundance in them (Werner et al. 2011). It can be seen that the theoretical position of the edge runs between the location of both stars, very close to PG 1159035.
Also shown in Fig. 24 are other PG 1159 stars in which pulsations were looked for (taken from the compilation in Werner & Herwig 2006). The location of nonpulsators redward of the indicated blue edge is possibly due to their different chemical composition compared to PG 1159035, because the composition affects the position of the instability strip (Quirion et al. 2007).
| PG 1520+525 | PG 1159–035 | |
| [K] | ||
| (cgs) | ||
| He | 0.43 | 0.33 |
| C | 0.38 | 0.48 |
| O | 0.17 | 0.17 |
| Ne | 0.02 | 0.02 |
| Mg | 0.006 | |
| Fe | 0.0013 | 0.0013 |
8 Summary and Conclusions
We analyzed the Chandra spectra of three hot WDs. Two of them are H-rich WDs and the other one is a H-deficient PG 1159 star.
8.1 The DA white dwarfs LB 1919 and GD 246
The primary aim of our Chandra observation of LB 1919 was to explain its relatively low metallicity compared to similar objects as suggested by previous analyses of EUVE spectra. It turned out that no metal features were detected in the Chandra spectrum. The same result was found from our analysis of a FUSE spectrum. In essence, all data are compatible with the assumption that LB 1919 has a pure hydrogen atmosphere. This is in conflict with our stratified models. In them, the vertical run of individual element abundances is computed from the assumption of equilibrium between gravitational downward pull and radiative upward acceleration, i.e., the metal abundances are not free parameters but computed as functions of and . They predict that significant amounts of light and heavy metals should be accumulated and readily detectable in the atmosphere of LB 1919.
A few other hot DAs with similar parameters that also do not have detected metals are known (Barstow et al. 2003b); one famous example is HZ 43A ( = 51 000 K, = 7.9, Beuermann et al. 2006). The reason for the purity of their atmospheres is completely unknown. It may be speculated that these peculiar DAs have no heavy-element reservoir that is assumed to be present in the radiative levitation calculations. Barstow et al. (2003b) consider whether the possible depletion of those reservoirs by selective mass-loss could be responsible for that phenomenon or whether the progenitors were metal-poor. They argue that, for radiation-driven winds, mass loss should be lower in the pure H stars than in those containing heavy elements, because the wind is driven by metal lines. Furthermore, these WDs are local disc objects, so it seems unlikely that any of the progenitors could have been metal poor.
We have also analyzed an archival Chandra observation of the hot DA GD 246. Our work was motivated by the fact that this is the only DA that exhibits individual metal-line features in the soft X-ray range. As for LB 1919, we utilized chemically homogeneous as well as stratified models. While we in principle expect that the stratified models are a better representation, the Chandra observation cannot be fitted satisfactorily by either type of model. A better fit by stratified models is only achieved when nickel is removed artificially. Otherwise, the atmospheric opacity becomes much too large because of a strong overprediction of nickel. In comparison with the FUSE spectrum, most metals are overpredicted, but at the same time, another one (Ge) is underpredicted. In the latter case, one can speculate that the model atoms are still too small, not having enough line transitions to absorb photon momentum. The overprediction of most metals, however, is more of a problem. We can only speculate that an additional physical mechanism, ignored by our models, is affecting the equilibrium abundances, e.g., (selective) mass-loss or weak magnetic fields.
The complete failure of our model atmospheres, homogeneous or stratified, to fit the EUVE observation reinforces the conclusion that some physics is missing. The same conclusion was drawn by Barstow et al. (2003b) from the fact that UV spectra from DAs with similar and display a wide variety of metal abundances. These authors considered the possibility that accretion of interstellar or circumstellar matter could cause this variety. Recent investigations have revealed the frequent incidence of dust debris disks around WDs (e.g., Farihi 2011) that are composed of disrupted planetary material. In order to test the influence of accretion of such material on the observed photospheric abundances, this effect would have to be included in the diffusion/levitation models in a manner performed (e.g., by Koester 2009) in cooler WDs in which radiative levitation is negligible. However, it is difficult to understand how an external supply of material would resolve the problem of present diffusion models generally overpredicting metal abundances.
Our analysis of the two DAs comprised the derivation of effective temperature and gravity from the Lyman lines, and the resulting parameters were compared to published results from Balmer-line analyses. We confirm previous findings that conflicting results are obtained from the UV and optical line profile analyses. In particular, Balmer-line temperatures are often significantly lower than Lyman-line temperatures (Barstow et al. 2003a). We found that LB 1919 is another rare case where the opposite effect was found. While this obviously points to a shortcoming in the WD atmosphere models, there is no indication as to which physical ingredient is treated inadequately or is missing. These uncertainties in the derived atmospheric parameters add to the problems in a detailed quantitative comparison, element by element, of observed metal abundances with predictions from radiative levitation models.
8.2 The PG 1159 star PG 1520+525
The Chandra spectrum of the nonpulsator PG 1520+525 was used to constrain its effective temperature and to compare it with that of the pulsator PG 1159035. They both confine empirically the blue edge of the GW Vir instability region for a particular envelope composition. The position of the edge predicted by the nonadiabatic pulsation models of Quirion et al. (2007) is consistent with the spectroscopic results. This is strong proof for the predictive power of these models. The interior structure of PG 1159 stars that is inferred by their usage appears to be very reliable, so that corresponding asteroseismologic analyses are based on solid ground.
Acknowledgements.
We thank the referee for a thorough and constructive report. JA and TR were supported by the German Research Foundation (DFG) under grant WE 1312/39-1 and the German Aerospace Center (DLR) under grant 05 OR 0806, respectively. JJD was supported by NASA contract NAS8-39073 to the Chandra X-ray Center during the course of this work. This research has made use of the SIMBAD database, operated at CDS, Strasbourg, France. Some of the data presented in this paper were obtained from the Mikulski Archive for Space Telescopes (MAST). STScI is operated by the Association of Universities for Research in Astronomy, Inc., under NASA contract NAS5-26555. Support for MAST for non-HST data is provided by the NASA Office of Space Science via grant NNX09AF08G and by other grants and contracts.References
- Althaus & Benvenuto (1998) Althaus, L. G. & Benvenuto, O. G. 1998, MNRAS, 296, 206
- Barstow et al. (1997) Barstow, M. A., Dobbie, P. D., Holberg, J. B., Hubeny, I., & Lanz, T. 1997, MNRAS, 286, 58
- Barstow et al. (2003a) Barstow, M. A., Good, S. A., Burleigh, M. R., et al. 2003a, MNRAS, 344, 562
- Barstow et al. (2002) Barstow, M. A., Good, S. A., Holberg, J. B., et al. 2002, MNRAS, 330, 425
- Barstow et al. (2003b) Barstow, M. A., Good, S. A., Holberg, J. B., et al. 2003b, MNRAS, 341, 870
- Beuermann et al. (2006) Beuermann, K., Burwitz, V., & Rauch, T. 2006, A&A, 458, 541
- Chayer et al. (1995a) Chayer, P., Fontaine, G., & Wesemael, F. 1995a, ApJS, 99, 189
- Chayer et al. (2001) Chayer, P., Kruk, J. W., Vennes, S., & Dupuis, J. 2001, in ASP-CS, Vol. 226, 12th European Workshop on White Dwarfs, ed. J. L. Provencal, H. L. Shipman, J. MacDonald, & S. Goodchild , 90
- Chayer et al. (2005) Chayer, P., Vennes, S., Dupuis, J., & Kruk, J. W. 2005, ApJ, 630, L169
- Chayer et al. (1995b) Chayer, P., Vennes, S., Pradhan, A. K., et al. 1995b, ApJ, 454, 429
- Drake & Werner (2005) Drake, J. J. & Werner, K. 2005, ApJ, 625, 973
- Dreizler (1999) Dreizler, S. 1999, A&A, 352, 632
- Dreizler & Heber (1998) Dreizler, S. & Heber, U. 1998, A&A, 334, 618
- Farihi (2011) Farihi, J. 2011, in American Institute of Physics Conference Series, Vol. 1331, American Institute of Physics Conference Series, ed. S. Schuh, H. Drechsel, & U. Heber, 193
- Finley et al. (1997) Finley, D. S., Koester, D., & Basri, G. 1997, ApJ, 488, 375
- Fitzpatrick (1999) Fitzpatrick, E. L. 1999, PASP, 111, 63
- Fleming et al. (1996) Fleming, T. A., Snowden, S. L., Pfeffermann, E., Briel, U., & Greiner, J. 1996, A&A, 316, 147
- Gianninas et al. (2011) Gianninas, A., Bergeron, P., & Ruiz, M. T. 2011, ApJ, 743, 138
- Gonzalez et al. (1995) Gonzalez, J.-F., LeBlanc, F., Artru, M.-C., & Michaud, G. 1995, A&A, 297, 223
- Heber et al. (1984) Heber, U., Hunger, K., Jonas, G., & Kudritzki, R. P. 1984, A&A, 130, 119
- Jahn et al. (2007) Jahn, D., Rauch, T., Reiff, E., et al. 2007, A&A, 462, 281
- Koester (2009) Koester, D. 2009, A&A, 498, 517
- Koester et al. (2009) Koester, D., Voss, B., Napiwotzki, R., et al. 2009, A&A, 505, 441
- Kurucz (2009) Kurucz, R. L. 2009, in: Recent Directions in Astrophysical Quantitative Spectroscopy and Radiation Hydrodynamics, eds. I. Hubeny, J. M. Stone, K. MacGregor, & K. Werner, AIP Conf. Proc., Vol. 1171, 43
- Lajoie & Bergeron (2007) Lajoie, C. & Bergeron, P. 2007, ApJ, 667, 1126
- Landenberger-Schuh (2005) Landenberger-Schuh, S. 2005, PhD thesis, University of Tübingen
- Liebert et al. (2005) Liebert, J., Bergeron, P., & Holberg, J. B. 2005, ApJS, 156, 47
- Limoges & Bergeron (2010) Limoges, M.-M. & Bergeron, P. 2010, ApJ, 714, 1037
- Michaud (1970) Michaud, G. 1970, ApJ, 160, 641
- Miller Bertolami & Althaus (2006) Miller Bertolami, M. M. & Althaus, L. G. 2006, A&A, 454, 845
- Napiwotzki et al. (1999) Napiwotzki, R., Green, P. J., & Saffer, R. A. 1999, ApJ, 517, 399
- Nath Dutta & Majumder (2011) Nath Dutta, N. & Majumder, S. 2011, ApJ, 737, 25
- Oliveira et al. (2003) Oliveira, C. M., Hébrard, G., Howk, J. C., et al. 2003, ApJ, 587, 235
- Pease et al. (2000) Pease, D. O., Drake, J. J., Johnson, C. O., et al. 2000, in Society of Photo-Optical Instrumentation Engineers (SPIE) Conference Series, Vol. 4012, Society of Photo-Optical Instrumentation Engineers (SPIE) Conference Series, ed. J. E. Trümper & B. Aschenbach, 700
- Quirion et al. (2006) Quirion, P., Fontaine, G., & Brassard, P. 2006, Memorie della Societa Astronomica Italiana, 77, 53
- Quirion et al. (2007) Quirion, P.-O., Fontaine, G., & Brassard, P. 2007, APJS, 171, 219
- Rauch & Deetjen (2003) Rauch, T. & Deetjen, J. L. 2003, in: Workshop on Stellar Atmosphere Modeling, eds. I. Hubeny, D. Mihalas, K. Werner, ASP-CS, Vol. 288, p. 103
- Rauch et al. (1994) Rauch, T., Köppen, J., & Werner, K. 1994, A&A, 286, 543
- Schuh et al. (2002) Schuh, S. L., Dreizler, S., & Wolff, B. 2002, A&A, 382, 164
- Seaton (1962) Seaton, M. J. 1962, in Atomic and Molecular Processes, ed. D. R. Bates, 375
- Sommerfeld (1939) Sommerfeld, A. 1939, Atombau und Spektrallinien, vol. 2, 3. Ausgabe, Braunschweig, Vieweg & Sohn
- Tremblay & Bergeron (2009) Tremblay, P.-E. & Bergeron, P. 2009, ApJ, 696, 1755
- Unglaub & Bues (1997) Unglaub, K. & Bues, I. 1997, A&A, 321, 485
- van Regemorter (1962) van Regemorter, H. 1962, ApJ, 136, 906
- Vennes et al. (2005) Vennes, S., Chayer, P., & Dupuis, J. 2005, ApJ, 622, L121
- Vennes & Dupuis (2002) Vennes, S. & Dupuis, J. 2002, in ASP-CS, Vol. 262, The High Energy Universe at Sharp Focus: Chandra Science, ed. E. M. Schlegel & S. D. Vrtilek, 57
- Vennes et al. (1993) Vennes, S., Dupuis, J., Rumph, T., et al. 1993, ApJ, 410, L119
- Vennes et al. (1997) Vennes, S., Thejll, P. A., Galvan, R. G., & Dupuis, J. 1997, ApJ, 480, 714
- Welsh et al. (1999) Welsh, B. Y., Sfeir, D. M., Sirk, M. M., & Lallement, R. 1999, A&A, 352, 308
- Werner (2008) Werner, K. 2008, in The Universe in X-Rays, ed. Trümper, J. E. & Hasinger, G., (Springer: Berlin), p. 133
- Werner et al. (2003) Werner, K., Deetjen, J. L., Dreizler, S., et al. 2003, in ASP-CS, Vol. 288, Stellar Atmosphere Modeling, ed. I. Hubeny, D. Mihalas, & K. Werner, 31
- Werner et al. (1996) Werner, K., Dreizler, S., Heber, U., & Rauch, T. 1996, in IAU Colloq. 152: Astrophysics in the Extreme Ultraviolet, ed. S. Bowyer & R. F. Malina, 229
- Werner et al. (1991) Werner, K., Heber, U., & Hunger, K. 1991, A&A, 244, 437
- Werner & Herwig (2006) Werner, K. & Herwig, F. 2006, PASP, 118, 183
- Werner et al. (2004a) Werner, K., Rauch, T., Barstow, M. A., & Kruk, J. W. 2004a, A&A, 421, 1169
- Werner et al. (2011) Werner, K., Rauch, T., Kruk, J. W., & Kurucz, R. L. 2011, A&A, 531, A146
- Werner et al. (2004b) Werner, K., Rauch, T., Reiff, E., Kruk, J. W., & Napiwotzki, R. 2004b, A&A, 427, 685
- Wolff et al. (1998) Wolff, B., Koester, D., Dreizler, S., & Haas, S. 1998, A&A, 329, 1045
- Wolff et al. (2001) Wolff, B., Kruk, J. W., Koester, D., et al. 2001, A&A, 373, 674