An empirical prediction for stellar metallicity distributions in nearby galaxies
Abstract
We combine star-formation histories derived from observations of high redshift galaxies with measurements of the relation between gas-phase metallicity, stellar mass, and star formation rate to make an explicit and completely empirical connection between near-field and distant galaxy observations. Our approach relies on two basic assumptions: 1) galaxies’ average paths through time in stellar mass vs. star formation rate space are represented by a family of smooth functions that are determined by the galaxies’ final stellar mass, and 2) galaxies grow and become enriched with heavy elements such that they always evolve along the mass–metallicity–star formation rate relation. By integrating over these paths, we can track the chemical evolution of stars in galaxies in a model independent way, without the need for explicit assumptions about gas inflow, outflow, or star formation efficiency. Using this approach, we present predictions of stellar metallicity (i.e., O/H) distribution functions for present day star-forming galaxies of different stellar masses and the evolution of the -element stellar metallicity-mass relation since . The metallicity distribution functions are fairly well described as Gaussians, truncated at high metallicity, with power-law tails to low metallicity. We find that the stellar metallicity distribution for Milky Way mass galaxies is in reasonable agreement with observations for our Galaxy, and that the predicted stellar mass vs. mean stellar metallicity relation at agrees quite well with results derived from galaxy surveys. This validates the assumptions that are implicit in our simple approach. Upcoming observations will further test these assumptions and their range of validity, by measuring the mean stellar mass-metallicity relation up to , and by measuring the stellar metallicity distributions over a range of galaxy masses.
keywords:
stars: abundances — ISM: abundances — Galaxy: abundances — Galaxy: stellar content — galaxies: abundances — galaxies: evolution — galaxies: stellar content1 Introduction
As stars are born with the imprint of the elemental abundances in their gaseous birth environments, measurements of stellar metallicities within galaxies can be used to gain insight into their star formation and chemical histories (Tinsley, 1975; Tinsley & Larson, 1978; Bland-Hawthorn et al., 2010). In this paper, we carry out an explicit test of the self-consistency between empirically derived star formation histories, observational scaling relations between gas phase metallicity (), stellar mass (), and star formation rate (), and observed stellar metallicities at .
It has long been known that there is a strong positive correlation between the luminosity or stellar mass of star forming galaxies and their galaxy-averaged gas-phase abundance (Garnett & Shields, 1987; Zaritsky et al., 1994). This relationship (the “mass-metallicity relation”) has now been measured for large samples of nearby galaxies (e.g. Tremonti et al., 2004; Kobulnicky & Kewley, 2004; Kewley & Ellison, 2008) and for smaller samples of distant galaxies out to (Savaglio et al., 2005; Shapley et al., 2005; Erb et al., 2006; Maiolino et al., 2008; Mannucci et al., 2009). The normalization, slope, scatter, and evolution of the observed mass-metallicity relation place strong constraints on theoretical models of galaxy formation, in particular on the physics of feedback from massive stars and supernovae. Recently, it has been suggested that the scatter in the observed mass-metallicity relation can be reduced by considering the star formation rate as a third parameter (Lara-López et al., 2010; Mannucci et al., 2010). Physically, the star formation rate is probably acting as a proxy for the galaxy gas fractions, as galaxies with higher gas fractions have both higher star formation rates and more diluted metals (Hughes et al., 2012). Moreover, Lara-López et al. and Mannucci et al. find that galaxies up to (e.g., Savaglio et al., 2005; Erb et al., 2006) appear to always lie on the same -- “fundamental” relation, though this may begin to break down at (Maiolino et al., 2008, though see also Yabe et al., 2012). It is not yet clear whether or why a non-evolving mass–metallicity–star-formation rate relation should be generically expected, although some cosmological models do predict this (Davé et al., 2012; M. Arrigoni et al. in preparation). Self-regulation due to stellar-driven outflows is usually invoked in this context (Finlator & Davé, 2008; Spitoni et al., 2010; Peeples & Shankar, 2011; Davé et al., 2011; Dayal et al., 2012).
There is a long history in the literature of attempts to model the chemical evolution of galaxies using a “classical” approach, the simplest version of which is the “closed box”, in which galaxies start out with all of their mass in the form of pristine gas, and convert some fraction of that gas to stars, producing a certain “yield” of heavy elements along the way. It was quickly realized that the simplest closed box picture could not reproduce observations, in particular of the distribution of stellar metallicities in the Solar Neighborhood in our Galaxy (the “G-dwarf” problem), leading to modifications such as inflowing pristine or pre-enriched gas as well as outflows of gas and metals (Lynden-Bell, 1975; Pagel, 1989; Colavitti et al., 2008). While much has been learned from this approach, it has the obvious drawback that the results tend to be dependent on the rather arbitrary functions adopted for the inflow and outflow rates.
Another approach that has become fairly widely used is the coupling of detailed chemical evolution models with cosmological models of galaxy formation, realized in the form of either numerical hydrodynamic simulations (Scannapieco et al., 2006; Kobayashi et al., 2007; Brooks et al., 2007; Mouhcine et al., 2008; Oppenheimer & Davé, 2008; Wiersma et al., 2009) or semi-analytic models (De Lucia et al., 2004; Nagashima et al., 2005; Somerville et al., 2008; Arrigoni et al., 2010). These have the advantage that quantities such as the rate of inflow of gas into galaxies is motivated by the formation rate of structure in the Cold Dark Matter (CDM) paradigm that provides the backbone for these models, and outflow rates are also governed by physically motivated scalings. However, they suffer from the drawback that currently, all CDM-based galaxy formation simulations, whether numerical or semi-analytic, apparently fail to reproduce the observed scaling of star formation history functional form with galaxy mass (sometimes referred to as “downsizing”; see Fontanot et al., 2009 for a detailed discussion).
Here we propose a different approach to modeling the buildup of metals in galaxies that sidesteps some of the problems with both the classical and cosmological methods. We make use of a family of parameterized empirical star formation histories, derived from observations of the stellar mass vs. star formation rate relation at different redshifts by Leitner (2012). These empirically-derived star formation histories are in good agreement with those derived from spectral energy distribution modeling and the evolution of the stellar-halo mass relation (Zheng et al., 2007; Conroy & Wechsler, 2009; Behroozi et al., 2012; Moster et al., 2012). We assume that the average star formation history for galaxies with a given stellar mass today can be represented by this smooth functional form. This assumption is supported by mounting observational evidence that galaxies with masses of roughly the Milky Way or lower ( few ) build up most of their mass through smooth accretion of gas, with mergers and starbursts playing a relatively minor role (Noeske et al., 2007; Robaina et al., 2009; Oliver et al., 2010; Karim et al., 2011; Leitner, 2012). This is also supported by results from cosmological simulations (Brooks et al., 2009; Hirschmann et al., 2012; Tissera et al., 2012). Then, once stellar mass loss and recycling has been accurately accounted for (Leitner & Kravtsov, 2011), the growth of galaxies can be traced through cosmic time by stepping along these relations as a function of redshift.
We make a second assumption, that galaxies always evolve along the -- relation. That means that as galaxies evolve along their trajectories in - space (specified by their star formation history), we assume that the stars born at that moment form out of gas with a metallicity given by the -- relation. In this way, we can build up the distribution function of stellar metallicities for galaxies with different masses at . We can also test whether the two assumptions of empirical star formation histories plus a non-evolving -- relation lead to an average stellar metallicity relation at that agrees with observations. Both of these quantities will be better constrained observationally over a wider range of galaxy masses, and to higher redshift, in the near future.
This paper is organized as follows. In § 2, we describe our adopted and predicted scaling relations connecting galaxy stellar masses, star formation rates, and gas-phase metallicities across cosmic time. In § 3 we present the stellar metallicity distribution functions and evolution of the stellar metallicity-mass relation predicted by this model. We conclude with a brief discussion of relevant implications in § 4.
Throughout we assume a Chabrier (2003) stellar initial mass function (integrated over –) and (Asplund et al., 2009), although we note that the 8.9 value found from helioseismology (Delahaye & Pinsonneault, 2006) would lead to dex lower values than stated here. Following Leitner (2012), we adopt a flat CDM cosmology with and .
2 Evolution of Scaling Relations
The model we present here is based on two simple assumptions: 1) galaxies’ average star formation histories are given by the empirical functions provided by Leitner (2012), in which their stellar mass determines the shape of their star formation histories. 2) Galaxies evolve along a “fundamental” -- relation that is itself unchanging with redshift. Taken together, these pieces provide a unique enrichment history for an average galaxy of a given present day stellar mass . In this section we describe these two pieces of our model, where they come from, and some caveats, in a bit more detail.
The starting point for the first piece of the model is measurements of galaxy stellar masses and star formation rates from to 2.5 by Karim et al. (2011), from the COSMOS survey. It is now well established that and show a fairly tight and nearly linear relationship which evolves in normalization, but very little in slope, over a very broad redshift range (Noeske et al., 2007; Daddi et al., 2007; Karim et al., 2011; Elbaz et al., 2011). These results of course represent snapshots of different galaxy populations at different cosmic times. Leitner (2012) first fit power laws to these snapshots in time, using the results measured by Karim et al. (2011),
| (1) |
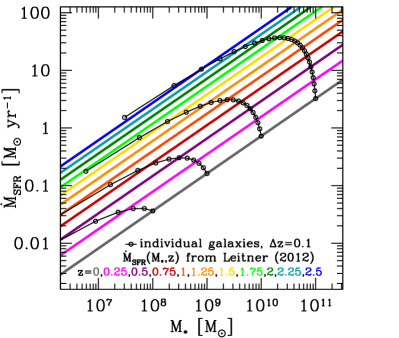
where Gyr-1, , and . He then characterized how individual galaxies would have to grow over time in vs. such that the evolution of these relations would be satisfied, accounting for mass loss and recycling from evolving stellar populations using the method presented in Leitner & Kravtsov (2011). Thus, these relations can be integrated to give the star-formation history for a galaxy of a given stellar mass at , 111A similar approach, with qualitatively similar results, has been presented by Noeske et al., 2007. The top left panel of Figure 1 shows the fits representing the population averages at different redshifts, with the trajectories of individual galaxies of different overplotted.
The two obvious limitations of this method are that it only describes galaxies that are actively forming stars at (i.e., there is no accounting for a galaxies that cease forming stars and “fall off” of these relations) and that it is only valid up to redshifts and stellar masses where the - relation is reliably measured. However, the majority of galaxies with stellar masses in the range are on the “star forming main sequence” (Brinchmann et al., 2004; Salim et al., 2007; Kimm et al., 2009), i.e. on the relations used to derive the Leitner (2012) star formation histories. Based on observational estimates of merger rates (Robaina et al., 2009), the scatter in the observed - relation (Noeske et al., 2007), and theoretical predictions (Brooks et al., 2009), galaxies in this mass range are expected to build up the majority of their mass through smooth accretion, with mergers and starbursts playing a minor role. On the second point, the star formation histories Leitner derives from Karim et al.’s data are not entirely reliable at due to observational uncertainties (i.e., the redshifts for which has not been well-measured for ). We further note that the star formation histories for galaxies at are entirely based on extrapolations, as the progenitors of these galaxies cannot currently be observed at higher redshift. This is true to some extent at somewhat higher masses as well (), with extrapolation becoming less important as increases. Leitner notes that the star formation histories derived for galaxies predict a much larger fraction of recent star formation than those derived from resolved stellar population studies: the Leitner star formation histories for these low mass galaxies imply that all of their star formation takes place at , while the resolved stellar population studies indicate that a significant fraction of past star formation occurred at (Weisz et al., 2011).
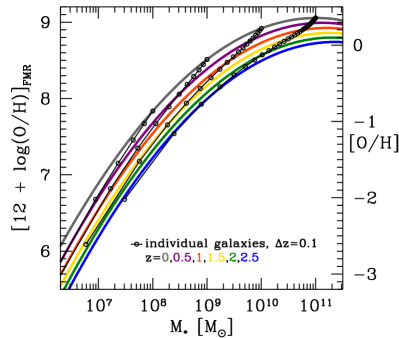
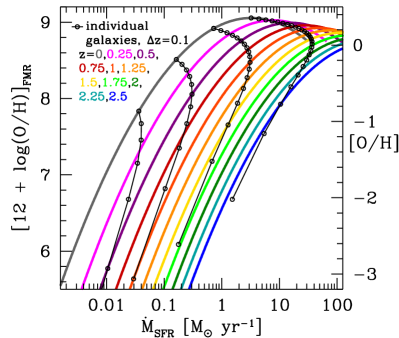
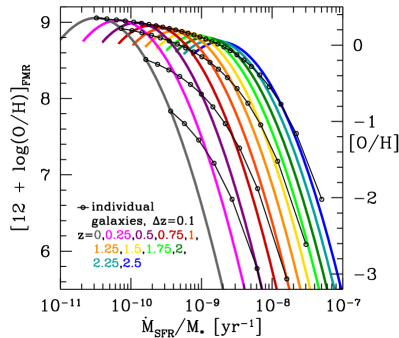
The other three panels show the predicted evolution of the -, -, and - relations, where for the gas-phase metallicity we plot the observable as would be measured from star-forming H II regions derived from the -- relation. While several fits to the -- relation exist in the literature, we choose to calculate metallicities from the double-quadratic fit
| (2) |
where and , fit to Sloan Digital Sky Survey (SDSS) data by Mannucci et al. (2010). Mannucci et al. postulate that this so-called “fundamental metallicity relation” (FMR) holds at all redshifts, and show that the observed galaxies fall along this relation when extrapolated to higher star formation rates. Equation (2) is fit over the ranges and (see Mannucci et al. 2010 for the exact bins used in their calculation); we must extrapolate outside of this range in order to describe the metallicity evolution of galaxies at . This parameterization is not Mannucci et al.’s best fit to the data, but we find that this functional form is better suited to the necessary extrapolation than alternatives. Specifically, Equation (2) will under-predict the metallicities for low-mass galaxies, compared to a more robust fit using as the independent variable,
| (3) |
where (Mannucci et al., 2010). Unfortunately, this quartic parameterization leads to an up-turn in when extrapolated to low ; while no extrapolation in from to is needed to describe observed galaxies, extrapolation is required to describe the evolution of the local galaxies we wish to characterize. Finally, Lara-López et al. (2010) describe the relation between stellar mass, gas-phase metallicity, and star formation rate as a plane,
| (4) |
We choose, however, to not adopt this formulation because it gives even lower metallicities at high-redshift than Equation (2), while overestimating metallicities at high .
Finally, we note that uncertainties in the calibration methods for determining compound the difficulty in accurately characterizing the -- relation (e.g., Kewley & Ellison, 2008); these uncertainties not only affect the slope of the relation, but also its normalization at the dex level.222Comparisons of gas-phase and stellar metallicities could provide an potentially useful avenue for placing combined constraints on “reasonable” ranges for the Solar oxygen abundance, normalization of the mass-metallicity relation, and the nucleosynethetic oxygen yield. Thus it will certainly be possible to improve on the results presented here once the -- relation has been measured to lower masses (e.g., B. Andrews & P. Martini, in preparation) and with more robust metallicity calibrations (e.g., Nicholls et al., 2012; Lopez-Sanchez et al., 2012; M. Dopita et al. in preparation).
From the top-right panel of Figure 1, it is obvious that on short timescales, galaxies evolve along the mean mass-metallicity relation (c.f., Peeples & Shankar, 2011; Davé et al., 2012). Though it is subtle, the mass-metallicity relation evolves slightly more rapidly at low masses than at high masses. The bottom two panels show that this is because massive galaxies asymptotically plateau in their metallicities, while low-mass galaxies are still rapidly evolving at late times. The galaxy tracks in the bottom-left panel of Figure 1 show the metallicities at which galaxies are at the peak of their star formation. In § 3, we integrate along these tracks to derive stellar metallicities as a function of cosmic time.
3 An Empirical Prediction for Stellar Metallicities
Because stars are born with the chemical imprint of the gas they formed out of, by tracing galaxies through the evolutionary tracks plotted in Figure 1, we are able to track—in an average sense—the buildup and change in stellar metallicities in different galaxies. Figure 2 shows the distribution of the stellar [/H] within individual galaxies of different at and the predicted relation between galaxy-averaged metallicities () and . Though the distribution of stellar [Fe/H] has been well-measured for the Milky Way (e.g., Ivezić et al., 2008), [/H] has not been as well characterized.333In an effort to keep our model as empirically-based as possible, we do not try to model Iron production directly. The histograms in the top panel of Figure 2 are based on all star formation, and thus are only applicable for comparing to metallicity distributions of low-mass stars, such as for the upcoming SDSS-III APO Galactic Evolution Experiment (APOGEE) observations of the Milky Way (Allende Prieto et al., 2008; Eisenstein et al., 2011) and dwarf Irregular galaxies in the Local Group (E. Kirby et al. in preparation; see also Kirby et al., 2010, 2011a). We note that our assumption that all galaxies of a given present-day stellar mass follow the same smooth star formation history may tend to underestimate the width of the ensemble-averaged stellar metallicity distribution function. It is well known that galaxies have somewhat stochastic star formation histories (although apparently they typically do not deviate from the star forming main sequence by more than a factor of 2–3; Noeske et al., 2007), and that the overall shape of the star formation history can show considerable diversity from galaxy to galaxy, particularly for low mass objects (e.g., Weisz et al., 2011). These effects would tend to broaden the predicted metallicity distribution function and to lead to a corresponding galaxy-to-galaxy diversity in this quantity. However, they should not significantly affect our predictions for the galaxy- and ensemble-averaged mass metallicity scaling relations that we discuss below.
The (bright green) distribution is included for comparison to the Milky Way (Klypin et al., 2002); we also show the distribution of [O/H] as measured for 72 local disk stars by (Bensby et al., 2004), though we caution that it is unclear the extent to which these stars are representative of the entire Milky Way. The dashed portions denote where Equation (2) has been extrapolated. At higher stellar masses, the metallicity distribution functions turn over; this is directly related to the decline in star formation rates at later times, resulting in the formation of relatively few higher-metallicity stars (see the bottom-left panel of Figure 1). Because the turnover in the star formation histories is relatively slow, the peak in the [O/H] distribution function is at higher metallicity than the [O/H] at which the galaxy is when at its peak star formation rate. Since galaxies are skirting the peak of the - relation (bottom-right panel of Figure 1), they have the nearly maximal stellar [/H] distribution; the turnover in the metallicity scaling relations at high and high is why the and distribution functions are surprisingly similar.
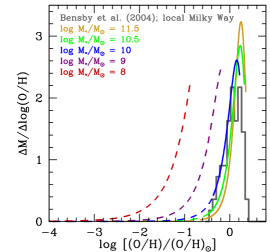
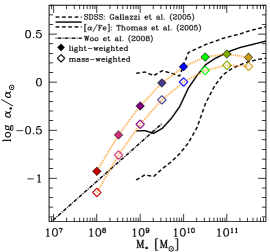
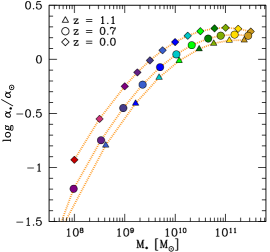
Table 1 gives the distribution functions plotted in the top panel of Figure 2. At (i.e., the regimes that are calculated entirely from extrapolations), the distribution functions at are fairly well described by power-laws of the form
| (5) |
where is the mass fraction in a bin of width , , and and are functions of stellar mass such that
| (6) | |||||
| (7) |
At higher masses, this power-law distribution turns over, such that the high-metallicity distribution is well-described as a truncated Gaussian, where the maximum metallicity is given by the gas-phase metallicity (top-right panel of Figure 1).
| ⋮ | ⋮ |
The bottom two panels of Figure 2 show the galaxy-averaged -element stellar metallicities () as a function of stellar mass at (middle panel) and at and (bottom panel). The open symbols in the middle panel show the stellar mass-weighted mean - relation. Though it is a small effect, mass loss must be taken into account to correctly compute the mass-weighted average for an entire galaxy; we use the methods of Leitner & Kravtsov (2011) for consistency with our adopted star formation histories. The solid symbols denote a -band luminosity weighted mean, which we obtain using the stellar population models of Bruzual & Charlot (2003) and our assumed star formation history. The -band luminosity weighted mean metallicity closely approximates observational estimates of metallicity from spectral lines (Trager & Somerville, 2009). For comparison, we plot the SDSS stellar metallicity-mass relation as measured by Gallazzi et al. (2005).444We note that our model predicts metallicities for stars formed in situ, whereas many star-forming galaxies have a bulge component that is thought to have been formed from the merging of smaller galaxies (e.g., Toomre, 1977; Kormendy & Kennicutt, 2004). Because the SDSS spectra are taken from fibers placed on the central 3″ of each galaxy, the derived metallicities could potentially be highly sensitive to such a bulge component. The Gallazzi et al. measurements are primarily sensitive to iron abundances (A. Gallazzi, private communication), but our model is implicitly tied to oxygen abundances (i.e., elements). Therefore, we renormalize the Gallazzi et al. data using the [/Fe] ratios (relative to Solar) found by Thomas et al. (2005), where
| (8) |
A major caveat of this renormalization is that it is based on measurements of /Fe for elliptical galaxies, which are predominately not forming stars, with an intermediate step of connecting to galaxy velocity dispersions. Furthermore, the Gallazzi et al. (2005) data are for both star-forming and non–star-forming galaxies; in particular, the steep part of the relation is predominately star forming galaxies, while the flatter higher mass portion is predominately passive galaxies. At , the predictions are not robust because of extrapolation of Equation (2) to very high star formation rates.555Interestingly, there is increasing evidence that at high the dependence in on star formation rate reverses (Yates et al., 2012).
Overall, the agreement of our simple model predictions with the observed average stellar metallicity relation is remarkably good over three orders of magnitude. Our prediction for the mean stellar metallicity is in excellent agreement with the Gallazzi et al. (2005) results at around the stellar mass of the Milky Way (few), where they are expected to be the most robust. At stellar masses above , our predicted metallicities turn down, while the Gallazzi et al. (2005) results continue to increase—this is likely because of the breakdown of our assumptions at these high masses, where the local galaxy population is dominated by galaxies that are not on the star forming main sequence, and which are likely to have experienced significant growth through gas-poor mergers (De Lucia & Blaizot, 2007; Skelton et al., 2009).
Between , our predictions overshoot the Gallazzi et al. results slightly but are again in very good agreement with the results of Woo et al. (2008) based on local group galaxies from to a few (a relation that extends four dex further down in ; Kirby et al., 2010, 2011a). However, it is important to note that the Leitner (2012) star formation histories (and the Mannucci et al. 2010 metallicity relation) used in our predictions are entirely extrapolated in this regime. At , the Leitner extrapolated star formation histories differ substantially from the histories derived from the “fossil record” (resolved color magnitude data for individual stars) in nearby dwarf galaxies (Weisz et al., 2011). The Leitner estimates would imply that dwarf galaxies form most of their mass at , while observationally, downsizing reverses in this regime: the Weisz et al. (2011) results imply that they form most of their stars at (see Leitner 2012 for a detailed discussion). In our framework, however, metallicities do not depend on when the metals were made: as long as the ensemble-averaged galaxies remain on the -- relation, the average stellar metallicities will be well-described by our model.666Furthermore, it is intriguing to note that the observed average stellar metallicities in this mass range obey such a tight relation despite the wide range in metallicity distribution functions (Dolphin et al., 2005) and the relatively wide spread in gas-phase abundances (e.g., Zahid et al., 2012a).
Thus, at both low and high masses, it is difficult to compare our predictions to the current observations. Based on this combination of observational factors and the regimes in which we are extrapolating to get predictions, we consider our predictions to be the most robust at stellar masses roughly comparable to the Milky Way ( to ).
Finally, the steep drop in predicted metallicities at is likely caused by an underestimate of from extrapolating Equation (2) outside the observed range of and . Though the fit given by Lara-López et al. (equation 4) gives nearly the same at low as shown in Figure 2, the piecewise-linear fit from Mannucci et al. (their equation 5) gives higher metallicities for low-mass galaxies ( at ), though it dramatically over-predicts the metallicities of high-mass galaxies.
| — | — | — | — | ||
|---|---|---|---|---|---|
| — | — | — | — | ||
| — | — | ||||
| — | — | ||||
The bottom panel of Figure 2 and Table 2 give the predicted evolution of the - relation from , , to .777Though stellar metallicities have been measured at redshifts as high as (Sommariva et al., 2012), we do not provide predictions for stellar metallicities at higher redshift due to uncertainties in the star formation histories. The stellar metallicity-mass relation is slightly steeper at higher redshift than at ; this evolution is driven by the relatively late buildup of stellar mass in low-mass galaxies relative to more massive galaxies, as can be seen in the top panel of Figure 1. In particular, at , where ongoing surveys are measuring stellar metallicities at for the first time (Gallazzi et al. in preparation), we find a typical decrease in of less than dex for star-forming galaxies. (Note that once star formation has ceased, stellar metallicities will not evolve; thus if passive galaxies at have not formed stars since ,, then galaxies will either remain in place or move to the right in the - plane through stellar mass growth via dry mergers). This rather modest evolution is in stark contrast to the evolution seen at all stellar masses in the - relation (top-right panel of Figure 1); this difference is primarily due to the earlier buildup of stellar mass in the more massive galaxies.
4 Conclusions
We have combined empirically derived star-formation histories from observations of high redshift galaxies (Leitner, 2012) with the empirically determined relation between stellar mass, star formation rate, and gas-phase metallicity (Mannucci et al., 2010) to derive the distribution of stellar metallicities at and the evolution of the galaxy-averaged stellar metallicity-mass relation (Figure 2 and Tables 1 and 2). We find that the hypothesis that the observed relation between stellar mass, star formation rate, and gas-phase metallicity holds up to at least is consistent with stellar metallicities, within the limits of the current observations. This comparison, however, is hampered by both a lack of a well-measured -- relation at low stellar masses, low star formation rates, and high star formation rates, and a lack of well-characterized -element distribution functions in both the Milky Way and other star-forming field galaxies with . From the modeling side, upcoming characterizations of the -- relation to lower stellar masses and across a broader range of star formation rates (B. Andrews & P. Martini, in preparation) will help alleviate the need for extrapolation when calculating . Upcoming surveys will also provide a more complete census of the stellar metallicity distribution function for the Milky Way (e.g., the SDSS-III APOGEE survey) and Local Group dwarf galaxies (E. Kirby et al. in preparation).
We have assumed here that all of the scatter in at fixed stellar mass is related to variations in the star formation rate, but the resulting relation still has scatter that is correlated with, e.g., galaxy size (Ellison et al., 2008a; Yabe et al., 2012) or environment (Kewley et al., 2006; Ellison et al., 2008b; Pasquali et al., 2012; Hughes et al., 2012). Moreover, the scatter in at fixed stellar mass is known to correlate with galaxy age (Gallazzi et al., 2005). In our framework, this can be seen as variations in galaxies’ star formation histories via the dex scatter in star formation rate at fixed stellar mass (Noeske et al., 2007; Karim et al., 2011; Leitner, 2012). This variation can be partially attributed to changes in environment (Pasquali et al., 2010), especially if environment introduces additional scatter to the -- relation (e.g., Pasquali et al., 2012).
We have also assumed that the buildup of all of the stellar mass in a galaxy can be well described by Equation (1). This is clearly not the case, as, e.g., there are stars in the Milky Way that were formed before and with . However, these stars comprise a very small fraction of the total stellar mass or light, at least in the Milky Way, and could be addressed by more complete model of star formation histories, including minor mergers which bring in a populations of lower-metallicity stars.
One of the strengths of the method presented here is that it does not require us to explain why the relationship between gas-phase metallicity, stellar mass, and star formation rate apparently does not evolve with redshift by invoking carefully evolving gas fractions, accretion rates, or outflow efficiencies (such as in, e.g., Peeples & Shankar, 2011; Davé et al., 2012; Dayal et al., 2012). On the other hand, integrating over the evolution of the mass-metallicity relation does neatly predict what fraction of Oxygen ever produced by a galaxy should be still locked up in stars, and how steeply this fraction should increase with stellar mass (c.f., Gallazzi et al., 2008; Kirby et al., 2011b; Zahid et al., 2012). Moreover, by combining this kind of calculation with measurements of the mass-metallicity relation and gas fractions (e.g., Peeples & Shankar, 2011), one can place constraints on the total amount of Oxygen galaxies have expelled over their lifetime (Bouché et al., 2007; Kirby et al., 2011b; Zahid et al., 2012), though for star-forming galaxies, uncertainties in the gas-phase abundances and relevant gas masses make this calculation difficult. More globally, it is especially intriguing that the implied masses of both metals and all baryons expelled by galaxies over their lifetime appears potentially consistent with the oxygen mass observed in the circumgalactic medium of galaxies (Tumlinson et al., 2011; J. Werk et al. in preparation).
Acknowledgments
We are grateful to Sam Leitner for sharing his Leitner (2012) star-forming main-sequence integration code with us. We thank Andrea Ferrara, Joseph Muñoz, Evan Kirby, and Paul Martini for useful discussions. We are also appreciative for the exquisite comments on the text from the anonymous referee. MSP acknowledges support from the Southern California Center for Galaxy Evolution, a multi-campus research program funded by the University of California Office of Research. This research was supported in part by the National Science Foundation under Grant No. NSF PHY11-25915 as part of the Kavli Institute for Theoretical Physics program on First Galaxies and Faint Dwarfs.
References
- Allende Prieto et al. (2008) Allende Prieto, C. et al. 2008, Astronomische Nachrichten, 329, 1018
- Arrigoni et al. (2010) Arrigoni, M. et al. 2010, MNRAS, 402, 173
- Asplund et al. (2009) Asplund, M. et al. 2009, ARA&A, 47, 481
- Behroozi et al. (2012) Behroozi, P. S., Wechsler, R. H., & Conroy, C. 2012, arXiv:1207.6105
- Bensby et al. (2004) Bensby, T., Feltzing, S., & Lundström, I. 2004, A&A, 415, 155
- Bland-Hawthorn et al. (2010) Bland-Hawthorn, J., Krumholz, M. R., & Freeman, K. 2010, ApJ, 713, 166
- Bouché et al. (2007) Bouché, N. et al. 2007, MNRAS, 378, 525
- Brinchmann et al. (2004) Brinchmann, J. et al. 2004, MNRAS, 351, 1151
- Brooks et al. (2007) Brooks, A. M. et al. 2007, ApJL, 655, L17
- Brooks et al. (2009) Brooks, A. M. et al. 2009, ApJ, 694, 396
- Bruzual & Charlot (2003) Bruzual, G. & Charlot, S. 2003, MNRAS, 344, 1000
- Chabrier (2003) Chabrier, G. 2003, PASP, 115, 763
- Colavitti et al. (2008) Colavitti, E., Matteucci, F., & Murante, G. 2008, A&A, 483, 401
- Conroy & Wechsler (2009) Conroy, C. & Wechsler, R. H. 2009, ApJ, 696, 620
- Daddi et al. (2007) Daddi, E. et al. 2007, ApJ, 670, 156
- Davé et al. (2011) Davé, R., Finlator, K., & Oppenheimer, B. D. 2011, MNRAS, 416, 1354
- Davé et al. (2012) —. 2012, MNRAS, 421, 98
- Dayal et al. (2012) Dayal, P., Ferrara, A., & Dunlop, J. S. 2012, arXiv:1202.4770
- De Lucia & Blaizot (2007) De Lucia, G. & Blaizot, J. 2007, MNRAS, 375, 2
- De Lucia et al. (2004) De Lucia, G., Kauffmann, G., & White, S. D. M. 2004, MNRAS, 349, 1101
- Delahaye & Pinsonneault (2006) Delahaye, F. & Pinsonneault, M. H. 2006, ApJ, 649, 529
- Dolphin et al. (2005) Dolphin, A. E., Weisz, D. R., Skillman, E. D., & Holtzman, J. A. 2005, ArXiv Astrophysics e-prints
- Eisenstein et al. (2011) Eisenstein, D. J. et al. 2011, AJ, 142, 72
- Elbaz et al. (2011) Elbaz, D. et al. 2011, A&A, 533, A119
- Ellison et al. (2008a) Ellison, S. L. et al. 2008a, ApJL, 672, L107
- Ellison et al. (2008b) —. 2008b, AJ, 135, 1877
- Erb et al. (2006) Erb, D. K. et al. 2006, ApJ, 644, 813
- Finlator & Davé (2008) Finlator, K. & Davé, R. 2008, MNRAS, 385, 2181
- Fontanot et al. (2009) Fontanot, F. et al. 2009, MNRAS, 397, 1776
- Gallazzi et al. (2008) Gallazzi, A. et al. 2008, MNRAS, 383, 1439
- Gallazzi et al. (2005) Gallazzi, A. et al. 2005, MNRAS, 362, 41
- Garnett & Shields (1987) Garnett, D. R. & Shields, G. A. 1987, ApJ, 317, 82
- Hirschmann et al. (2012) Hirschmann, M. et al. 2012, MNRAS, 419, 3200
- Hughes et al. (2012) Hughes, T. M., Cortese, L., Boselli, A., Gavazzi, G., & Davies, J. I. 2012, arXiv:1207.4191
- Ivezić et al. (2008) Ivezić, Ž. et al. 2008, ApJ, 684, 287
- Karim et al. (2011) Karim, A. et al. 2011, ApJ, 730, 61
- Kewley & Ellison (2008) Kewley, L. J. & Ellison, S. L. 2008, ApJ, 681, 1183
- Kewley et al. (2006) Kewley, L. J., Geller, M. J., & Barton, E. J. 2006, AJ, 131, 2004
- Kimm et al. (2009) Kimm, T. et al. 2009, MNRAS, 394, 1131
- Kirby et al. (2010) Kirby, E. N. et al. 2010, ApJS, 191, 352
- Kirby et al. (2011a) Kirby, E. N. et al. 2011a, ApJ, 727, 79
- Kirby et al. (2011b) Kirby, E. N., Martin, C. L., & Finlator, K. 2011b, ApJL, 742, L25
- Klypin et al. (2002) Klypin, A., Zhao, H., & Somerville, R. S. 2002, ApJ, 573, 597
- Kobayashi et al. (2007) Kobayashi, C., Springel, V., & White, S. D. M. 2007, MNRAS, 376, 1465
- Kobulnicky & Kewley (2004) Kobulnicky, H. A. & Kewley, L. J. 2004, ApJ, 617, 240
- Kormendy & Kennicutt (2004) Kormendy, J. & Kennicutt, R. C. 2004, ARA&A, 42, 603
- Lara-López et al. (2010) Lara-López, M. A. et al. 2010, A&A, 521, L53
- Leitner (2012) Leitner, S. N. 2012, ApJ, 745, 149
- Leitner & Kravtsov (2011) Leitner, S. N. & Kravtsov, A. V. 2011, ApJ, 734, 48
- Lopez-Sanchez et al. (2012) Lopez-Sanchez, A. R. et al. 2012, arXiv:1203.5021
- Lynden-Bell (1975) Lynden-Bell, D. 1975, Vistas in Astronomy, 19, 299
- Maiolino et al. (2008) Maiolino, R. et al. 2008, A&A, 488, 463
- Mannucci et al. (2010) Mannucci, F. et al. 2010, MNRAS, 408, 2115
- Mannucci et al. (2009) Mannucci, F. et al. 2009, MNRAS, 398, 1915
- Moster et al. (2012) Moster, B. P. et al. 2012, MNRAS, 423, 2045
- Mouhcine et al. (2008) Mouhcine, M. et al. 2008, A&A, 486, 711
- Nagashima et al. (2005) Nagashima, M. et al. 2005, MNRAS, 363, L31
- Nicholls et al. (2012) Nicholls, D. C., Dopita, M. A., & Sutherland, R. S. 2012, ApJ, 752, 148
- Noeske et al. (2007) Noeske, K. G. et al. 2007, ApJL, 660, L43
- Oliver et al. (2010) Oliver, S. et al. 2010, MNRAS, 405, 2279
- Oppenheimer & Davé (2008) Oppenheimer, B. D. & Davé, R. 2008, MNRAS, 387, 577
- Pagel (1989) Pagel, B. E. J. 1989, in Evolutionary Phenomena in Galaxies, ed. J. E. Beckman & B. E. J. Pagel, 201–223
- Pasquali et al. (2010) Pasquali, A. et al. 2010, MNRAS, 407, 937
- Pasquali et al. (2012) Pasquali, A., Gallazzi, A., & van den Bosch, F. C. 2012, arXiv:1206.3458
- Peeples & Shankar (2011) Peeples, M. S. & Shankar, F. 2011, MNRAS, 417, 2962
- Robaina et al. (2009) Robaina, A. R. et al. 2009, ApJ, 704, 324
- Salim et al. (2007) Salim, S. et al. 2007, ApJS, 173, 267
- Savaglio et al. (2005) Savaglio, S. et al. 2005, ApJ, 635, 260
- Scannapieco et al. (2006) Scannapieco, C. et al. 2006, MNRAS, 371, 1152
- Shapley et al. (2005) Shapley, A. E. et al. 2005, ApJ, 635, 1006
- Skelton et al. (2009) Skelton, R. E., Bell, E. F., & Somerville, R. S. 2009, ApJL, 699, L9
- Somerville et al. (2008) Somerville, R. S. et al. 2008, MNRAS, 391, 481
- Sommariva et al. (2012) Sommariva, V. et al. 2012, A&A, 539, A136
- Spitoni et al. (2010) Spitoni, E. et al. 2010, A&A, 514, A73
- Thomas et al. (2005) Thomas, D. et al. 2005, ApJ, 621, 673
- Tinsley (1975) Tinsley, B. M. 1975, ApJ, 197, 159
- Tinsley & Larson (1978) Tinsley, B. M. & Larson, R. B. 1978, ApJ, 221, 554
- Tissera et al. (2012) Tissera, P. B., White, S. D. M., & Scannapieco, C. 2012, MNRAS, 420, 255
- Toomre (1977) Toomre, A. 1977, in Evolution of Galaxies and Stellar Populations, ed. B. M. Tinsley & R. B. G. Larson, D. Campbell, 401
- Trager & Somerville (2009) Trager, S. C. & Somerville, R. S. 2009, MNRAS, 395, 608
- Tremonti et al. (2004) Tremonti, C. A. et al. 2004, ApJ, 613, 898
- Tumlinson et al. (2011) Tumlinson, J. et al. 2011, Science, 334, 948
- Weisz et al. (2011) Weisz, D. R. et al. 2011, ApJ, 739, 5
- Wiersma et al. (2009) Wiersma, R. P. C. et al. L. 2009, MNRAS, 1204
- Woo et al. (2008) Woo, J., Courteau, S., & Dekel, A. 2008, MNRAS, 390, 1453
- Yabe et al. (2012) Yabe, K. et al. 2012, PASJ, 64, 60
- Yates et al. (2012) Yates, R. M., Kauffmann, G., & Guo, Q. 2012, MNRAS, 422, 215
- Zahid et al. (2012a) Zahid, H. J., Bresolin, F., Kewley, L. J., Coil, A. L., & Davé, R. 2012a, ApJ, 750, 120
- Zahid et al. (2012) Zahid, H. J. et al. 2012, arXiv:1207.5509
- Zaritsky et al. (1994) Zaritsky, D., Kennicutt, Jr., R. C., & Huchra, J. P. 1994, ApJ, 420, 87
- Zheng et al. (2007) Zheng, Z., Coil, A. L., & Zehavi, I. 2007, ApJ, 667, 760