A Quantitative Study of Social Organisation in Open Source Software Communities
Marcelo Serrano Zanetti, Emre Sarigöl, Ingo Scholtes, Claudio Juan Tessone, Frank Schweitzer
References
- [1]
- [2] \wwwhttp://www.sg.ethz.ch
- [3] \makeframing
- [4]
A Quantitative Study of Social Organisation in Open Source Software Communities
Abstract
The success of open source projects crucially depends on the voluntary contributions of a sufficiently large community of users. Apart from the mere size of the community, interesting questions arise when looking at the evolution of structural features of collaborations between community members. In this article, we discuss several network analytic proxies that can be used to quantify different aspects of the social organisation in social collaboration networks. We particularly focus on measures that can be related to the cohesiveness of the communities, the distribution of responsibilities and the resilience against turnover of community members. We present a comparative analysis on a large-scale dataset that covers the full history of collaborations between users of major open source software communities. Our analysis covers both aggregate and time-evolving measures and highlights differences in the social organisation across communities. We argue that our results are a promising step towards the definition of suitable, potentially multi-dimensional, resilience and risk indicators for open source software communities.
1 Introduction
2 Social Organisation in OSS Communities: A Network Perspective
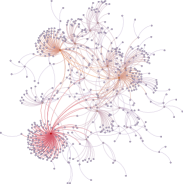
2.1 Building Social Networks from Bug-Reports
| Project | Bugs | Updates | Period | LCC/Total | Nodes in LCC | Edges | Mean | Assortativity | Closeness | Clustering |
|---|---|---|---|---|---|---|---|---|---|---|
| Name | Degree | Central. | Coefficient | |||||||
| xamarin | 4552 | 20721 | 2011-2012 | 0.930.05 | 46.768.12 | 98.1522.70 | 2.070.29 | -0.140.11 | 0.400.07 | 0.220.05 |
| thunderbird | 35388 | 313957 | 2000-2012 | 0.530.26 | 64.8253.49 | 86.4480.05 | 1.050.42 | -0.230.17 | 0.400.27 | 0.040.05 |
| libreoffice | 8916 | 78341 | 2010-2012 | 0.780.11 | 73.8332.06 | 114.4149.10 | 1.560.26 | -0.200.10 | 0.400.09 | 0.130.06 |
| mageia | 6600 | 46921 | 2006-2012 | 0.930.07 | 77.5421.80 | 156.0059.24 | 1.950.30 | -0.370.12 | 0.540.09 | 0.140.04 |
| mandriva | 60546 | 368463 | 2002-2012 | 0.700.18 | 88.1560.70 | 142.16118.44 | 1.410.38 | -0.290.15 | 0.400.14 | 0.070.05 |
| firefox | 112953 | 1067914 | 1999-2012 | 0.580.23 | 171.77117.79 | 240.79180.44 | 1.160.44 | -0.150.11 | 0.320.23 | 0.040.04 |
| seamonkey | 90040 | 993392 | 1998-2012 | 0.670.15 | 210.39251.43 | 364.42482.54 | 1.480.48 | -0.190.13 | 0.340.11 | 0.080.06 |
| netbeans | 210921 | 1875878 | 2000-2012 | 0.960.05 | 269.71292.07 | 1069.721509.12 | 3.391.13 | -0.120.08 | 0.370.05 | 0.230.08 |
| openoffice | 118135 | 915749 | 2000-2012 | 0.880.19 | 319.01169.88 | 931.35591.80 | 2.520.84 | -0.120.10 | 0.340.15 | 0.120.06 |
| gentoo | 140216 | 661783 | 2002-2012 | 0.800.07 | 338.97110.86 | 617.73211.92 | 1.820.27 | -0.290.10 | 0.490.13 | 0.040.03 |
| kde | 179470 | 648331 | 2002-2012 | 0.750.12 | 361.16246.16 | 424.61301.20 | 1.150.07 | -0.160.07 | 0.320.07 | 0.010.01 |
| eclipse | 356415 | 2594385 | 2001-2012 | 0.780.08 | 472.58180.71 | 964.47411.94 | 2.060.38 | 0.050.08 | 0.250.05 | 0.130.03 |
| gnome | 550722 | 2751441 | 2000-2012 | 0.670.12 | 523.76585.26 | 610.16616.81 | 1.250.22 | -0.170.09 | 0.250.08 | 0.030.04 |
| redhat | 414163 | 3777634 | 2006-2012 | 0.450.26 | 658.06865.97 | 983.581297.18 | 1.190.35 | -0.120.20 | 0.300.23 | 0.000.01 |
2.2 Network Measures
While the literature is rich in terms of measures able to quantify structural features of networks [stanleysocial1994, newmannetsbook2010], due to space limitations here we focus on three measures which are able to capture basic network qualities that relate to the cohesiveness of a community, the distribution of responsibilities among its members and its resilience against fluctuations in the user base. The first network measure is based on the closeness centrality of a node, which is defined as the inverse of the sum of the shortest path length to all other nodes in the network.
| (1) |
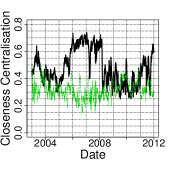
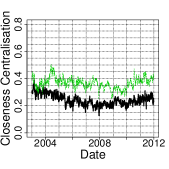
where corresponds to the closeness centrality score of node , is the length of the shortest path between nodes and , while corresponds to the total number of nodes in a given network. Finally, the factor is a normalisation constant [freemancentrality1979]. Based on this, the closeness centralisation of a network can be calculated by taking the sum of the differences between the node with the highest value of closeness centrality and the closeness centrality scores of all other nodes. This quantity is then normalised to the range of to using the theoretical value that results from a (maximally centralised) star network. Equation (2) presents the formal definition, while more details can be found in [freemancentrality1979, stanleysocial1994]. In the context of OSS collaboration networks, closeness centralisation captures to what degree responsibilities, collaboration and communication are distributed equally across community members.
3 Comparative Analysis of OSS Communities


4 Conclusions and Future Work
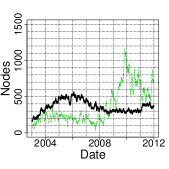
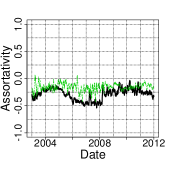
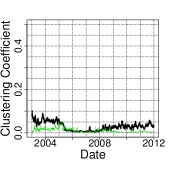
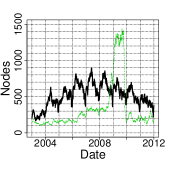
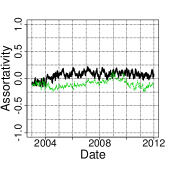
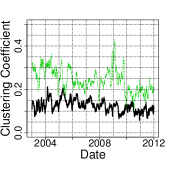
We have studied measures that capture different structural dimensions in the social organisation of OSS projects. Our analysis is based on a comprehensive dataset collected from the bug tracking communities of major OSS projects. We view the social organisation from the perspective of time-evolving networks and highlight how projects, although similar in terms of size, problem domain and age, a) largely differ in terms of clustering coefficient, assortativity and closeness centralisation and b) that some projects show interesting dynamics with respect to these measures that cannot be explained by mere size effects. We argue that the phase of high closeness centralisation and low clustering coefficient observed in the Gentoo community between and may be interpreted as a lack of social cohesion which can possibly pose a risk for the project.