An investigation into the feasibility of myoglobin-based single-electron transistors
Abstract
Myoglobin single-electron transistors were investigated using nanometer-gap platinum electrodes fabricated by electromigration at cryogenic temperatures. Apomyoglobin (myoglobin without heme group) was used as a reference. The results suggest single electron transport is mediated by resonant tunneling with the electronic and vibrational levels of the heme group in a single protein. They also represent a proof-of-principle that proteins with redox centers across nanometer-gap electrodes can be utilized to fabricate single-electron transistors. The protein orientation and conformation may significantly affect the conductance of these devices. Future improvements in device reproducibility and yield will require control of these factors.
pacs:
73.23.Hk, 73.23.-b, 85.35.Gv, 82.37.Rs, 87.14.E-, 87.80.Nj1 Introduction
Electron transfer is of fundamental importance to proteins whose functionality relies on redox reactions with other proteins, cofactors, or the external environment. In proteins containing heme groups, a single Fe ion in a protoporphyrin ring changes valence state between ferrous (Fe2+) and ferric (Fe3+) oxidation states as an electron is accepted by or donated to the protein [1]. Much experimental work has been performed to develop an understanding of protein electron transfer mechanisms [2, 3] most of it based on statistical averages of protein ensembles measured by spectroscopic and electrochemical techniques [4, 5].
Electron transfer through individual molecules has been probed recently using electrochemical scanning tunneling microscopy (EC-STM) [4, 6]. In EC-STM, a gate voltage is used to align a molecule’s redox level to the Fermi levels of the tip and substrate with the sample in solution at room temperature. The results are explained using resonant tunneling [4, 6] and two-step electron transfer models [5]. According to resonant tunneling models, electrons transfer via resonant tunneling due to alignment of molecular orbital energy levels with the Fermi level of the contact electrodes. In the two-step process, conformational changes in the molecule occur during tunneling which change the orbital energy levels. This process is thought to be especially prevalent in redox molecules [6, 7]. In a related group of experiments, measurements on large assemblies of localized proteins using mercury contacts have been used to distinguish between tunneling and hopping electron transfer mechanisms [8].
Nanometer-gap electrodes fabricated by electromigration techniques [9] have made it possible to study electron conductance through small single redox molecules. By applying a bias voltage between electrodes and a gate voltage to the sample’s substrate, molecular energy levels can be probed and characteristic single-electron transistor (SET) behavior, such as a Coulomb blockade or a Kondo resonance, can be observed [10, 11, 12, 13]. In particular, these experiments have demonstrated that molecular junctions fabricated in this way can be used to probe the electron transfer properties of the molecules. In these measurements, the presence of Coulomb blockade phenomena by itself is not proof that the molecular properties are being probed because the characteristics of the junction itself after the breaking process can affect the measurements [14], and therefore control experiments must be performed to validate the data. These measurements, if performed correctly, rely on a resonant tunneling process which in principle indicate that tunneling is a possible electron transfer mechanism. Our aim in this work is to determine whether tunneling is a viable electron transfer mechanism in redox proteins such as myoglobin by attempting to fabricate and measure single electron transistors.
Here we describe the study of single-electron transistors composed of the protein myoglobin (Mb). Mb is a roughly spherical globular metalloprotein containing a heme group surrounded by a folded single-chain polypeptide consisting of 153 amino acids (apomyoglobin) [15]. Mb was chosen because 1) it is relatively small (), which is desirable to increase electron tunneling probability, 2) the apo form is readily available and well studied and can thus be used as a control to discern effects related to the heme group, and 3) its structure and vibrational spectra are well known. In other words, Mb is a model system with which to test bioelectronic devices based on heme-containing proteins.
This paper is organized as follows. After briefly discussing the general properties of myoglobin and single-electron transistors in the Background section, we describe the experimental techniques used, including break junction fabrication, electrical measurements, and protein incorporation. In the Results section we describe results from bare junctions, junctions with apomyoglobin (apoMb), and junctions with Mb. In the Discussion section we analyze our data using the known properties of myoglobin and the results from the bare and apoMb samples. Because SET conductance can result from metal grains produced by the electromigration process [16, 14], an important distinction between samples with and without protein incorporation is the observation of inelastic tunneling from discrete vibrational modes [9, 11, 17]. We also identify heme-group resonant tunneling by comparing the behaviors of apoMb samples with Mb samples. The Conclusions section summarizes our results and identifies areas where the experiments can be improved. In Appendix A we describe differential SET conductance calculations with and without tunneling-induced structural changes in the protein.
2 Experimental techniques
2.1 Break-junction fabrication
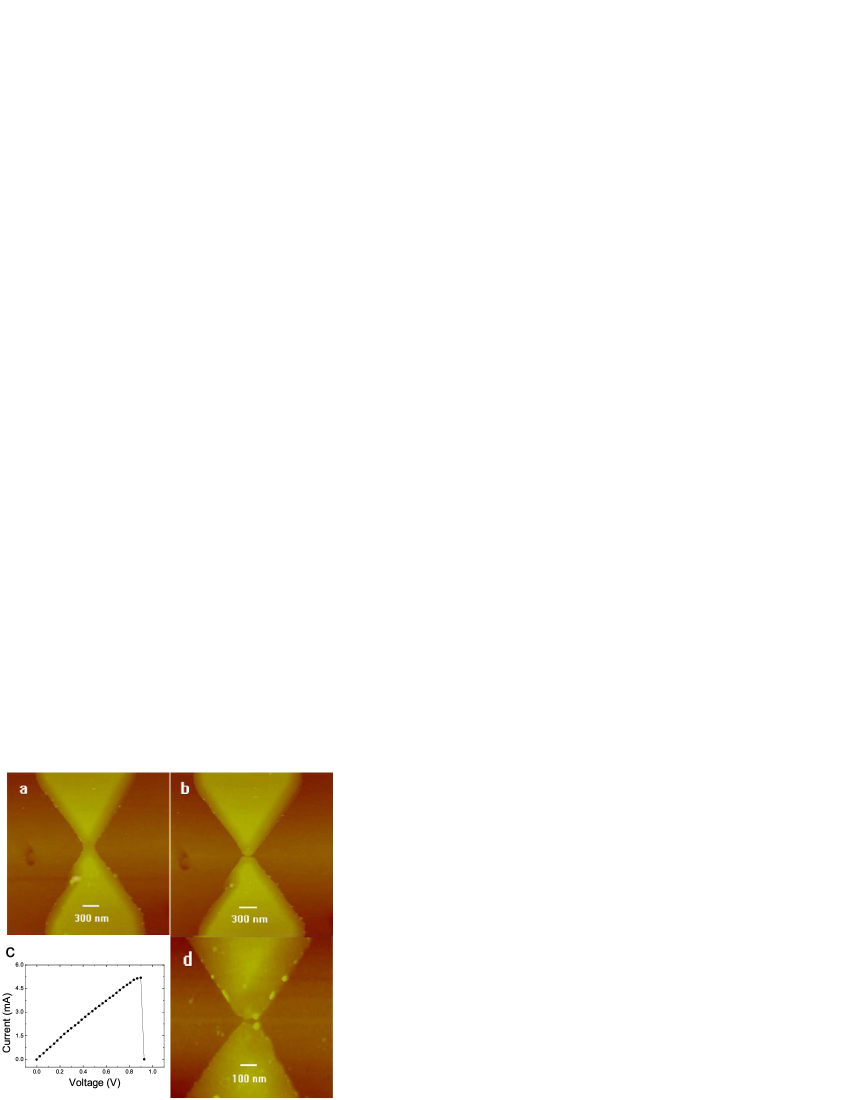
The junctions were grown on Si substrates with a SiO2 layer 200 nm thick. The resistivity of the degenerately-doped silicon wafers ranged from 0.002 -cm to 0.003 -cm. The Si substrate served as the gate contact. The widths of junctions were usually between 100 nm and 300 nm. The junctions were fabricated by electron-beam lithography using a lift-off technique. Pt films, 20 nm thick, were deposited on a Si/SiO2 substrate by magnetron sputtering with approximately a deposition angle with respect to the surface normal of the sample. The samples were rotated about the surface normal during deposition. The Pt deposition rate was 0.028 nm/s and the base pressure was Torr; an Ar pressure of 1.5 mTorr was used during deposition. The junction thickness at its narrowest point was approximately 8 nm to 10 nm because of a shadow effect during the sputtering deposition process, as shown in figure 1(a). The junction with this kind bow-tie shape tends to break only in the middle, does not require high voltages to break [figures 1(b) and (c)], and can be broken by an electrical pulse with a low negative voltage, as shown in figure 1(d) [18]. The total resistance of the junctions (including parasitic resistance) at room temperature ranged between 100 and 2000 . The narrowest gap between electrodes formed in this way are on the order of 5 nm, as shown in figure 1.
2.2 Protein incorporation and viability
Mb and apoMb at least 95% pure were obtained from horse skeletal muscle (Sigma) in its powder state and essentially salt-free. The protein powders were dissolved in a 10 mM phosphate buffer saline (PBS, Sigma, ) with 14.2 mM and 31.5 M concentrations for Mb and apoMb, respectively. Protein solutions were passed through a 0.2 m pore size filter to remove larger protein clusters that may have formed. In order to remove possible contaminants from the electrode surface, junctions were rinsed with optima acetone and isopropanol and subsequently cleaned with O2 plasma. After the cleaning procedure, the protein solution was dropped on the samples. The samples were kept at 4 ∘C in order to let water evaporate. A drop of the solution was placed on the unbroken junction prior to cooling down the samples.
Linker molecules were avoided because junctions exposed to them (without protein) generated resonant tunneling electronic data. These data showed a weak dependence on gate voltage, which would have made it difficult to disntiguish the protein behavior from that of the linker (see supplementary information). Raman spectra showed that the Mb was active after cooling down to K and then warming up to room temperature [19]. Therefore, it is unlikely that the protein denatured during the cooling process. Another possible problem is that the local temperature during the electromigration process might be high enough to denature the protein [20, 21, 22]. Measurements of the electrical resistance at low voltages as a function of temperature yielded an estimate of a maximum temperature of approximately 400 K, which is consistent with estimates of 495 K for junctions broken at room temperature [23]. Additional Raman scattering measurements performed on protein heated up in air in a furnace or hot plate demonstrated that myoglobin is viable after heating to 400 K (see supplementary information).
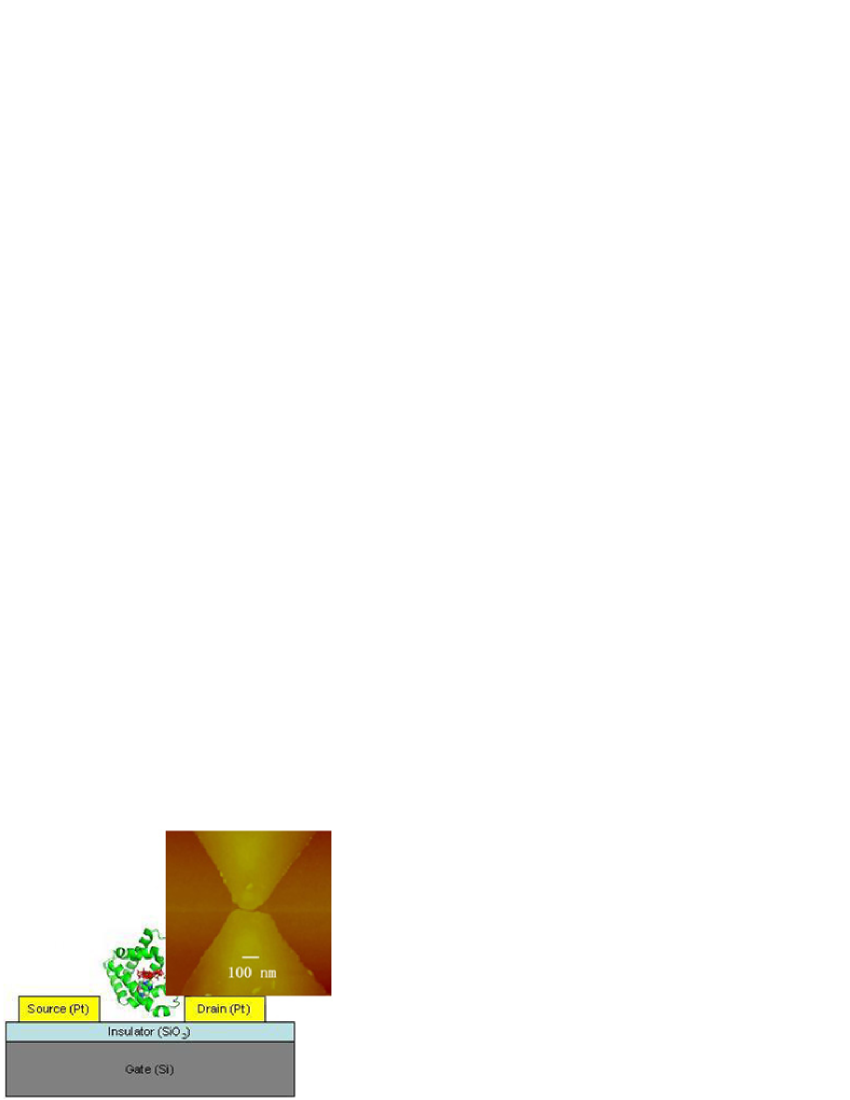
The junctions with a bow-tie configuration were fabricated from Pt thin films, 8 to 10 nm thick in the middle, 200 nm wide and deposited on a Si wafer with a 200 nm thick SiO2 insulating layer. The doped Si substrate was used as a gate contact in all samples, as shown in figure 2. Electrical measurements were performed immediately after breaking the junction at low temperature (either 77 K or 6 K). The conductance () as a function of and was acquired by numerically differentiating current-bias voltage () curves. Junctions were measured without any protein, with apomyoglobin, and with myoglobin.
3 Results
3.1 Bare junctions
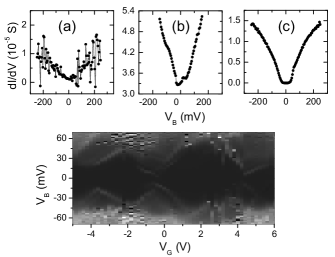
In the control experiments with bare junctions (without protein), 107 Pt junctions were broken by electromigration at K. The broken junctions had a resistance ranging from 1 M to 1 G. All but one of the broken junctions did not show differential conductance peaks. Figure 3(a) is a typical result measured at K. The conductivity was relatively low and there was a significant amount of noise for these structures. Only one sample had conductance peaks, as shown in figure 3(b). In addition, 31 bare Pt junctions were broken by electromigration and measured at K. Seventeen of these did not have conductance peaks as shown in figure 3(c). Out of the remaining fourteen junctions that had conductance peaks, eleven broken junctions did not have a dependence on the gate voltage. The remaining three junctions did have conductance peaks whose positions were dependent on the gate voltage. Coulomb diamonds, characteristic of SET behavior, were observed in the conductance as a function of gate and bias voltages as shown in figure 3(d). This demonstrates that occasionally Pt grains are formed, as has been previously observed in Au junctions, which can mask the molecular information [16, 14, 22]. These islands have several energy levels and the conductance peaks from metal grains can be tuned by gate voltage modulation. Many Coulomb diamonds were observed, each corresponding to the addition of an electron to the island. It is important to note that the appearance of several Coulomb diamonds is unlikely to happen in single-protein junctions, since excessive charging can denature the protein.
3.2 Apomyoglobin experiments
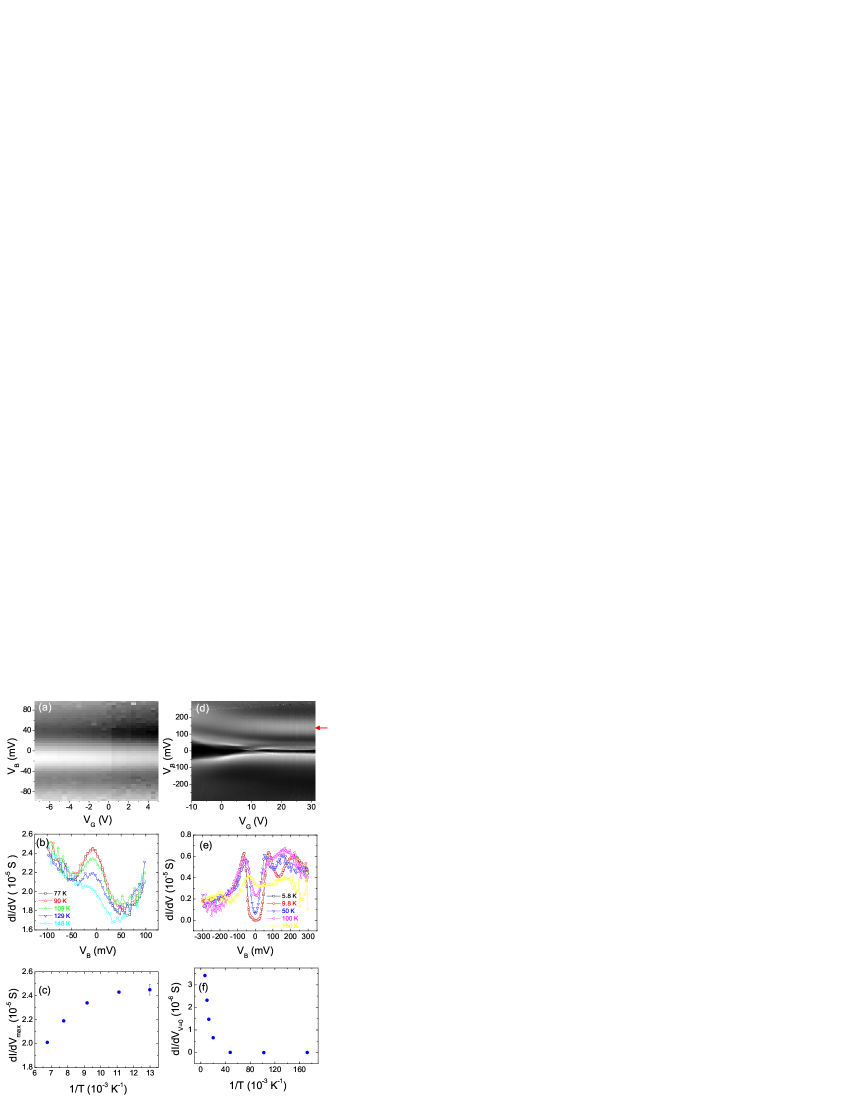
In the apoMb experiments, out of 125 Pt protein-coated junctions broken at K, nine had conductance peaks with a very weak response to . Figure 4(a) is the conductance measured at K for one of these apoMb samples. One conductance peak was approximately constant as a function of . This peak, measured at as a function of temperature, is shown in figure 4b. Figure 4(c) shows how the peak height depended on temperature. The monotonic decrease of the peak height with increasing temperature, together with saturation at low temperatures () indicates that tunneling, and not Mott hopping, is the dominant electron conduction mechanism in this device [24, 25]. Tunneling is observed because the conductance is smaller than the conductance quantum of S. The lack of dependence of means, however, that the separation of energy levels inside the protein are much larger than [26].
Forty-three apoMb samples were measured at K. Fifteen of them had conductance peaks and two had a very weak dependence. For three of the apoMb samples, conductance lines changed slightly with as shown in figure 4(d). The spectra measured at at several temperatures is shown in figure 4(e). The zero conductance region near may arise from a Coulomb blockade effect, but the lack of Coulomb triangles indicates that the energy levels in the apoMb protein are too close in energy to be able to observe a Coulomb staircase. The temperature dependence of the the conductance at is shown in figure 4(f). For temperatures below K the conductance is independent of temperature, characteristic of a tunneling process, but at higher temperatures the conductance quickly increases until the spectrum completely loses its tunneling gap above K. The line that starts at mV, indicated by the red arrow, may arise from the vibrational spectra of amino acid redox centers [27].
3.3 Myoglobin experiments
A total of 215 Mb samples were measured at K, out of which 21 had conductance peaks that strongly depended on . In another approach, junctions were broken by a single electrical pulse with a very low negative voltage with a mechanism similar to voltage-pulse-induced electromigration [18]. These thin ( nm) Pt junctions can be broken by a low negative voltage mV which avoids potentially heating the sample to high temperatures. Out of 64 Pt Mb-coated junctions broken by electrical pulse at K, four had an obvious dependence on .
Of the 25 samples that had gate voltage-dependent behavior, the conductance maps can be divided into three types: 1) data where a Kondo-like resonance is observed, that is, conductance near zero bias voltage that is independent of gate voltage; 2) Coulomb blockade without a two-step process; and 3) Coulomb blockade with a two-step process.
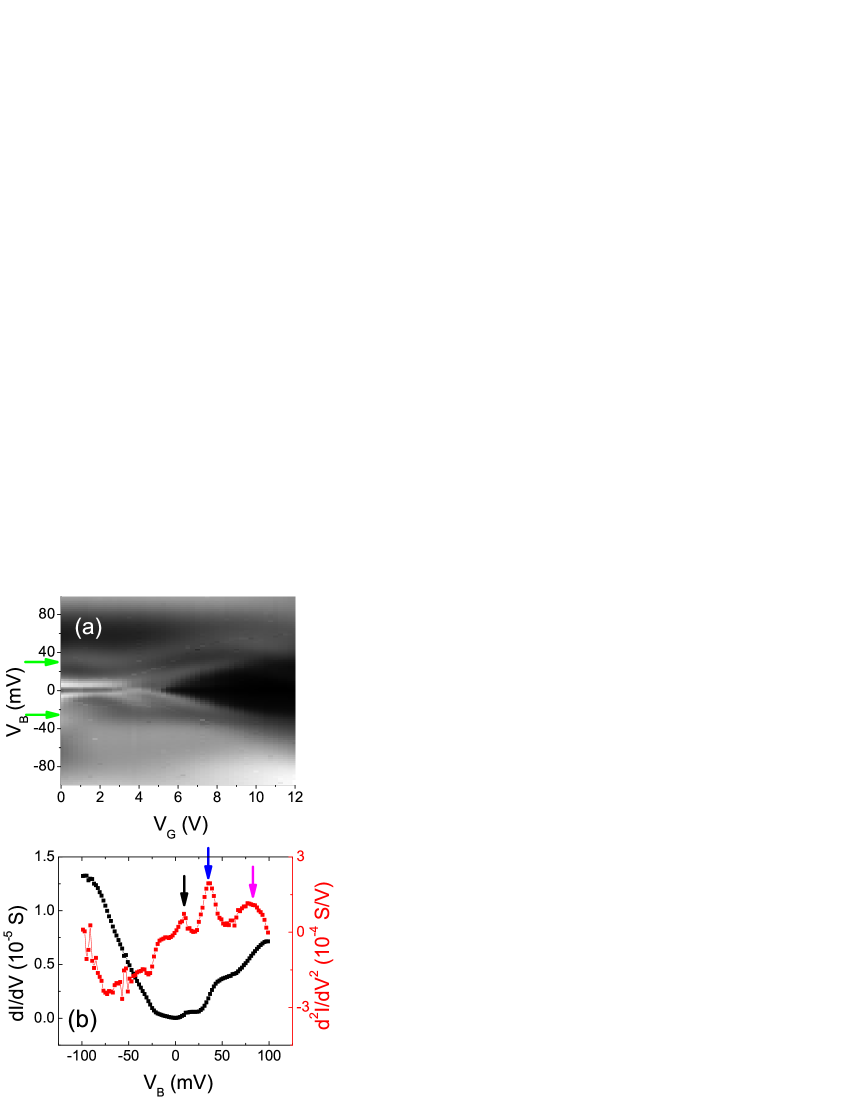
Figure 5 shows results from one of the samples with a Kondo-like resonance. When the junction was initially broken by a negative electrical pulse, no conductance peaks were found. However, there was a sudden increase in the current when the voltage was increased again, indicating a modification of the contact and possible protein incorporation in the gap of electrodes [10], although this could also be due to Joule heating resulting from a sudden narrowing of the junction in the bowtie region [28]. Conductance peaks were observed thereafter. In the differential conductance map, shown in figure 5(a), two intense peaks around are independent of for V. For higher values, the peaks are composed of half a Coulomb blockade-like triangle. This could be an indication of a Kondo-resonance assisted tunneling [10], although verification would require measurement in large magnetic fields. The two lines indicated by the green arrows, corresponding to green arrows in figure 5(a), do not depend strongly on for V. The conductance feature starting at mV could arise from vibrational excitations as this energy coincides with the energy of the Fe-His vibration (27.3 meV). Conductance steps are also present as indicated in figure 5(b). These steps result in peaks in , indicated by the black (9 mV), blue (35 mV), and magenta ( mV) arrows in figure 5(b). Taking into account that modes increase in energy at low , the arrows correspond to heme- doming [29, 30], Fe-His, and, heme-group deformation (83.7 meV) modes, respectively [31].
Conductance data for a sample which displayed Coulomb blockade behavior without a two-step process are shown in figure 6(a). Figure 8(b) is a calculation using reasonable parameters that reproduce the main characteristics of the experimental data. The appearance of two wide conductance lines starting at mV, indicated by red arrows in figure 6(a), arise from inelastic tunneling with the 4.96 meV vibrational mode of the heme group [29, 30].
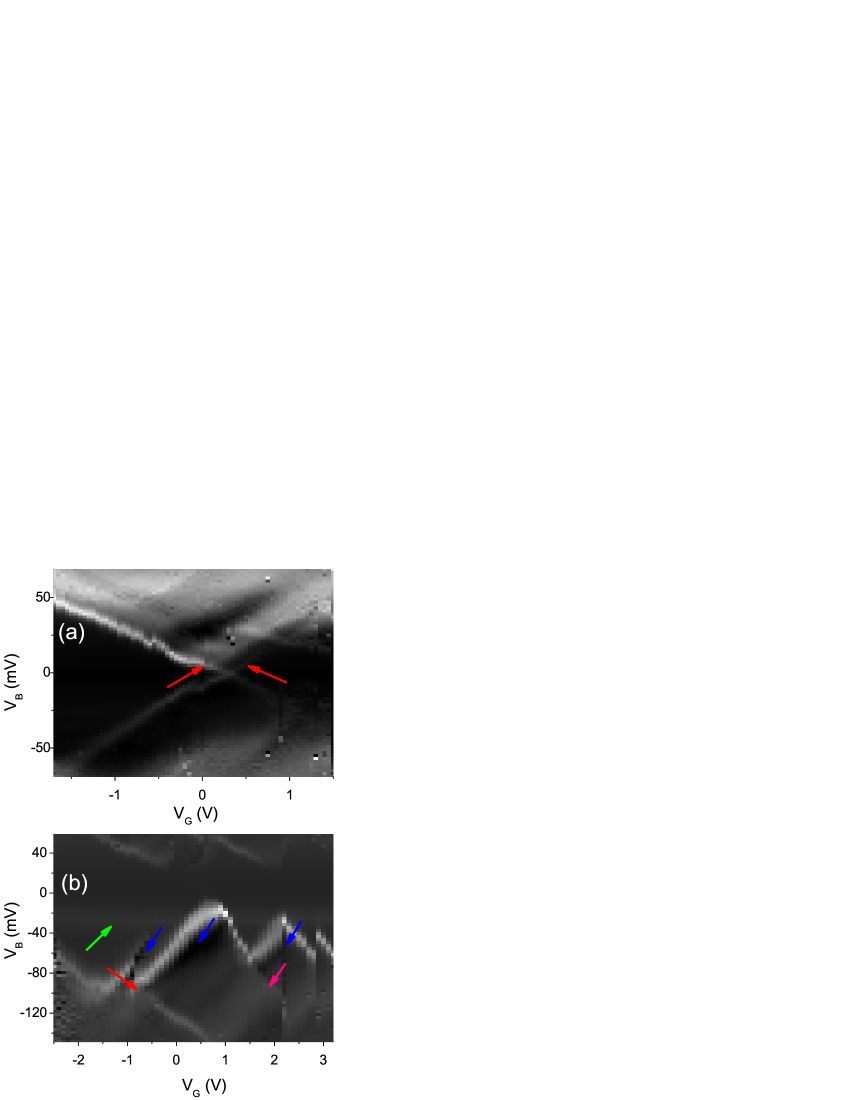
Another sample with SET behavior is shown in figure 6(b). In this case, two deformed Coulomb blockade triangles near zero bias voltage can be found without a degeneracy point in the differential conductance graph. This means that two charge states do not have the same energy, and in this case the separation between the top triangles is mV. This separation, as shown by the calculation in figure 8(c), is an indication that the two-step electron transfer process is a viable mechanism. In addition, there are three areas that exhibit negative differential conductance (NDC), indicated by the three blue arrows. One explanation of how NDC behavior may arise is from the existence of two quantum dots in series . This suggests that these measurements were the result of transport through two or more myoglobin proteins in series with each other. The faint line at mV, indicated by the green arrow, does not have a strong dependence on , which indicates electron tunneling by the medium around the heme group. We also note that the conductance feature that starts at mV, indicated by the red arrow, could arise from one of the excited electronic level of the protein or a vibrational excitation of the protein. In particular, this energy coincides with the energy of the tryptophan amino acid in Mb which is known to have an energy of mV (measured at room temperature) [32]. The wide conductance line that starts at mV, indicated by the pink arrow, is another line that could arise from the excited state or vibrational excitation.
4 Discussion
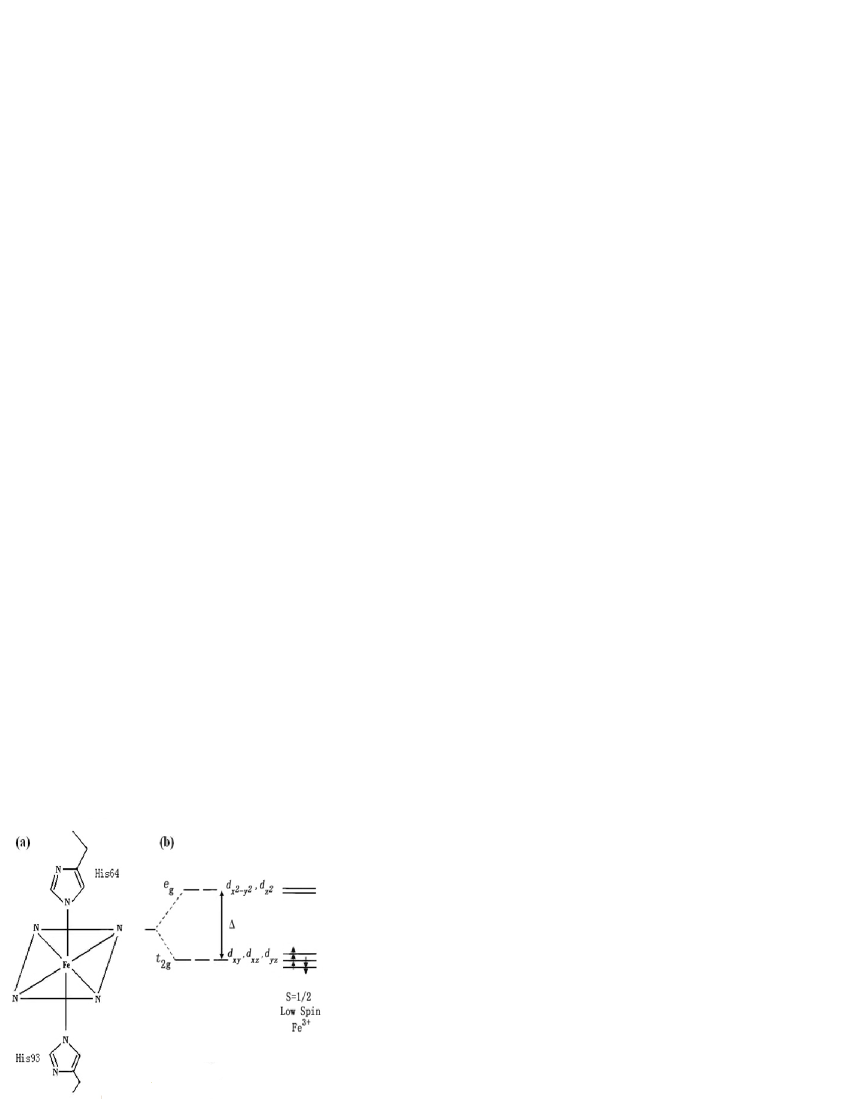
Here we discuss our results in terms of the known properties of myoglobin. Figure 7(a) shows the heme group structure of dry Mb. The fifth Fe ligand binds covalently with amino acid His 93, and therefore the Fe-His vibrational mode (27.3 meV) is an excellent heme-group indicator [29]. The sixth Fe ligand is occupied by H2O for aqueous Mb but is coordinated with His 64 when dry. In the latter case the Fe atom is in the plane of porphyrin ring in a low spin () configuration (metMb) [31]. The ligand field splits the Fe energy levels into two and three orbitals, as illustrated in figure 7(b), with an energy gap for metMb [29]. These orbitals split further by 0.25 eV to 0.37 meV due to molecular orbital interactions [31], which is difficult to detect even at a cryogenic temperature of K. Excited states are also difficult to probe because of low ( mV) used in the measurements (higher voltages destroyed our samples).
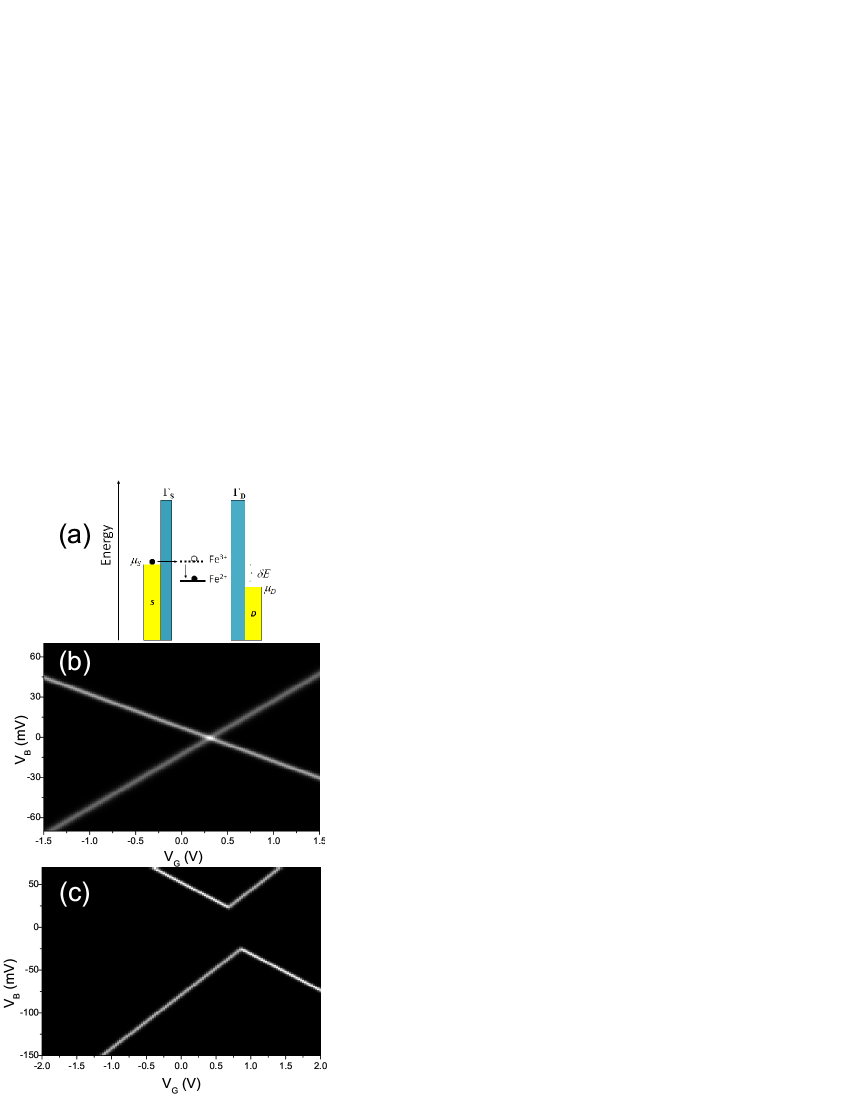
A Mb SET can be modeled as a single energy level device with inelastic tunneling processes possible due to the localized vibrational modes of the heme group. However, it is known that redox reactions can cause significant conformational changes of the heme group [33] and that the associated relaxation time could range from picoseconds to seconds [34]. If the relaxation time is long, the electron resonantly tunnels while the protein remains in the intermediate state and its degeneracy point is at = 0. If the relaxation time is short (on the order of a few ps), the protein quickly relaxes from the intermediate state to its ground state, whose level may fall below the Fermi level of electrodes, as illustrated in figure 8(a). In this case, the electron is trapped in the protein, current flow is blocked, and the Coulomb blockade lacks a degeneracy point. This is further illustrated by the calculations in figures 8(b) and 8(c) performed by solving tunneling rate equations [35, 36] (see Appendix A). When the two-step relaxation process does not take place, normal Coulomb triangles are observed in the differential conductance map. When the relaxation process occurs, a gap opens at the intersection of the Coulomb triangles (degeneracy point).
It is important to note that amino acids around the heme group may complicate the analysis by acting as intermediaries for electron hopping processes and redox centers [27]. These aromatic amino acids have low frequency vibrational modes, such as phenylalanine (124 meV), tyrosine (79.9 meV, 103 meV, and 106 meV), and tryptophan (94.2 meV, 109 meV and 125 meV) [32].
A fundamental question in analyzing our results is determining whether the protein is indeed being measured. Regarding the results of the bare junctions with respect to the Mb junctions, we notice that the conductivity maps in figures 5 and 6 do not show multiple degeneracy point like those of the bare junctions in figure 3(d), and the energy scale (gate and bias voltages) used are completely different. This is an indication that the myoglobin data come from the protein and not from metallic islands formed in the junctions. We note that a similar observation has been made for break junctions used to measure single OPV-5 molecules, where gold grains remaining in the junction create multiple Coulomb diamonds which are superimposed on the signal from the molecule [13]. As to whether the heme group plays a role in resonant tunneling processes, we note that none of the apoMb samples’ conductance showed a strong dependence on gate voltage, while only Mb samples had this dependence. Another indication that the data represent the conductance of the protein are the inelastic tunneling features of the conductance plots in figures 5 and 6. As mentioned above, these features correspond to the known vibrational energies of the heme group.
The effects of the protein orientation can be surmised from inelastic vibrational spectra. Two pathways for electron transfer between the heme iron and electrodes are through the porphyrin ring or the His93 group [31]. Transfer through the porphyrin ring occurs as a result of porphyrin ring’s -orbital hybridization with the -orbital of iron [31] combined with a slow porphyrin-iron structural relaxation [37]. In this case, the resonant energy level does not change during tunneling, and results like those in figures 8(b) and 6(a) are expected. On the other hand, the dip near and V in Fig. 6(b) could be due to the very fast relaxation ( ps) of the Fe-His bond [37, 38]. The qualitative difference between figures 5(a) and 6(a) could be due to different orientations of the heme group with respect to the electrodes. Moreover, because the heme group is not at the center of the protein [15], certain orientations may cause the heme to be closer to the electrodes, thus increasing the probability of observing Kondo resonances.
Another complication is that the large lateral size of the break junctions could result in several proteins with different conformations being measured in parallel, or in protein dimers consisting of two proteins measured in series if the gap is somewhat larger than a single protein. We assume that conductance is dominated by the narrowest portions of the break junction since tunneling processes usually depend exponentially on the effective width of the barriers, and therefore it is unlikely that trimers or larger protein agglomerations will play much of a role in the conductance data. The data shown in figure 6(a) agree well with what is expected from a single protein conductance, whereas the data in figure 6(b) show indications of multiple protein conductance (either in series or in parallel), in addition to a two-step tunneling process. Analyzing the data with more sophisticated models that take into account multiple protein conductance may be helpful in further understanding the conductance mechanism, but this is beyond the scope of this paper.
5 Conclusions
We have presented results from a series of experiments on metallic break junctions with apomyoglobin and myoglobin. Some myoglobin junctions displayed single-electron transistor behavior consistent with resonant tunneling through the heme group. In one case, tunneling appears to be a result of a two-step process where the protein changes conformation during the tunneling process. Elastic and intelastic tunneling data are also consistent with resonant tunneling from known vibrational modes of the protein. Our results underscore the importance of tunneling, as opposed to hopping, as an electron transfer mechanism in redox proteins.
Future challenges include determining the spin state of a single metalloprotein via a SET configuration for sensor applications and using other metalloproteins, such as cytochrome P450, that have binding properties to specific molecules. This will require a greater yield of successful devices and control of the protein orientation and conformation on the electrodes.
Appendix A Rate Equations for Two-step Electron Transfer
In the following treatment we use the same approach as in references [35] and [36]. The rate equation for the transition of an electron into an energy level in a SET is
| (1) |
where is the probability that the molecule is in a specific state and and are the transition rates between and states. The current can be calculated by electron transfer through either of the two tunnel barriers corresponding to the source and drain electrical contacts. The two currents at equilibrium are equal. The current through the source is
| (2) |
where is the charge of the electron, is the contribution of the source to multiplied by depending on the transition contribution to the current.
Figure 8(a) is a diagram representing the two-step resonant tunneling process. The protein’s ferric state (Fe+3) is labeled by (0) and the ferrous state (Fe+2) is labeled (1). and are the tunneling rates between the protein and the source and drain electrodes, respectively. The energy difference between the ferric and ferrous states is . We define and as the probabilities that the level in the quantum dot (protein) are unoccupied and occupied, respectively.
For single electron transport, the total tunneling time can be estimated from , so that ps for a current of A. We therefore set up the rate equations for two-step electron transfer by making the following assumptions:
-
1.
When the electron tunnels into the protein, the energy level 0 relaxes to level 1 via a structural distortion in a time .
-
2.
The process is not reversible and fluctuations between levels 1 and 0 resulting from nuclear distortions are neglected. This is true at low temperatures where the thermal energy is much smaller than the vibrational energy of the heme group ().
With these assumptions, the rate of change of and can be written as
| (3) |
where and are the Fermi distribution functions of the source and drain electrodes, respectively, for the unoccupied (occupied) energy levels. These can be written as
| (4) | |||
| (5) |
Here is the chemical potential of the system with electrons and is the chemical potential when an additional electron is added to the system. The latter can be expressed as
| (6) |
where is the potential of the quantum dot, is the source-drain potential difference, is the gate potential, is the total capacitance of th all the electrodes in the system with , , and being the capacitances of the gate, source, and drain electrodes. The energy is proportional to the crossing potential , which is the potential at which current can flow at low bias due to matching of the empty electron energy level with the source electrode chemical potential.
In equilibrium, and . Combining this equilibrium condition with equation 9 and the expression for the current
| (7) |
leads to
| (8) |
and
| (9) |
In figures 8(b) and (c) was calculated by numerically taking the derivative of the expression for in equation 9 with respect to . As in the experiments, the chemical potential of the drain was set to (i.e., the drain contact was grounded). Note that if there is no two-step process and the result of a single-level quantum dot is recovered.
References
References
- [1] Munier B, de Visser S P and Shaik S 2004 Chemical Reviews 104 3947–3980 pMID: 15352783 (Preprint http://pubs.acs.org/doi/pdf/10.1021/cr020443g) URL http://pubs.acs.org/doi/abs/10.1021/cr020443g
- [2] Marcus R A and Sutin N 1985 Biochimica et Biophysica Acta (BBA) - Reviews on Bioenergetics 811 265 – 322 ISSN 0304-4173 URL http://www.sciencedirect.com/science/article/pii/030441738590014X
- [3] Bendall D S 1996 Protein Electron Transfer (Oxford: BIOS Publishers)
- [4] Tao N J 1996 Phys. Rev. Lett. 76(21) 4066–4069 URL http://link.aps.org/doi/10.1103/PhysRevLett.76.4066
- [5] Chi Q, Farver O and Ulstrup J 2005 Proceedings of the National Academy of Sciences of the United States of America 102 16203–16208 (Preprint http://www.pnas.org/content/102/45/16203.full.pdf+html) URL http://www.pnas.org/content/102/45/16203.abstract
- [6] Alessandrini A, Corni S and Facci P 2006 Phys. Chem. Chem. Phys. 8(38) 4383–4397 URL http://dx.doi.org/10.1039/B607021C
- [7] Alessandrini A, Salerno M, Frabboni S and Facci P 2005 Applied Physics Letters 86 133902 (pages 3) URL http://link.aip.org/link/?APL/86/133902/1
- [8] Ron I, Sepunaru L, Itzhakov S, Belenkova T, Friedman N, Pecht I, Sheves M and Cahen D 2010 Journal of the American Chemical Society 132 4131–4140 pMID: 20210314 (Preprint http://pubs.acs.org/doi/pdf/10.1021/ja907328r) URL http://pubs.acs.org/doi/abs/10.1021/ja907328r
- [9] Park H, Lim A K L, Alivisatos A P, Park J and McEuen P L 1999 Applied Physics Letters 75 301–303 URL http://link.aip.org/link/?APL/75/301/1
- [10] Park J, Pasupathy A N, Goldsmith J I, Chang C, Yaish Y, Petta J R, Rinkoski M, Sethna J P, Abruna H D, McEuen P L and Ralph D C 2002 Nature 417 722–725 URL http://dx.doi.org/10.1038/nature00791
- [11] Kubatkin S, Danilov A, Hjort M, Cornil J, Bredas J L, Stuhr-Hansen N, Hedegard P and Bjornholm T 2003 Nature 425 698 – 701 URL http://dx.doi.org/10.1038/nature02010
- [12] Yu L H, Keane Z K, Ciszek J W, Cheng L, Stewart M P, Tour J M and Natelson D 2004 Physical Review Letters 93 266802 URL http://link.aps.org/doi/10.1103/PhysRevLett.93.266802
- [13] van der Zant H S J, Osorio E A, Poot M and O’Neill K 2006 physica status solidi (b) 243 3408–3412 ISSN 1521-3951 URL http://dx.doi.org/10.1002/pssb.200669185
- [14] van der Zant H S J, Kervennic Y V, Poot M, O’Neill K, de Groot Z, Thijssen J M, Heersche H B, Stuhr-Hansen N, Bjornholm T, Vanmaekelbergh D, van Walree C A and Jenneskens L W 2006 Faraday Discuss. 131 347–356 URL http://dx.doi.org/10.1039/B506240N
- [15] Garrett R H and Grisham C M 1999 Biochemistry (Harcourt-Brace College Publishers) pp 480 – 481, 114
- [16] Houck A A, Labaziewicz J, Chan E K, Folk J A and Chuang I L 2005 Nano Letters 5 1685–1688 (Preprint http://pubs.acs.org/doi/pdf/10.1021/nl050799i) URL http://pubs.acs.org/doi/abs/10.1021/nl050799i
- [17] Chae D H, Berry J F, Jung S, Cotton F A, Murillo C A and Yao Z 2006 Nano Letters 6 165–168 (Preprint http://pubs.acs.org/doi/pdf/10.1021/nl0519027) URL http://pubs.acs.org/doi/abs/10.1021/nl0519027
- [18] Hayashi T and Fujisawa T 2008 Nanotechnology 19 145709 URL http://stacks.iop.org/0957-4484/19/i=14/a=145709
- [19] Li D 2009 Exploring electron transfer in myoglobin-based transistors Ph.D. thesis West Virginia University
- [20] Esen G and Fuhrer M S 2005 Applied Physics Letters 87 263101 (pages 3) URL http://link.aip.org/link/?APL/87/263101/1
- [21] Taychatanapat T, Bolotin K I, Kuemmeth F and Ralph D C 2007 Nano Letters 7 652–656 (Preprint http://pubs.acs.org/doi/pdf/10.1021/nl062631i) URL http://pubs.acs.org/doi/abs/10.1021/nl062631i
- [22] Ward D R, Halas N J and Natelson D 2008 Applied Physics Letters 93 213108 (pages 3) URL http://link.aip.org/link/?APL/93/213108/1
- [23] Dong J and Parviz B A 2006 Nanotechnology 17 5124 URL http://stacks.iop.org/0957-4484/17/i=20/a=014
- [24] Fowler A B, Timp G L, Wainer J J and Webb R A 1986 Phys. Rev. Lett. 57(1) 138–141 URL http://link.aps.org/doi/10.1103/PhysRevLett.57.138
- [25] Azbel M Y, Hartstein A and DiVincenzo D P 1984 Phys. Rev. Lett. 52(18) 1641–1644 URL http://link.aps.org/doi/10.1103/PhysRevLett.52.1641
- [26] Kastner M A 2000 Ann. Phys. (Leipzig) 9 885–894
- [27] Shih C, Museth A K, Abrahamsson M, Blanco-Rodriguez A M, Di Bilio A J, Sudhamsu J, Crane B R, Ronayne K L, Towrie M, Vlcek A, Richards J H, Winkler J R and Gray H B 2008 Science 320 1760–1762 (Preprint http://www.sciencemag.org/content/320/5884/1760.full.pdf) URL http://www.sciencemag.org/content/320/5884/1760.abstract
- [28] Strachan D R, Smith D E, Johnston D E, Park T H, Therien M J, Bonnell D A and Johnson A T 2005 Applied Physics Letters 86 043109 (pages 3) URL http://link.aip.org/link/?APL/86/043109/1
- [29] Rosca F, Kumar A T N, Ye X, Sjodin T, Demidov A A and Champion P M 2000 The Journal of Physical Chemistry A 104 4280–4290 (Preprint http://pubs.acs.org/doi/pdf/10.1021/jp993617f) URL http://pubs.acs.org/doi/abs/10.1021/jp993617f
- [30] Gruia F, Kubo M, Ye X and Champion P M 2008 Biophysical Journal 94(6) 2252–2268
- [31] Feng M and Tachikawa H 2001 Journal of the American Chemical Society 123 3013–3020 pMID: 11457012 (Preprint http://pubs.acs.org/doi/pdf/10.1021/ja003088p) URL http://pubs.acs.org/doi/abs/10.1021/ja003088p
- [32] Wei F, Zhang D, Halas N J and Hartgerink J D 2008 The Journal of Physical Chemistry B 112 9158–9164 pMID: 18610961 (Preprint http://pubs.acs.org/doi/pdf/10.1021/jp8025732) URL http://pubs.acs.org/doi/abs/10.1021/jp8025732
- [33] Tezcan F A, Winkler J R and Gray H B 1998 Journal of the American Chemical Society 120 13383–13388 (Preprint http://pubs.acs.org/doi/pdf/10.1021/ja982536e) URL http://pubs.acs.org/doi/abs/10.1021/ja982536e
- [34] Cherepanov D A, Krishtalik L I and Mulkidjanian A Y 2001 Biophysical Journal 80 1033 – 1049 ISSN 0006-3495 URL http://www.sciencedirect.com/science/article/pii/S0006349501760845
- [35] Bonet E, Deshmukh M M and Ralph D C 2002 Phys. Rev. B 65(4) 045317 URL http://link.aps.org/doi/10.1103/PhysRevB.65.045317
- [36] Park J 2003 Electron Transport in Single Molecule Transistors Ph.D. thesis University of California – Berkeley
- [37] Stavrov S S 2004 Biopolymers 74 37–40 ISSN 1097-0282 URL http://dx.doi.org/10.1002/bip.20039
- [38] Spiro T G 1988 Biological Applications of Raman Spectroscopy (Wiley and Sons) pp 133–215