Pinning an Ion with an Intracavity Optical Lattice
Abstract
We report one-dimensional pinning of a single ion by an optical lattice. A standing-wave cavity produces the lattice potential along the rf-field-free axis of a linear Paul trap. The ion’s localization is detected by measuring its fluorescence when excited by standing-wave fields with the same period, but different spatial phases. The experiments agree with an analytical model of the localization process, which we test against numerical simulations. For the best localization achieved, the ion’s average coupling to the cavity field is enhanced from 50% to 81(3)% of its maximum possible value, and we infer that the ion is bound in a lattice well with over 97% probability.
pacs:
37.10.Vz, 37.10.Jk, 37.10.Ty, 37.30.+iThe fields of ultracold trapped neutral atoms and ions generally rely on unrelated trapping technologies. Ions can be trapped using Lorentz forces, including pure Coulomb forces. Such traps can be very deep (), but have typical length scales of at least because parasitic surface charges disturb the ion’s motion if electrodes are too close to it. Neutral atom traps require position-dependent perturbation of internal energy levels, generally induced by optical or magnetic fields. The resulting potentials are shallower (typically a few tens of or less), but can have optical-wavelength-scale structure Grimm et al. (2000); Schmied et al. (2010). Confining ions using such finely tailored potentials would be valuable for quantum simulations of many-body physics with ion crystals Porras and Cirac (2004); Friedenauer et al. (2008); Schmied et al. (2008); Kim et al. (2010); Britton et al. (2012); Schneider et al. (2012a), for studies of the Coulomb-Frenkel-Kontorova model for friction García-Mata et al. (2007); Benassi et al. (2011); Pruttivarasin et al. (2011), for studies of dynamical localization El Ghafar et al. (1997), for studies of particles in potentials with significant quantum fluctuations of their own Bushev et al. (2004); Cormick and Morigi (2012), and for optimized spatial phase matching of ion crystals to optical modes in cavity QED experiments Herskind et al. (2009a); Albert et al. (2011).
Confining ions via internal state manipulation is challenging because the achievable forces, though just as strong in ions as in atoms Cormick et al. (2011), are weak compared to typical Coulomb forces in ion traps Schneider et al. (2012b). Anomalously slow ion diffusion through a polarization lattice has been observed Katori et al. (1997), and purely optical ion trapping in a Gaussian beam of waist radius has been demonstrated Schneider et al. (2010), but ion confinement in an optical-wavelength-scale potential has so far remained an open problem.
Here we demonstrate the pinning of an ion, held in a linear Paul trap, by the one-dimensional lattice potential generated by the standing-wave field in an optical resonator. As our imaging system cannot resolve lattice sites, we observe the lattice’s effects using the ion’s fluorescence in structured driving fields Guthöhrlein et al. (2001); Mundt et al. (2002); Eschner (2003); Walther et al. (2012). One such field is the lattice itself, whose scattering rate is a measure of the ion’s average potential energy. We also employ a near-detuned standing-wave probe field, verifying that its scattering is suppressed when probe intensity minima align with lattice wells. We present a classical analytical model which quantitatively agrees with our observations.
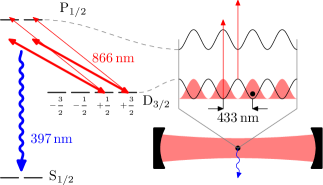
The apparatus is described in Refs. Herskind et al. (2008, 2009b), and its essential elements are sketched in Fig. 1. A single ion is held in a linear Paul trap operating at a drive frequency, with radial and axial trapping frequencies of and , respectively. Every experimental cycle begins with of Doppler cooling on the transition, with a repumper on , preparing the ion in an approximately thermal motional state Metcalf and Van Der Straten (1999). The ion is then pumped into by switching off the repumper for . Finally, the cooling light is extinguished and a -period optical lattice is generated by driving an -long near-confocal cavity of finesse and waist radius , whose optical axis coincides with the nodal line of the Paul trap Herskind et al. (2009b). The lattice is -polarized relative to a bias field along the cavity axis and is detuned from the transition by . The optical potential is ramped up in , held high for while we observe the ion’s fluorescence, and then switched off before the cycle repeats.
As we discuss below, the fluorescence process used to observe the ion also leads to loss of the ion from the internal states which feel the lattice potential. For long hold times, the probability of ion loss approaches unity, causing the fluorescence signal to saturate to an uninteresting constant. The hold time is a compromise choice, long enough to yield a detectable fluorescence signal but shorter than the ion’s lifetime in the lattice. This hold time can be extended in future experiments by reducing the lattice scattering rate, either by increasing the lattice laser detuning or, in the case of a blue-detuned lattice whose scattering rate scales with the ion’s potential energy, by cooling the ion further.
Certain features of this experiment allow us to describe the lattice’s effect with a simple analytical model, enabling quantitative data analysis. First, note that the lattice drives an open transition from the metastable state. 96% of photon scattering events transfer the ion to either or the substates of , where it plays no further role in the experiment. Hence, an observable ion has not been subject to significant dissipative radiation-pressure forces while in the lattice, and its dynamics are those of a classical particle in a conservative potential.
A second simplification is that the Paul trap is loose enough that the ion position distribution extends over many lattice sites. It follows that the change in the harmonic trap potential within a single site is small compared to the thermal energy, and hence the potential in each site has approximately the same shape. Since the momentum distribution in the initial thermal state is also the same everywhere, the ion’s motion can be adequately described using a single site with periodic boundary conditions.
Finally, the lattice ramp-up is slow compared to typical oscillation frequencies in a site (), such that the action of the ion’s trajectory is conserved (see Ref. Wells and Siklos (2007), for instance)111 Strictly speaking, this argument cannot be applied to trajectories near the unstable equilibrium point at the top of a lattice barrier, for which the oscillation period diverges. The problematic region of phase space is small enough not to affect significantly the accuracy of our results.. Knowing the action’s distribution in the initial thermal state and the action as a function of energy in the sinusoidal lattice potential, we predict the energy distribution in the lattice
| (1) |
where is the energy (measured from the local trap potential), is the initial thermal energy, is the period of the trajectory normalized to that of small oscillations in the lattice
| (2) |
and is the corresponding dimensionless action
| (3) |
with and being the complete elliptic integrals of the first and second kind, respectively. All energies are expressed in units of the lattice depth.
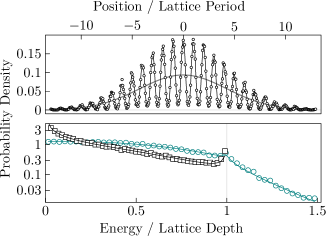
This total energy distribution and the associated lattice potential distribution are shown together with the position distribution in Fig. 2 for typical experimental parameters, along with histograms obtained from molecular dynamics (MD) simulations of our experiment. The model position distribution (upper graph) illustrates the nature of the localization: the ion’s global position uncertainty remains as large as in the initial thermal state (grey Gaussian), but in any given experimental realization the ion has a high probability of being pinned in a lattice well aligned with the cavity field. The vertical line in the lower plot indicates the top of the lattice. The portion of the total energy distribution (teal line, circles) to the left of this line is pinned in a lattice well. For all three distributions, there is excellent agreement between the full MD simulations, including the effects of finite lattice ramp-up time and of the harmonic trap potential, and the analytical model. This tests our assumptions and confirms that a single-site model with adiabatic lattice ramp-up describes the essential physics of the experiment.
Experimentally, we can observe neither the full energy distribution nor the interesting subwavelength features of the position distribution directly. To detect the lattice’s effect on the ion, we first observe the scattering of lattice light, which varies with the ion’s potential energy. Inelastic scattering to the level is the dominant scattering process (93% probability), and it produces a background-free fluorescence signal which can be observed with shot-noise-limited resolution by an image-intensified CCD camera. By comparing this fluorescence signal to one obtained when the ion is deterministically depumped to with a resonant laser pulse, we obtain a calibrated measure of the ion’s probability to scatter a lattice photon.
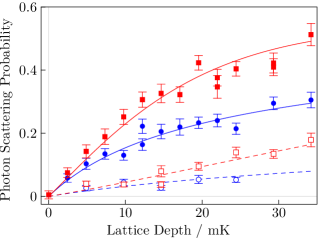
To obtain an unambiguous localization signal, we compare the photon scattering probability for red- and blue-detuned lattices. These generate identical potentials with the same maximum scattering rate, but a red-detuned lattice pins the ion at lattice antinodes, increasing scattering beyond the delocalized average, while a blue-detuned lattice pins the ion at the nodes, where scattering is suppressed. Differences in scattering between the two scenarios are a signature of ion localization in the lattice potential. Figure 3 shows the probability to scatter a lattice photon in the after ramp-up for detunings of (solid red squares and blue circles). The regular spacing of the cavity modes ensures that the absolute detunings of the two lattices are equal to within one part in . The observed scattering is systematically higher for the red-detuned lattice, indicating that the ion spends the majority of its time in the lower half of the lattice potential.
The initial optical pumping into does not polarize the ion, which has equal probability to be in each of the four Zeeman substates. An ion in or does not couple to the lattice field and is ignored. Of the remaining substates, has the strongest transition dipole moment and sees a lattice three times deeper than the one seen by . We plot raw data obtained by observing both bright levels, but report lattice depths and localization results for . In future experiments with several ions, optical pumping into will ensure that all ions see the stronger lattice Herskind et al. (2009a).
The solid curves in Fig. 3 are model-predicted fluorescence signals, computed from the known intensity profile of the intracavity fields and the model-supplied ion position distribution for each Zeeman component. The model accounts for ion loss during lattice ramp-up, which we have also measured as an independent cross-check (Fig. 3, open symbols and dashed lines). We find that this simple model provides a good quantitative description of the observed scattering probabilities. The pair of curves are fit with the initial temperature as the only free parameter. We obtain a temperature of , ten times the Doppler limit and consistent with the ion’s observed position spread in the Paul trap.
We have verified that red- and blue-detuned lattices produce indistinguishable scattering signals if the ion is forcibly delocalized by driving it with an axial rf electric field. Indeed, the localization experiment requires careful minimization of stray axial rf fields produced by the Paul trap Berkeland et al. (1998). Fields driving only a few nanometers of motion in a free ion suffice to destroy the localization signal in both laboratory and numerical experiments, presumably because the ion’s response is resonantly enhanced near the lattice depth for which the oscillation frequency in a well matches the trap drive frequency. Suppressing trap-driven rf motion is a difficulty particular to Paul traps, but it can be overcome by turning off the rf drive while the ion is in the lattice Schneider et al. (2010, 2012b).
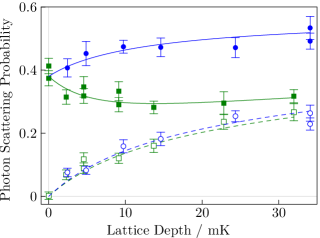
As a second measure of the ion’s position distribution, we excite the pinned ion with a near-resonant probe field and observe the resulting increase in photon scattering. The boundary conditions imposed by the cavity mirrors ensure that, at the ion’s location in the center of the cavity, the standing wave of the probe field overlaps with that of the lattice when they are separated in frequency by an even number of cavity free spectral ranges. In this case, localization of the ion enhances or suppresses scattering from both fields in the same way. When the fields are separated by an odd number of free spectral ranges, the nodes of the probe field align with the antinodes of the lattice and suppression of one scattering rate accompanies enhancement of the other. The probe scattering has an additional position dependence due to the lattice-induced Stark shift, since the probe detuning from the transition changes by twice the local lattice potential (Fig. 1). We detune the probe by to be less sensitive to this shift. The observed scattering probabilities for blue lattice detunings of (16 free spectral ranges from the probe) and (15 free spectral ranges from the probe) are shown in Fig. 4 (green squares and blue circles respectively). The 6.7% change in lattice detuning triples the probe field’s contribution to the scattering signal, as the ion goes from being pinned near probe nodes to being pinned near probe antinodes. This is visible in Fig. 4 as an increased separation between the signal with the probe on (solid symbols) and the lattice-only signal (open symbols). Again, model predictions agree with the observed scattering rates. We fit all four curves simultaneously with two free parameters: the initial ion temperature [] and the probe power. The probe power obtained in the fit is consistent with that independently measured in the experiment.
For the strongest localization ( initial temperature, final lattice depth), the ion’s average coupling to an appropriate cavity mode increases from 50% of its maximum value for a delocalized ion to 81(3)% when the ion is pinned. This finding is independent of the details of our model, in that the scattering rates we measure are directly proportional to cavity coupling, and we need only correct for loss during lattice ramp-up, which we have independently measured, and for the signal from the component. To infer a more detailed distribution, we interpret the scattering data using the single-site model, supported by its good agreement with numerical simulations and with probe and lattice scattering data over a range of lattice depths. The inferred energy distribution shows that the ion is captured in a single lattice well with over 97% probability.
We have demonstrated pinning of an ion by an optical-wavelength-scale potential. We propose to apply the same techniques to ion strings, introducing a competition between the lattice potential and the Coulomb repulsion between ions, leading eventually to the experimental study of the Coulomb-Frenkel-Kontorova model for ion strings and lattices with incommensurate spacing García-Mata et al. (2007); Benassi et al. (2011); Pruttivarasin et al. (2011), the study of structural phases of ion crystals in quantum potentials Cormick and Morigi (2012), structural control of large Wigner crystals, and the pinning of ions to cavity field antinodes to maximize cooperativity in cavity QED experiments Herskind et al. (2009a); Albert et al. (2011).
We note that closely related results are reported in Ref. Enderlein et al. (2012).
We acknowledge helpful discussions with P. Horak. M. Marciante was supported by the CNRS in the frame of a PICS. This work was supported by the European Commission (STREP PICC and ITN CCQED) and the Carlsberg Foundation.
References
- Grimm et al. (2000) R. Grimm, M. Weidemüller, and Y. B. Ovchinnikov, Adv. At. Mol. Opt. Phys. 42, 95 (2000).
- Schmied et al. (2010) R. Schmied, D. Leibfried, R. J. C. Spreeuw, and S. Whitlock, New J. Phys. 12, 103029 (2010).
- Porras and Cirac (2004) D. Porras and J. I. Cirac, Phys. Rev. Lett. 93, 263602 (2004).
- Friedenauer et al. (2008) A. Friedenauer, H. Schmitz, J. T. Glueckert, D. Porras, and T. Schaetz, Nat. Phys. 4, 757 (2008).
- Schmied et al. (2008) R. Schmied, T. Roscilde, V. Murg, D. Porras, and J. I. Cirac, New J. Phys. 10, 045017 (2008).
- Kim et al. (2010) K. Kim, M.-S. Chang, S. Korenblit, R. Islam, E. E. Edwards, J. K. Freericks, G.-D. Lin, L.-M. Duan, and C. Monroe, Nature (London) 465, 590 (2010).
- Britton et al. (2012) J. W. Britton, B. C. Sawyer, A. C. Keith, C.-C. J. Wang, J. W. Freericks, H. Uys, M. J. Biercuk, and J. J. Bollinger, Nature (London) 484, 489 (2012).
- Schneider et al. (2012a) C. Schneider, D. Porras, and T. Schaetz, Rep. Prog. Phys. 75, 024401 (2012a).
- García-Mata et al. (2007) I. García-Mata, O. V. Zhirov, and D. L. Shepelyansky, Eur. Phys. J. D 41, 325 (2007).
- Benassi et al. (2011) A. Benassi, A. Vanossi, and E. Tosatti, Nat. Comm. 2, 236 (2011).
- Pruttivarasin et al. (2011) T. Pruttivarasin, M. Ramm, I. Talukdar, A. Kreuter, and H. Häffner, New J. Phys. 13, 075012 (2011).
- El Ghafar et al. (1997) M. El Ghafar, P. Törmä, V. Savichev, E. Mayr, A. Zeiler, and W. P. Schleich, Phys. Rev. Lett. 78, 4181 (1997).
- Bushev et al. (2004) P. Bushev, A. Wilson, J. Eschner, C. Raab, F. Schmidt-Kaler, C. Becher, and R. Blatt, Phys. Rev. Lett. 92, 223602 (2004).
- Cormick and Morigi (2012) C. Cormick and G. Morigi, Phys. Rev. Lett. 109, 053003 (2012).
- Herskind et al. (2009a) P. F. Herskind, A. Dantan, J. P. Marler, M. Albert, and M. Drewsen, Nat. Phys. 5, 494 (2009a).
- Albert et al. (2011) M. Albert, A. Dantan, and M. Drewsen, Nat. Photonics 5, 633 (2011).
- Cormick et al. (2011) C. Cormick, T. Schaetz, and G. Morigi, New J. Phys. 13, 043019 (2011).
- Schneider et al. (2012b) C. Schneider, M. Enderlein, T. Huber, S. Dürr, and T. Schaetz, Phys. Rev. A 85, 013422 (2012b).
- Katori et al. (1997) H. Katori, S. Schlipf, and H. Walther, Phys. Rev. Lett. 79, 2221 (1997).
- Schneider et al. (2010) C. Schneider, M. Enderlein, T. Huber, and T. Schaetz, Nat. Photonics 4, 772 (2010).
- Guthöhrlein et al. (2001) G. R. Guthöhrlein, M. Keller, K. Hayasaka, W. Lange, and H. Walther, Nature (London) 414, 49 (2001).
- Mundt et al. (2002) A. B. Mundt, A. Kreuter, C. Becher, D. Leibfried, J. Eschner, F. Schmidt-Kaler, and R. Blatt, Phys. Rev. Lett. 89, 103001 (2002).
- Eschner (2003) J. Eschner, Eur. Phys. J. D 22, 341 (2003).
- Walther et al. (2012) A. Walther, U. Poschinger, K. Singer, and F. Schmidt-Kaler, Appl. Phys. B 107, 1061 (2012).
- Herskind et al. (2008) P. Herskind, A. Dantan, M. B. Langkilde-Lauesen, A. Mortensen, J. L. Sørensen, and M. Drewsen, Appl. Phys. B 93, 373 (2008).
- Herskind et al. (2009b) P. F. Herskind, A. Dantan, M. Albert, J. P. Marler, and M. Drewsen, J. Phys. B 42, 154008 (2009b).
- Metcalf and Van Der Straten (1999) H. J. Metcalf and P. Van Der Straten, Laser Cooling and Trapping, Graduate Texts in Contemporary Physics (Springer, New York, 1999).
- Wells and Siklos (2007) C. G. Wells and S. T. C. Siklos, Eur. J. Phys. 28, 105 (2007).
- Note (1) Strictly speaking, this argument cannot be applied to trajectories near the unstable equilibrium point at the top of a lattice barrier, for which the oscillation period diverges. The problematic region of phase space is small enough not to affect significantly the accuracy of our results.
- Berkeland et al. (1998) D. J. Berkeland, J. D. Miller, J. C. Bergquist, W. M. Itano, and D. J. Wineland, J. Appl. Phys. 83, 5025 (1998).
- Enderlein et al. (2012) M. Enderlein, T. Huber, C. Schneider, and T. Schaetz, “Single ions trapped in a one-dimensional optical lattice,” arXiv:1208.3329v1 (2012).