The age-metallicity relationship of the Large Magellanic Cloud field star population from wide-field Washington photometry
Abstract
We analyze age and metallicity estimates for an unprecedented database of some 5.5 million stars distributed throughout the Large Magellanic Cloud (LMC) main body, obtained from CCD Washington photometry, reported on in Piatti et al. 2012. We produce a comprehensive field star Age-Metallicity Relationship (AMR) from the earliest epoch until 1 Gyr ago. This AMR reveals that the LMC has not evolved chemically as either a closed-box or bursting system, exclusively, but as a combination of both scenarios that have varied in relative strength over the lifetime of the galaxy, although the bursting model falls closer to the data in general. Furthermore, while old and metal-poor field stars have been preferentially formed in the outer disk, younger and more metal-rich stars have mostly been formed in the inner disk, confirming an outside-in formation. We provide evidence for the formation of stars between 5 and 12 Gyr, during the cluster age gap, although chemical enrichment during this period was minimal. We find no significant metallicity gradient in the LMC. We also find that the range in the metallicity of an LMC field has varied during the lifetime of the LMC. In particular, we find only a small range of the metal abundance in the outer disk fields, whereas an average range of [Fe/H] = +0.3 0.1 dex appears in the inner disk fields. Finally, the cluster and field AMRs show a satisfactory match only for the last 3 Gyr, while for the oldest ages ( 11 Gyr) the cluster AMR is a remarkable lower envelope to the field AMR. Such a difference may be due to the very rapid early chemical evolution and lack of observed field stars in this regime, whereas the globular clusters are easily studied. This large difference is not easy to explain as coming from stripped ancient Small Magellanic Cloud (SMC) clusters, although the field SMC AMR is on average 0.4 dex more metal-poor at all ages than that of the LMC but otherwise very similar.
1 Introduction
The Large Magellanic Cloud (LMC) has long been recognized as a fundamental benchmark for a wide variety of astrophysical studies. As the closest bulge-less dwarf disk galaxy (Bekki, 2012), it has turned out to be the ideal local analog for the detailed study of these most common and primeval galaxies. Ages and abundances of LMC field star populations are prime indicators of the galaxy’s chemical evolution and star formation history (SFH). This becomes even more relevant since its formation and chemical evolution cannot be fully traced from its star cluster populations, due to the well-known extended age gap. The LMC age-metallicity relationship (AMR) has been the subject of a number of studies (Olszewski et al., 1991; Holtzman et al., 1999; Cole et al., 2005; Rubele et al., 2011, among others). Among them, two perhaps best summarize our current knowledge in this field. First, Carrera et al. (2011, hereafter CGAH; see also references therein) have examined the AMR for field star populations, based on Calcium triplet spectroscopy of individual red giants and BVRI photometry in ten 3433 LMC fields. They found that: i) the AMRs for their fields are statistically indistinguishable; ii) the disk AMR is similar to that of the LMC star clusters and is well reproduced by closed-box models or models with a small degree of outflow; iii) the lack of clusters with ages between 3 and 10 Gyr is not observed in the field population; iv) the age of the youngest population observed in each field increases with galactocentric distance; v) the rapid chemical enrichment observed in the last few Gyrs is only observed in fields with R7kpc; vi) the metallicity gradient observed in the outer disk can be explained by an increase in the age of the youngest stars and a concomitant decrease in their metallicity; and vii) they find much better evidence for an outside-in than inside-out formation scenario, in contradiction to generic models. Secondly, Harris & Zaritsky (2009, hereafter HZ09; see also references therein)) presented the first-ever global, spatially-resolved reconstruction of the SFH, based on the application of their StarFISH analysis software to the multiband photometry of twenty million stars from the Magellanic Clouds Photometric Survey. They found that there existed a long relatively quiescent epoch (from 12 to 5 Gyr ago) during which the star formation was suppressed throughout the LMC; the metallicity also remained stagnant during this period. They concluded that the field and cluster star formation modes have been tightly coupled throughout the LMC’s history.
Although these studies represent the state-of-the-art of our knowledge of the LMC AMR, they leave unanswered a number of outstanding questions: What caused the general lull in SF between 5 and 12 Gyr ago? Are the cluster and field AMRs really tightly coupled? Can the LMC AMR best be described by a closed-box, bursting or other chemical evolution model? What, if any, are the radial dependences? In addition, HZ09 did not go deep enough to derive the full SFH from information on the Main Sequence (MS). They reached a limiting magnitude between = 20 and 21 mag, depending on the local degree of crowding in the images, corresponding to stars younger than 3 Gyr old on the MS if the theoretical isochrones of Girardi et al. (2002) and a LMC distance modulus of 18.5 mag are used. Thus, the advantages of covering an enormous extension of the LMC is partially offset by the loss in depth of the limiting magnitude. On the other hand, the ten fields of CGAH cover a rather small fraction of the whole LMC. Therefore, it is desirable to obtain an overall deeper AMR for the LMC which also covers a larger area. Previous AMRs have been founded on theoretical isochrones, numerical models, or synthetic Color-Magnitude Diagrams (CMDs), so that an AMR built from actual measured ages and metallicities is very valuable. A comprehensive comparison between the field and cluster AMRs obtained using the same procedure is also lacking. All these aims demand the availability of a huge volume of high quality data as well as a powerful technique to provide both accurate ages and metallicities.
In this paper we address these issues for the first time. We make use of an unprecedented database of some 5.5 million stars measured with the Washington photometric system, which are spread over a large part of the LMC main body. From this database, we produce the LMC field AMR from the birth of the galaxy until 1 Gyr ago, using the index and the standard giant branch isoabundance curves to estimate ages and metallicities, respectively, of the most representative field populations. These provide approximately independent measurements of these two quantities, minimizing the age-metallicity degeneracy problem. In addition, this is the first overall LMC field star AMR obtained from Washington data; thus complementing those derived from other data sets such as HZ09 or the AMR obtained from Washington data for LMC clusters (Piatti, 2011a). Finally, we homogeneously compared the derived field star AMR to that for the LMC cluster population with ages and metallicities put on the same scales using these two Washington datasets. This kind of comparison has not been accomplished before. The paper is organized as follows: Section 2 briefly describes the data handling and analysis from which Piatti et al. (2012) estimated the field star ages and metallicities. Section 3 deals with the aforementioned issue of a comprehensive AMR of the LMC field star population. In Section 4 we discuss our results and compare them with previous studies, while Section 5 summarizes our major findings.
2 Data handling and scope
We obtained Washington photometric data at the Cerro-Tololo Inter-American Observatory (CTIO) 4 m Blanco telescope with the Mosaic II camera attached (3636 field onto a 8K8K CCD detector array) of twenty-one LMC fields, concentrated in the main body but mostly avoiding the very crowded bar regions. We refer the reader to Piatti et al. (2012) for details about the observations and reduction and analysis of the data. Briefly, Piatti et al. analysed the and limiting magnitudes reached for a 50% completeness level from extensive artificial star tests, produced CMDs, Hess-diagrams, MS star luminosity functions, Red Clump star mag histograms, RGB distributions, etc, and presented a thorough description of the uncertainties involved and of the techniques used. The processed data are much deeper than those used by HZ09 and generally reach well below the MS Turnoffs (TOs) of the oldest stellar populations in the LMC ( 19.9 - 21.4 mag). In addition, the total area covered is about 2.5 times larger that that of CGAH. We subdivided each 3636 field into 16 uniform 2K2K regions (99 each).
The stellar photometry was performed using the star-finding and point-spread-function (PSF) fitting routines in the DAOPHOT/ALLSTAR suite of programs (Stetson et al., 1990). The standard Allstar - Find - Subtract procedure was repeated three times for each frame. Finally, we combined all the independent measurements of the stars in the different filters using the stand-alone DAOMATCH and DAOMASTER programmes, kindly provided by Peter Stetson.
Piatti et al. (2012) used the so-called ”representative” population, defined in Geisler et al. (2003), to measure ages for the 21 fields in the same way as Piatti (2012) did for 11 fields of the Small Magellanic Cloud (SMC). Geisler et al. (2003) assumed that the observed MS in each LMC field is the result of the superposition of MSs with different TOs (ages) and constant luminosity functions. Thus, the intrinsic number of stars belonging to any MS interval comes from the difference of the total number of stars in that interval and that of the adjacent intervals. Therefore, the biggest difference is directly related to the most populated TO. This ”representative” AMR differs from those derived from modeled SFHs in the fact that it does not include complete information on all stellar populations, but accounts for the dominant population present in each field. Minority populations are not considered, nor dominant populations younger than 1 Gyr, due to our inability to age-date them. The method has turned out to be a powerful tool for revealing the primary trends in an efficient and robust way (Piatti et al., 2003a, b, 2007).
Piatti et al. (2012) clearly identified the representative star populations in the 21 studied LMC fields, which were typically 25%-50% more frequent than the second most numerous population. They derived ages from the index, calculated by determining the difference in the magnitude of the red clump (RC) and the representative MS TO (Geisler et al., 1997). The index has proven to be a powerful tool to derive ages for star clusters older than 1 Gyr, independently of their metallicities (Bica et al., 1998; Piatti et al., 2002, 2009, 2011a; Piatti, 2011a). Indeed, Geisler et al. (1997) showed that () is very well-correlated with () (correlation coefficient = 0.993) and with (. We then derived ages from the values using equation (4) of Geisler et al. (1997), which was obtaining by fitting values of star clusters with well-known age estimates. This equation is only calibrated for ages larger than 1 Gyr, in particular because the magnitude of the He-burning stage varies with age for such massive stars, so that we are not able to produce ages for younger representative populations. Note that this age measurement technique does not require absolute photometry and is independent of reddening and distance as well. An additional advantage is that we do not need to go deep enough to see the extended MS of the representative star population but only slightly beyond its MS TO. The representative MS TO magnitude for each subfield turned out to be on average 0.6 mag brighter than the mag for the 100 completeness level of the respective subfield, so that Piatti et al. actually reach the TO of the representative population of each subfield. Note that the representative stellar population is not necessarily the oldest one reached in a subfield. Their Figs. 3 to 23 illustrate the performance of their photometric data. In their Table 5, they presented the final ages and their dispersions. Such dispersions have been calculated bearing in mind the broadness of the mag distributions of the representative MSTOs and RCs, and not just simply the photometric errors at (MSTO) and (RC) mags, respectively. The former are clearly larger and represent in general a satisfactory estimate of the age spread around the prevailing population ages, although a few individual subfields have a slightly larger age spread. We refer the reader to the companion paper by Piatti et al. (2012) for details concerning the methods and limitations and uncertainties involved.
The mean metallicity for each representative field population was obtained by first entering the positions of the representative giant branch into the [, ] plane with the Standard Giant Branch (SGB) isoabundance curves traced by Geisler & Sarajedini (1999). This was done to obtain, by interpolation, metal abundances ([Fe/H]) with typical errors of 0.20 dex. Then, they applied the appropriate age correction to these metallicities using the age-correction procedure of Geisler et al. (2003), which provides age-corrected metallicities in good general agreement with spectroscopic values (Parisi et al., 2010). The resulting metallicities and their dispersions are compiled in Table 6 of Piatti et al. (2012). Tables 5 and 6 of Piatti et al. 2012 are reproduced here as Tables 1 and 2 for completeness sake.
3 The AMR
One of the unavoidable complications in analysing measured ages and metallicities is that they have associated uncertainties. Indeed, by considering such errors, the interpretation of the resulting AMR can differ appreciably from that obtained using only the measured ages and metallicities without accounting for their errors. However, the treatment of age and metallicity errors in the AMR is not a straightforward task. Moreover, even if errors did not play an important role, the binning of age/metallicity ranges could also bias the results. For example, fixed age intervals have commonly been used to build cluster age distributions using the same cluster database (Bonatto et al., 2006; Wu et al., 2009; Piatti, 2010), with remarkably different results depending on the details of the binning process. These examples show that a fixed age bin size is not appropriate for yielding the intrinsic age distribution, since the result depends on the chosen age interval and the age errors are typically a strong function of the age. A more robust age bin is one whose width is of the order of the age errors of the clusters in that interval. This would lead to the selection of very narrow bins (in linear age) for young clusters and relatively broader age bins for the older ones.
With the aim of building an age histogram that best reproduces the intrinsic open cluster age distribution, Piatti (2010) took the uncertainties in the age estimates into account in order to define the age intervals in the whole Galactic open cluster age range. Thus, he produced a more appropriate sampling of the open clusters per age interval than is generated using a fixed bin size, since he included in each bin a number of clusters whose age errors are close to the size of this bin. Indeed, the age errors for very young clusters are a couple of Myrs, while those for the oldest clusters are at least a few Gyrs. Therefore, smaller bins are appropriate for young clusters, whereas larger bins are more suitable for the old clusters. Piatti et al. (2011a, b) have also used this precept for producing age distributions of LMC and SMC clusters, respectively.
We then searched Table 5 of Piatti et al. (2012) (the present Table 1) to find that typical age errors are 0.10 log() 0.15. Therefore, we produced the AMR of the LMC field population by setting the age bin sizes according to this logarithmic law, which traces the variation in the derived age uncertainties in terms of the measured ages. We used intervals of log() = 0.10. We proceeded in a similar way when binning the metallicity range. In this case, we adopted a [Fe/H] interval of 0.25 dex. Thus, the subdivision of the whole age and metallicity ranges was then performed on an observational-based foundation, since the (age,[Fe/H]) dimensions are determined by the typical errors for each age/metallicity range. However, there is still an additional issue to be considered: even though the (age,[Fe/H]) bins are set to match the age/metallicity errors, any individual point in the AMR plane may fall in the respective (age,[Fe/H]) bin or in any of the eight adjacent bins. This happens when an (age,[FeH]) point does not fall in the bin centre and, due to its errors, has the chance to fall outside it. Note that, since we chose bin dimensions as large as the involved errors, such points should not fall on average far beyond the adjacent bins. However, this does not necessarily happen to all 336 (age,[FeH]) points, and we should consider at the same time any other possibility.
We have taken all these effects into account to produce the AMR of the 21 studied LMC fields. First of all, we take the AMR plane as engraved by a grid of bins as mentioned above, i.e. with logarithmic and linear scales drawn along the age and metallicity axes. Then, if we put one of our (age,[Fe/H]) points in it, we find out that that point with its errors covers an area which could be represented by a box of size 4. This (age,[Fe/H]) box may or may not fall centered on one of the AMR grid bins, and has dimensions smaller, similar or larger than the AMR grid bin wherein it is placed. Each of these scenarios generates a variety of possibilities, in the sense that the (age,[Fe/H]) box could cover from one up to 25 or more AMR bins depending on its position and size. Bearing in mind all these alternatives, our strategy consisted in weighing the contribution of each (age,[Fe/H]) box to each one of the AMR grid bins occupied by it, so that the sum of all the weights equals unity. The assigned weight was computed as the ratio between the area occupied by the (age,[Fe/H]) box in a AMR grid bin to the (age,[Fe/H]) box size. When performing such a weighting process, we focused in practice on a single AMR grid bin and calculated the weighted contribution of all the 336 (age,[Fe/H]) boxes to that AMR grid bin. We then repeated the calculation for all the AMR grid bins. In order to know whether a portion of an (age,[Fe/H]) box falls in a AMR grid bin, we took into account the following possibilities and combinations between them. Once an age interval is defined, we asked whether: i) the age associated with any of the 336 (age,[Fe/H]) points is inside that age interval, ii) the age-(age) value is inside that age interval; iii) the age-(age) value is to the left of that age interval and the age is to the right; iv) the age+(age) value is inside that age interval and, v) the age+(age) value is to the right of that age interval and the age is to the left. For the metallicities we proceeded in a similar way so that we finally encompassed a total of 25 different inquiries to exactly match the positions and sizes of the 336 (age,[Fe/H]) points in the AMR plane grid. We are confident that our analysis yields accurate morphology and position of the main features in the derived AMRs.
Fig. 1 shows the resulting individual AMRs as labelled at the top-right margin of each panel. It is important to keep in mind that each of the (age,[Fe/H]) points used to make each of these plots is simply the representative, most dominant population in that subfield. The filled boxes represent the obtained mean values for each (age,[Fe/H]) bin; the age error bars follow the law log() = 0.10; and the [Fe/H] error bars come from the full width at half-maxima (FWHMs) we derived by fitting Gaussian functions to the metallicity distribution in each age interval. The fit of a single Gaussian per age bin was performed using the NGAUSSFIT routine in the STSDAS/IRAF111IRAF is distributed by the National Optical Astronomy Observatories, which is operated by the Association of Universities for Research in Astronomy, Inc., under contract with the National Science Foundation package. The centre of the Gaussian, its amplitude and its FWHM acted as variables, while the constant and the linear terms were fixed to zero, respectively. We used Gaussian fits for simplicity. We estimated a difference from Gaussian distributions of only 8 . At first glance, it can be seen that the youngest and the oldest ages of each AMR vary from field to field. The metallicity range and the shapes of the 21 AMRs are also quite variable. For example, AMRs for Fields 3, 6, and 8 do not show chemical enrichment, a feature that can be seen for example in Fields 10, 12, 13, and 14. Moderate to intermediate chemical enrichment is seen in the remaining fields. Fields 14 and 20 are the most metal-rich and the most metal-poor fields, respectively, at any time, with a mean difference between them of 0.8 dex.
In order to examine whether there exists any dependence of the individual AMRs with position in the LMC, we have made use of their deprojected galactocentric distances computed by assuming that they are part of a disk having an inclination = 35.8 and a position angle of the line of nodes of = 145 (Olsen & Salyk, 2002). We refer the reader to Table 1 of Subramanian & Subramanian (2010) which includes a summary of orientation measurements of the LMC disk plane, as well as their analysis of the orientation and other LMC disk quantities, supporting the present adopted values. Figs. 2 and 3 illustrate the behaviour of the old and the young extremes and the metal-poor and the metal-rich extremes of each AMR, respectively, as a function of the deprojected distance. Old and metal-poor extremes are drawn with open boxes, while young and metal-rich extremes are depicted with filled boxes. The error bars for ages and metallicities are those from Fig. 1, whereas the error bars of the deprojected distances come from the dispersion of this quantity within the 16 subfields used in each mosaic field. As can be seen, the outer fields -defined as those with deprojected distances 4 (Bica et al., 1998, and references therein)- contain dominant stellar populations about as old as the galaxy, while those of the inner disk do not, with the exception of Fields 9 and 18. The outer fields began at an age within our oldest age interval, although we have represented them as a single value as a result of our binning process. In general, the oldest dominant stellar populations in the inner disk fields have been formed between 5 and 8 Gyr ago. Likewise, the main stellar formation processes in the outer disk appears to have ceased some 5 1 Gyr ago. This result confirms that of Gallart et al. (2008) and CGAH concerning outside-in evolution of the LMC disk as opposed to the prediction for inside-out formation. It is interesting that the inner fields appeared to start their first strong star formation episodes at about the same time that the outer fields were undergoing their last episode. This is certainly not what is expected if the impulse driving the onset of star formation is some global effect like a close galactic encounter, e.g. with the Galaxy or the SMC. The last major epoch of star formation we are sensitive to ended about 1-2 Gyrs ago in the inner fields, with evidence for a radial age gradient.
On the metallicity side, Fig. 3 shows that for outer fields starting (open box) and ending (filled box) [Fe/H] values are very similar, which means that they have not experienced much chemical enrichment. Taking into account the open and filled boxes for these outer fields, we derived a mean value of [Fe/H] = -0.90 0.15 dex (note that their mean starting and ending metallicities are [Fe/H] = -0.950.10 dex and -0.900.10 dex, respectively). This value could be considered as the representative metallicity level for the outer disk field during the entire life of the LMC. In the inner disk, the situation is different. Firstly, the starting metal abundances (open boxes) are on average as metal-poor as the ending abundances for the most metal-rich outer fields. Secondly, there exists a mean increase in the [Fe/H] values of +0.3 0.1 dex, indicating significant chemical enrichment. If, in addition, we consider that these inner disk fields have been formed more recently than those in the outer disk, the signs of significant recent chemical enrichment are even more evident.
The apparent metallicity gradient exhibited in Fig. 3, in the sense that the more distant a field from the galaxy centre, the more metal-poor it is, is tightly coupled with the relationship shown in Fig. 2. To disentangle both dependences we fit the 336 individual metallicities (Table 2) according to the following expression:
| (1) |
where and represent the age in Gyr and the deprojected distance in degrees. The respective coefficients turned out to be = -0.55 0.02 dex, [Fe/H]/ = -0.047 0.003 dex Gyr-1, and [Fe/H]/ = -0.007 0.006 dex degrees-1, which implies a small but insignificant metallicity gradient of (-0.01 0.01) dex kpc-1, if an LMC distance of 50 kpc is adopted (Subramanian & Subramanian, 2010). Thus, there is no evidence for a significant metallicity gradient in the LMC. This result agrees with that of Grocholski et al. (2006) who found that the LMC lacks any metallicity gradient. The relatively more metal-poor stars found in the outermost regions (see Fig. 3) are mostly a consequence of the fact that such regions are dominated by old stars which are relatively metal-poor, whereas intermediate-age stars which are more metal-rich prevail in the innermost regions. This result firmly confirms CGAH’s findings.
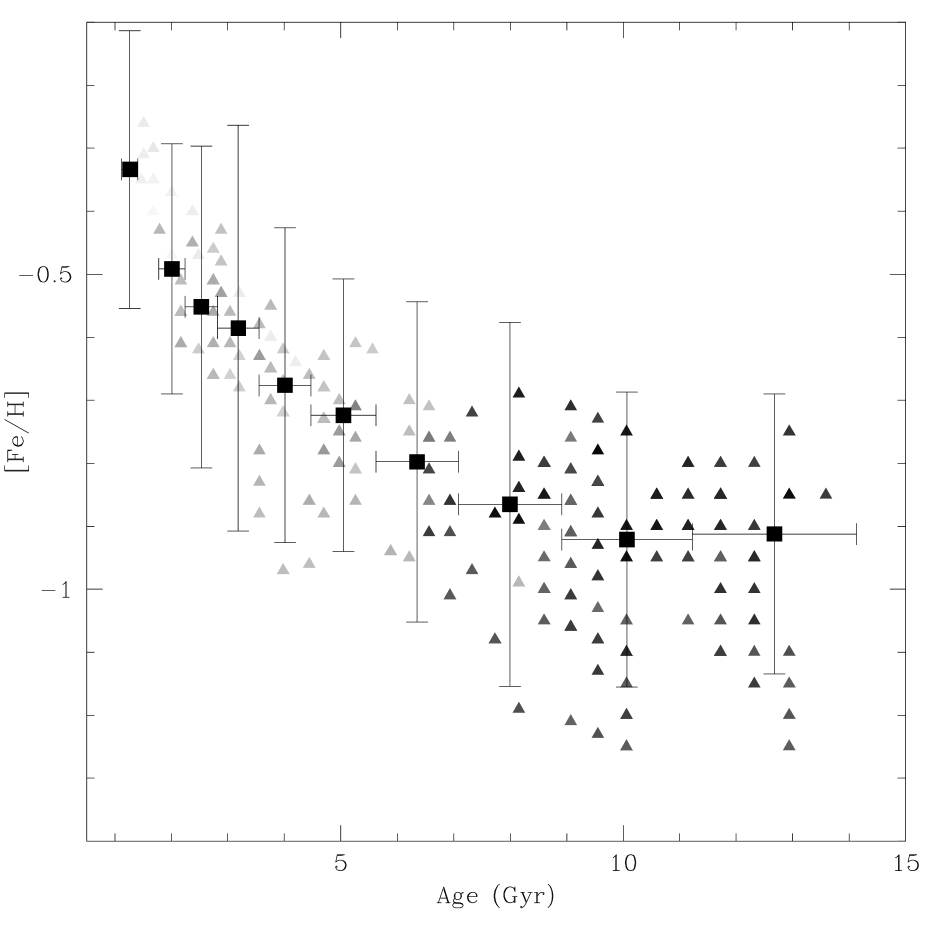
We have also produced a composite AMR for the 21 LMC fields following the same procedure used to derive the individual AMRs of Fig. 1. The result is shown in Fig. 4, where the mean points are represented with filled boxes, while the error bars are as for Fig. 1. We have also included the individual points of the 336 subfields plotted with gray-scale colored triangles. We used a 100 level gray-scale from black to white to represent the most distant to the nearest star fields to the LMC centre. As can be seen, the most distant fields have been preferentially formed at a low and relatively constant metallicity level, from the birth of the LMC until 6 Gyr ago, while the inner fields have been formed later on with a steeper chemical enrichment rate. Note also that the [Fe/H] errorbars cover a larger range than that the points represent. This is because these errorbars do not only represent the standard dispersion of the points, but also of their measured errors (see Sect. 3).
4 Comparison and discussion of the LMC AMR
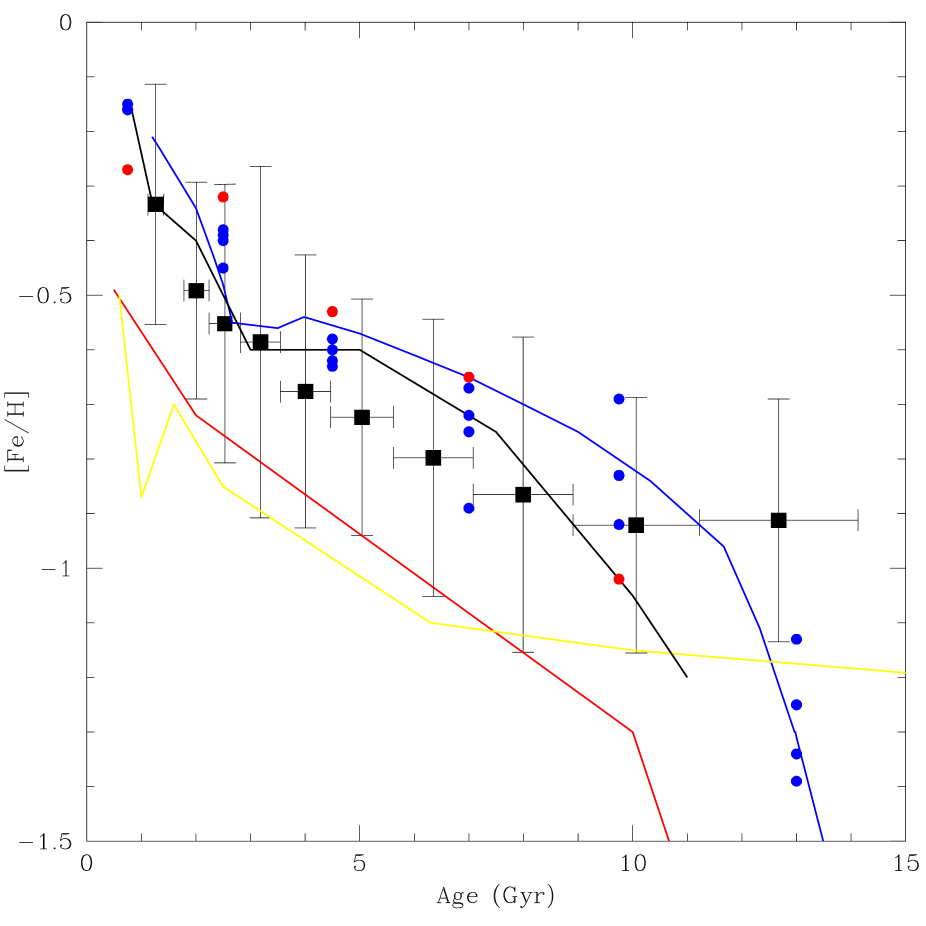
In Fig. 5, we have overplotted with solid lines different field star AMRs along with our presently derived composite AMR, namely: HZ09 (yellow), Rubele et al. (2011) (black), Pagel & Tautvaišienė (1998, hereafter PT98) (blue), and Geha et al. (1998) (red). The red line AMR is based on a closed-box model, while the blue curve is a bursting model. We also included with red and blue filled circles the AMRs derived by Carrera et al. (2008) for the LMC bar and disk, respectively. At first glance, we find that the bursting SFH modeled by PT98 appears to be the one which best resembles the AMR derived by Carrera et al. (2008), instead of closed-box models as Carrera et al. suggested. However, such a resemblance is only apparent since PT98 constructed their model using nearly no star formation from 12 up to 3 Gyr ago (see their Fig. 2). This clearly contradicts not only Carrera et al.’s result but also ours, which show that there were many stars formed in the LMC in that period (see Fig. 4). Indeed, we actually see no significant chemical evolution from about 12 - 6 Gyr, even though stars were formed. In turn, the closed-box models appear to be qualitatively closer to HZ09’s reconstructed AMR.
Since HZ09’s AMR is based on a relatively bright limiting magnitude database and CGAH’s AMRs rely on ages and metallicities for stars distributed in ten fields (each only slightly smaller than ours), we believe that the present composite AMR has several important advantages over these previous ones, and possibly reconciles previous conclusions about the major enrichment processes that have dominated the chemical evolution of the LMC from its birth until 1 Gyr ago. Note that a large number of fields distributed through the galaxy are analysed here and their representative oldest MS TOs are well measured in all fields. The composite AMR we derive results in a complex function having HZ09’s AMR (or alternatively the closed-box model) and CGAH’s AMRs (or alternatively the bursting model) as lower and approximately upper envelopes in metallicity, respectively, although the bursting model is a much better fit. Therefore, we find evidence that the LMC has not chemically evolved as a closed-box or bursting system, exclusively, but as a combination of both scenarios that likely have varied in importance during the lifetime of the galaxy, but with the bursting model dominating. The closed-box model presumably reproduces the metallicity trend that the LMC would have had if bursting formation episodes had not taken place. However, since the LMC would appear to have experienced such an enhanced formation event(s), important chemical enrichment has occurred from non well-mixed gas spread through the LMC. CGAH also found that the AMRs for their ten fields are statistically indistinguishable. We note, however, that six of their fields are aligned somewhat perpendicular to the LMC bar, reaching quite low density outer regions, and therefore, that their coverage represents a relatively small percentage of the whole field population. We show in Fig. 1 that, when more field stars distributed through the LMC are analyzed with age and metallicity uncertainties robustly considered, distinct individual AMRs do arise. Indeed, Figs. 2 and 3 illustrate how different AMRs are for inner and outer fields.
When inspecting in detail our composite field LMC AMR, the relatively quiescent epoch ( 5 to 12 Gyr) claimed by HZ09 and also frequently considered as a feature engraved in the cluster formation processes, i.e. the cluster age-gap (Geisler et al., 1997; Piatti et al., 2002; Bekki et al., 2004, among others) is not observed. On the contrary, there exists a noticeable number of fields with representative ages spanning the age gap (from 12 Gyr to 3 Gyr), which further strengthens the difference between cluster and field star formation during this epoch. Of course, we do not quantitatively compare the level of SF in different epochs, we simply measure the properties of the dominant population. However, during this extended period, although some star formation occurred, it was not accompanied by any significant chemical evolution until starting 6 Gyr ago. Again curiously, there were several Gyr of star formation and chemical evolution before the cluster age gap ended. In addition, although the ages estimated by CGAH of field stars spanning the cluster Age Gap could have uncertainties necessarily large for individual stars, and consequently their SFH would still indicate a relatively quiescent epoch between 5 and 10 Gyr as HZ09 pointed out, we provide here evidence of the existence of stars formed between 5 and 12 Gyr that represent the most numerous populations in their respective regions. Note that our metallicities are generally about 0.1 - 0.2 dex lower than CGAH for younger ages but higher for the oldest stars, indicating a smaller total chemical enrichment over the lifetime of the galaxy compared to that found by CGAH. Our agreement with Rubele et al. (2011) is somewhat better. We also find that the amount of chemical evolution (as measured by the increase in the metallicity) of the LMC fields has varied during the lifetime of the LMC. Particularly, we find only a small range of the metal abundance within the considered uncertainties for the outer disk fields, whereas an average increase of [Fe/H] = 0.3 0.1 dex appears in the inner disk fields, and this increase occurred over a relatively shorter time period. Hence, a bursting star formation scenario turns out to be a plausible explanation if the enhanced star formation is accompanied by a vigorous nucleosynthesis process that takes place during the burst.
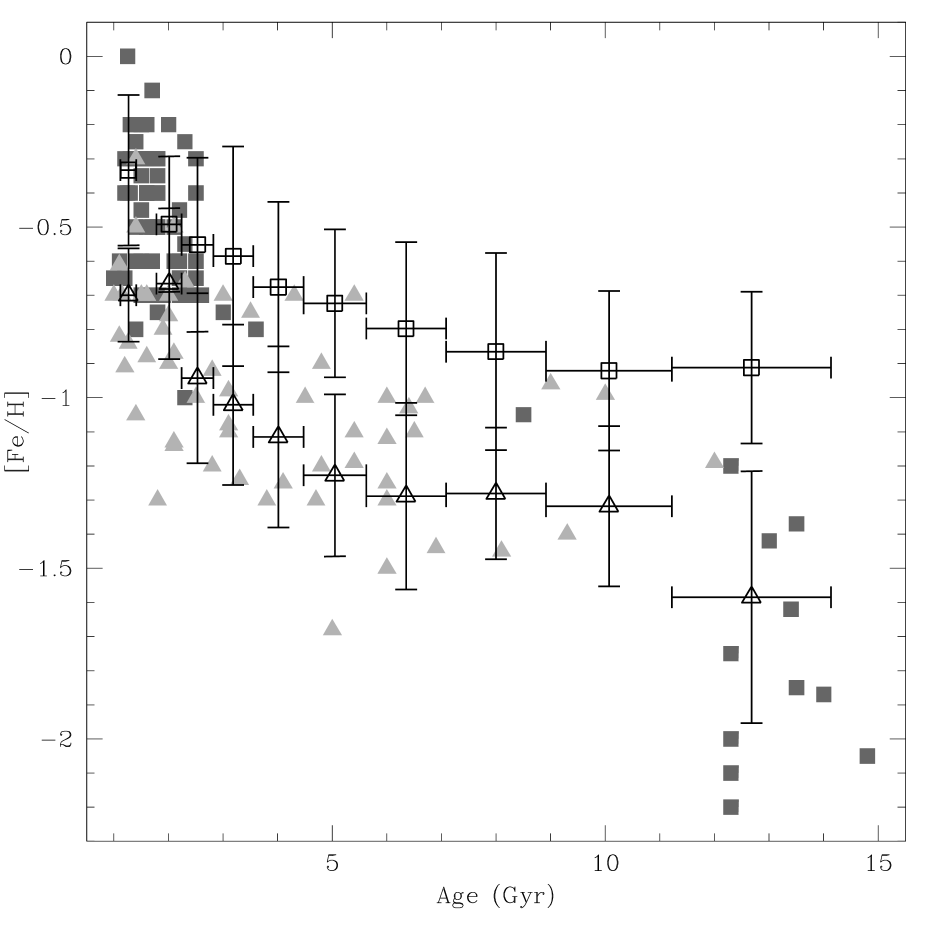
Finally, we present a homogeneous comparison between the composite field AMR with that for 81 LMC clusters with ages ( 1 Gyr) and metallicities derived on the same scales as here. We use the ages and metallicities compiled by Piatti et al. (2011a) for 45 clusters observed in the Washington system, to which we add 36 clusters with ages estimated by Piatti (2011c) from similar data. We estimate here their metallicities following the same procedure used for the studied fields (see Section 2). The resulting cluster AMR is depicted in Fig. 6 with dark-gray filled boxes superimposed onto the composite field LMC (open boxes with error bars). As can be seen, the cluster AMR satisfactorily matches the field AMR only for the last 3 Gyr, while it is a remarkable lower envelope of the field AMR for older ages ( 11 Gyr). The most likely explanation is a very rapid early chemical enrichment traced by the very visible globular clusters, but their coeval, low metallicity field counterparts are so rare that they are missed in our data. The origin of the 15 oldest LMC clusters still remains unexplained and constitutes one of the most intriguing enigmas in our understanding of the LMC formation and evolution. Different studies show that they have very similar properties to the globular clusters in the Milky Way (Brocato et al., 1996; Mackey & Gilmore, 2004; van der Bergh & Mackey, 2004; Mucciarelli et al., 2009, 2010, among others), except for their orbits, which are within the LMC disk instead of in an isothermal halo (Bekki, 2007). On the other hand, Fig. 4 show that there exist field star populations older than 10 Gyr and about as old as the old globulars. These results go along with the curious conundrum of the absence of clusters during the infamous Age Gap (Bekki et al., 2004). Since HZ09 found that there was a relatively quiescent epoch in the field star formation from approximately 12 to 5 Gyr ago (similar to that observed for star clusters), they also concluded that field and cluster star formation modes are tightly coupled. Notice that the ages and metallicities used by HZ09 for the 85 clusters are not themselves on a homogeneous scale nor on the same field age/metallicity scales.
In order to look for clues for the very low metallicities of the oldest LMC clusters, we reconstructed the cluster and field AMRs of the SMC, also from Washington photometry obtained by us. As for the field AMR we used the ages and metallicities derived by Piatti (2012, his Table 4)) and applied to them the same binning and error analyses as for the composite LMC field AMR (Fig. 4). Note that these ages and metallicities are all set on the present age/metallicity scales. We also compiled 59 SMC clusters ( 1 Gyr) from Piatti et al. (2011b), and Piatti (2011a, b) with ages and metallicities tied to the same scales. Fig. 6 shows the resulting SMC AMRs depicted with open triangles for its field stars and with filled triangles for its star cluster population. As can be seen, cluster and field stars apparently share similar chemical enrichment histories in the SMC, although the population of old clusters drastically decreases beyond 7 Gyr and there is only 1 older than 10 Gyr. Piatti (2011b) showed, based on the statistics of catalogued and studied clusters, that a total of only seven relatively old/old clusters remain to be studied, and an even smaller number is obtained if the cluster spatial distribution is considered. From this result, we conclude that the SMC cluster AMR is relatively well-known, particularly towards its older and more metal-poor end. Therefore, it does not seem easy to connect the origin of the oldest LMC cluster population to stripping events of ancient SMC star clusters. Moreover, the composite SMC field AMR is on average 0.4 dex more metal-poor at all ages than that of the counterpart in the LMC, with little variation, indicating that the global chemical evolution in these two galaxies was quite similar in nature but with an offset to lower metallicity in the SMC. In particular, there was a very early and rapid period of enrichment, followed by a long quiescent epoch with some star formation in both Clouds but cluster formation only in the SMC and little to no metallicity increase and finally a recent period of substantial enrichment starting about 6Gyr ago. This is in very good agreement with the SMC AMR found by Parisi et al. (2010). The relative deficiency in heavy elements of the SMC could explain the metallicity of a few old LMC clusters, if they were captured from the SMC (Besla et al., 2012), but this is an unlikely argument to explain the majority of them. In fact, it is curious in this context that the the oldest SMC cluster is at the young and metal-rich extreme of the LMC globular cluster distributions.
5 Summary
In this study we present, for the first time, the AMR of the LMC field star population from ages and metallicities derived using CCD Washington photometry of some 5.5 million stars in twenty-one 3636 fields distributed throughout the LMC main body presented in Piatti et al. (2012). The analysis of the photometric data -subdivided in 336 smaller 99 subfields - leads to the following main conclusions:
i) From ages and metallicities of the representative star population in each subfield estimated by using the index and the SGB technique, respectively, we produced individual field AMRs with a robust treatment of their age and metallicity uncertainties. These individual AMRs show some noticeable differences from field to field in several aspects: starting and ending ages, metallicity range , shape, etc. This is contrary to CGAH, who found very similar AMRs in their sample. The composite AMR for the LMC fields reveals that, while old and metal-poor field stars have been preferentially formed in the outer disk, younger and more metal-rich stars have mostly been formed in the inner disk. This result confirms an outside-in evolution of the galaxy, as found by Carrera et al. (2008). In addition, we provide evidence of the existence of stars formed between 6 and 12 Gyr that represent the most numerous populations in their respective regions, although little or no chemical evolution occured during this extended period.
ii) The resulting distribution of the ages and the metallicities as a function of the deprojected distance reveals that there is no significant metallicity gradient in the LMC ((-0.01 0.01) dex kpc-1). The relatively more metal-poor stars found in the outermost regions is mainly a consequence of the fact that such regions are dominated by old stars which are relatively metal-poor, whereas intermediate-age stars which are more metal-rich prevail in the innermost regions. We also find that the range in the metallicity of the LMC fields has varied during the lifetime of the LMC. In particular, we find only a small range of the metal abundance for the outer disk fields, whereas an average range of [Fe/H] = +0.3 0.1 dex is found in the inner disk fields.
iii) From the comparison of our composite AMR with theoretical ones, we conclude that the LMC has not chemically evolved as a closed-box or bursting system, exclusively, but as a combination of both scenarios that have had different prominence during the lifetime of the galaxy, with the bursting model generally more dominant. Enhanced formation episodes could have possibly taken place as a result of its interactions with the Milky Way and/or SMC.
iv) We finally accomplish a homogeneous comparison between the composite field AMR with that for LMC clusters with ages and metallicities on the same scales. We find a satisfactory match only for the last 3 Gyr, while for older ages ( 11 Gyr) the cluster AMR results in a remarkable lower envelope of the field AMR. The most likely explanation is a very rapid early chemical enrichment traced by the very visible globular clusters, but their coeval, low metallicity field counterparts are so rare that they are missed in our data. We find that such a large difference between the metallicities of LMC field stars and clusters is not easy to explain as coming from stripped ancient SMC clusters, although the field SMC AMR is on average 0.4 dex more metal-poor at all ages than that of the LMC. The two galaxies otherwise show a very similar chemical evolution.
References
- Bekki (2007) Bekki K., 2007, MNRAS, 380, 1669
- Bekki (2011) Bekki K., 2011, MNRAS, 416, 2359
- Bekki (2012) Bekki K., 2012, MNRAS, 422, 1957
- Bekki & Chiba (2005) Bekki K., Chiba M., 2005, MNRAS, 356, 680
- Bekki et al. (2004) Bekki K., Couch W.J., Beasley M.A., Forbes D.A., Chiba M., Da Costa G.S., 2004, ApJ, 610, L93
- Besla et al. (2012) Besta G., Kallivayalil N., Hernquist L., van der Marel R.P., Cox T.J., Keres̆ D., 2012, MNRAS, 421, 2109
- Bica et al. (2008) Bica E., Bonatto C., Dutra C.M., Santos Jr. J.F.C., 2008, MNRAS, 389, 678
- Bica et al. (1998) Bica E., Geisler D., Dottori H., Piatti A.E., Clariá J.J., Santos Jr. J.F.C. 1998, AJ, 116, 723
- Bonatto et al. (2006) Bonatto C., Kerber L.O., Bica E., Santiago B.X., 2006, A&A, 446, 121
- Brocato et al. (1996) Brocato E., Castellani V., Ferraro F.R., Piersimoni A.M., Testa V., 1996, MNRAS, 282, 614
- Carrera et al. (2008) Carrera R., Gallart C., Hardy E., Aparicio A., Zinn R., 2008, AJ, 135, 836
- Carrera et al. (2011) Carrera R., Gallart C., Aparicio A., Hardy E., 2011, AJ, 162, 61 (CGAH)
- Cole et al. (2005) Cole A.A., Tolstoy E., Gallagher J.S., III. Smecker-Hane T.A., 2005, AJ, 129, 1465
- Gallart et al. (2008) Gallart C., Stetson P.B., Meschin I.P., Pont F., Hardy E., 2008, ApJ, 682, L89
- Geha et al. (1998) Geha M.C. et al. 1998, AJ, 115, 1045
- Geisler & Sarajedini (1999) Geisler D., Sarajedini A., 1999, AJ, 117, 308
- Geisler et al. (1997) Geisler D., Bica E., Dottori H., Clariá J.J., Piatti A.E., Santos Jr., J.F.C., 1997, AJ, 114, 1920
- Geisler et al. (2003) Geisler D., Piatti A.E., Bica E., Clariá J.J., 2003, MNRAS, 341, 771
- Girardi et al. (2002) Girardi L., Bertelli G., Bressan A., Chiosi C., Groenewegen M.A.T., Marigo P., Salasnich B., Weiss A., 2002, A&A, 391, 195
- Grocholski et al. (2006) Grocholski A.J., Cole A.A., Sarajedini A., Geisler D., Smith V.V., 2006, AJ, 132, 1630
- Harris & Zaritsky (2009) Harris J., Zaritsky D., 2009, AJ, 138, 1243 (HZ09)
- Holtzman et al. (1999) Holtzman J.A., Gallagher J.S., III, Cole A.A., et al., 1999, AJ, 118, 2262
- Mackey & Gilmore (2004) Mackey A.D., Gilmore G.F., 2004, MNRAS, 352, 153
- Mucciarelli et al. (2009) Mucciarelli A., Origlia L., Ferraro F.R., Pancino, E., 2009, ApJ, 695, L134
- Mucciarelli et al. (2010) Mucciarelli A., Origlia L., Ferraro F.R., 2010, ApJ, 717, 277
- Olsen & Salyk (2002) Olsen K.A.G., Salyk. C., 2002, AJ, 124, 2045
- Olszewski et al. (1991) Olszewski E.W., Schommer R.A., Suntzeff N.B., Harris H.C., 1991, AJ, 101, 515
- Pagel & Tautvaišienė (1998) Pagel B.E.J., Tautvaišienė G., 1998, MNRAS, 299, 535 (PT98)
- Parisi et al. (2010) Parisi M.C., Geisler D., Grocholski A.J., Clariá J.J., Sarajedini A., 2010, AJ 139, 1168
- Piatti (2010) Piatti A.E., 2010, A&A Letters, 513, L13
- Piatti (2011a) Piatti A.E., 2011a, MNRAS, 416, L89
- Piatti (2011b) Piatti A.E., 2011b, MNRAS Letters, 418, L69
- Piatti (2011c) Piatti A.E., 2011c, MNRAS Letters, 418, L40
- Piatti (2012) Piatti A.E., 2012, MNRAS, 422, 1109
- Piatti et al. (2003b) Piatti A.E., Bica E., Geisler D., Clariá J.J., 2003b, MNRAS, 344, 965
- Piatti et al. (2011b) Piatti A.E., Clariá J.J., Bica E., Geisler D., Ahumada A.V., Girardi L. 2011b, MNRAS, 417, 1559
- Piatti et al. (2011a) Piatti A.E., Clariá J.J., Parisi M.C., Ahumada A.V., 2011a, PASP, 123, 519
- Piatti et al. (2003a) Piatti A.E., Geisler D., Bica E., Clariá J.J., 2003a, MNRAS, 343, 851
- Piatti et al. (2009) Piatti A.E., Geisler D., Sarajedini A., Gallart C. 2009, A&A, 501, 585
- Piatti et al. (2012) Piatti A.E., Geisler D., Mateluna R. 2012, AJ, in press
- Piatti et al. (2002) Piatti A.E., Sarajedini A., Geisler D., Bica E., Clariá J.J., 2002, MNRAS, 329, 556
- Piatti et al. (2007) Piatti A.E., Sarajedini A., Geisler D., Clark, D., Seguel J., 2007, MNRAS, 377, 300
- Rubele et al. (2011) Rubele S., Kerber L., Girardi L., et al., 2011, A&A, 537, 106
- Stetson et al. (1990) Stetson P.B., Davis L.E., Crabtree D.R., 1990, in ASP Conf. Ser. 8, CCDs in Astronomy (San Francisco: ASP), 289
- Subramanian & Subramanian (2010) Subramanian S., Subramanian A., 2010, A&A, 520, 24
- van der Bergh & Mackey (2004) van der Bergh S., Mackey A.D., 2004, MNRAS, 354, 713
- Wu et al. (2009) Wu Z.-Y., Zhou X., Ma J., Du C.-H., 2009, MNRAS, 399, 214


| Field | A | B | C | D | E | F | G | H | I | J | K | L | M | N | O | P |
|---|---|---|---|---|---|---|---|---|---|---|---|---|---|---|---|---|
| 1 | 9.0 | 9.0 | 11.7 | 9.0 | 9.0 | 11.1 | 11.1 | 11.7 | 9.0 | 11.1 | 11.1 | 11.7 | 8.6 | 11.1 | 11.1 | 11.7 |
| 2.8 | 2.8 | 3.5 | 2.8 | 2.8 | 3.3 | 3.3 | 3.5 | 2.8 | 3.3 | 3.3 | 3.5 | 2.7 | 3.3 | 3.3 | 3.5 | |
| 2 | 9.5 | 9.5 | 10.5 | 11.1 | 8.1 | 10.5 | 10.5 | 8.6 | 10.0 | 8.1 | 10.5 | 11.1 | 10.5 | 10.5 | 8.1 | 8.1 |
| 2.9 | 2.9 | 3.2 | 3.3 | 2.6 | 3.2 | 3.2 | 2.7 | 3.1 | 2.6 | 3.2 | 3.3 | 3.2 | 3.2 | 2.6 | 2.6 | |
| 3 | 8.6 | 11.1 | 8.6 | 11.7 | 9.0 | 11.1 | 11.1 | 9.0 | 11.7 | 11.1 | 8.6 | 11.7 | 8.6 | 9.0 | 11.7 | 9.0 |
| 2.7 | 3.3 | 2.7 | 3.5 | 2.8 | 3.3 | 3.3 | 2.8 | 3.5 | 3.3 | 2.7 | 3.5 | 2.7 | 2.8 | 3.5 | 2.8 | |
| 4 | 11.1 | 9.5 | 9.5 | 9.5 | 9.5 | 7.7 | 10.0 | 10.5 | 9.5 | 10.0 | 10.0 | 10.5 | 12.9 | 8.1 | 8.1 | 8.6 |
| 3.3 | 2.9 | 2.9 | 2.9 | 2.9 | 2.5 | 3.1 | 3.2 | 2.9 | 3.1 | 3.1 | 3.2 | 3.8 | 2.6 | 2.6 | 2.7 | |
| 5 | 9.5 | 11.7 | 11.7 | 11.7 | 11.7 | 11.7 | 9.0 | 11.7 | 11.7 | 11.7 | 9.0 | 6.5 | 11.7 | 12.3 | 7.3 | 9.5 |
| 2.9 | 3.5 | 3.5 | 3.5 | 3.5 | 3.5 | 2.8 | 3.5 | 3.5 | 3.5 | 2.8 | 2.1 | 3.5 | 3.6 | 2.3 | 2.9 | |
| 6 | 9.0 | 9.0 | 9.0 | 9.5 | 11.7 | 9.0 | 11.1 | 9.0 | 9.0 | 9.0 | 11.7 | 9.0 | 9.0 | 11.7 | 9.0 | 9.5 |
| 2.8 | 2.8 | 2.8 | 2.9 | 3.5 | 2.8 | 3.3 | 2.8 | 2.8 | 2.8 | 3.5 | 2.8 | 2.8 | 3.5 | 2.8 | 2.9 | |
| 7 | 11.1 | 10.0 | 4.7 | 10.5 | 10.5 | 10.5 | 8.1 | 8.1 | 10.5 | 10.5 | 13.5 | 10.5 | 12.9 | 8.1 | 8.1 | 11.1 |
| 3.3 | 3.1 | 1.5 | 3.2 | 3.2 | 3.2 | 2.6 | 2.6 | 3.2 | 3.2 | 3.9 | 3.2 | 3.8 | 2.6 | 2.6 | 3.3 | |
| 8 | 8.6 | 11.1 | 8.6 | 8.6 | 9.0 | 11.1 | 8.6 | 9.0 | 9.0 | 8.6 | 8.6 | 8.6 | 7.3 | 6.9 | 9.0 | 9.0 |
| 2.7 | 3.3 | 2.7 | 2.7 | 2.8 | 3.3 | 2.7 | 2.8 | 2.8 | 2.7 | 2.7 | 2.7 | 2.3 | 2.2 | 2.8 | 2.8 | |
| 9 | 6.5 | 6.5 | 4.9 | 5.2 | 8.6 | 4.9 | 3.7 | 4.9 | 6.5 | 8.6 | 6.5 | 4.9 | 9.0 | 6.9 | 5.2 | 6.5 |
| 2.1 | 2.1 | 1.6 | 1.7 | 2.7 | 1.6 | 1.2 | 1.6 | 2.1 | 2.7 | 2.1 | 1.6 | 2.8 | 2.2 | 1.7 | 2.1 | |
| 10 | 2.7 | 2.1 | 3.5 | 2.7 | 3.5 | 2.1 | 2.1 | 2.1 | 2.1 | 2.1 | 2.7 | 2.1 | 2.7 | 2.7 | 1.7 | 2.1 |
| 0.8 | 0.5 | 1.1 | 0.8 | 1.1 | 0.5 | 0.5 | 0.5 | 0.5 | 0.5 | 0.8 | 0.5 | 0.8 | 0.8 | 0.3 | 0.5 | |
| 11 | 2.7 | 4.7 | 3.5 | 4.7 | 3.5 | 2.8 | 4.9 | 4.9 | 4.7 | 6.5 | 3.7 | 4.9 | 3.7 | 4.9 | 3.7 | 5.2 |
| 0.8 | 1.5 | 1.1 | 1.5 | 1.1 | 0.8 | 1.6 | 1.6 | 1.5 | 2.1 | 1.2 | 1.6 | 1.2 | 1.6 | 1.2 | 1.7 | |
| 12 | 2.8 | 3.7 | 3.5 | 2.7 | 4.9 | 4.9 | 3.7 | 4.7 | 3.7 | 3.7 | 4.9 | 2.8 | 3.7 | 3.9 | 3.9 | 5.2 |
| 0.8 | 1.2 | 1.1 | 0.8 | 1.6 | 1.6 | 1.2 | 1.5 | 1.2 | 1.2 | 1.6 | 0.8 | 1.2 | 1.3 | 1.3 | 1.7 | |
| 13 | 3.0 | 2.8 | 2.8 | 2.8 | 3.0 | 3.9 | 3.7 | 3.7 | 3.9 | 5.2 | 3.7 | 3.7 | 2.3 | 3.9 | 3.0 | 3.7 |
| 0.9 | 0.8 | 0.8 | 0.8 | 0.9 | 1.3 | 1.2 | 1.2 | 1.3 | 1.7 | 1.2 | 1.2 | 0.6 | 1.3 | 0.9 | 1.2 | |
| 14 | 2.0 | 1.6 | 1.6 | 2.0 | 1.5 | 1.4 | 2.0 | 2.3 | 1.6 | 1.5 | 2.4 | 4.2 | 3.7 | 3.2 | 3.7 | 3.7 |
| 0.4 | 0.3 | 0.3 | 0.4 | 0.2 | 0.2 | 0.4 | 0.6 | 0.3 | 0.2 | 0.7 | 1.4 | 1.2 | 1.0 | 1.2 | 1.2 | |
| 15 | 3.9 | 4.9 | 3.7 | 3.7 | 4.9 | 3.9 | 3.9 | 3.9 | 3.7 | 3.9 | 3.9 | 3.2 | 3.7 | 3.2 | 3.0 | 2.4 |
| 1.3 | 1.6 | 1.2 | 1.2 | 1.6 | 1.3 | 1.3 | 1.3 | 1.2 | 1.3 | 1.3 | 1.0 | 1.2 | 1.0 | 0.9 | 0.7 | |
| 16 | 5.5 | 4.7 | 4.7 | 4.9 | 6.5 | 4.7 | 6.2 | 6.2 | 4.7 | 6.2 | 6.2 | 3.5 | 5.2 | 6.5 | 4.9 | 3.7 |
| 1.8 | 1.5 | 1.5 | 1.6 | 2.1 | 2.1 | 2.0 | 2.0 | 1.5 | 2.0 | 2.0 | 1.1 | 1.7 | 2.1 | 1.6 | 1.2 | |
| 17 | 6.9 | 6.9 | 11.7 | 11.7 | 12.3 | 9.5 | 9.5 | 6.5 | 10.0 | 11.7 | 11.7 | 9.0 | 10.0 | 9.5 | 9.5 | 9.0 |
| 2.2 | 2.2 | 3.5 | 3.5 | 3.6 | 2.9 | 2.9 | 2.1 | 3.1 | 3.5 | 3.5 | 2.8 | 3.1 | 2.9 | 2.9 | 2.8 | |
| 18 | 4.4 | 6.2 | 8.1 | 8.1 | 4.4 | 8.1 | 8.6 | 10.0 | 4.4 | 4.7 | 5.8 | 10.0 | 3.5 | 6.2 | 5.8 | 4.4 |
| 1.4 | 2.0 | 2.6 | 2.6 | 1.4 | 2.6 | 2.7 | 3.1 | 1.4 | 1.5 | 1.9 | 3.1 | 1.1 | 2.0 | 1.9 | 1.4 | |
| 19 | 9.5 | 11.7 | 6.9 | 11.7 | 9.0 | 11.7 | 9.0 | 9.0 | 9.0 | 9.0 | 9.0 | 9.0 | 9.0 | 6.9 | 12.3 | 9.5 |
| 2.9 | 3.5 | 2.2 | 3.5 | 2.8 | 3.5 | 2.8 | 2.8 | 2.8 | 2.8 | 2.8 | 2.8 | 2.8 | 2.2 | 3.6 | 2.9 | |
| 20 | 10.0 | 12.9 | 10.0 | 10.0 | 10.0 | 10.0 | 12.9 | 10.0 | 10.0 | 12.9 | 7.7 | 12.9 | 10.0 | 10.0 | 7.7 | 8.1 |
| 3.1 | 3.8 | 3.1 | 3.1 | 3.1 | 3.1 | 3.8 | 3.1 | 3.1 | 3.8 | 2.5 | 3.8 | 3.1 | 3.1 | 2.5 | 2.6 | |
| 21 | 8.6 | 12.3 | 9.5 | 9.5 | 12.3 | 12.3 | 12.3 | 12.3 | 9.5 | 12.3 | 9.5 | 12.3 | 9.5 | 9.5 | 12.3 | 10.0 |
| 2.7 | 3.6 | 2.9 | 2.9 | 3.6 | 3.6 | 3.6 | 3.6 | 2.9 | 3.6 | 2.9 | 3.6 | 2.9 | 2.9 | 3.6 | 3.1 |
| Field | A | B | C | D | E | F | G | H | I | J | K | L | M | N | O | P |
|---|---|---|---|---|---|---|---|---|---|---|---|---|---|---|---|---|
| 1 | -0.96 | -0.86 | -0.90 | -0.76 | -0.91 | -1.00 | -0.95 | -1.00 | -0.96 | -0.95 | -0.95 | -0.95 | -0.85 | -0.95 | -0.95 | -0.90 |
| 0.31 | 0.31 | 0.20 | 0.31 | 0.31 | 0.20 | 0.20 | 0.20 | 0.31 | 0.20 | 0.20 | 0.20 | 0.28 | 0.20 | 0.20 | 0.20 | |
| 2 | -0.88 | -0.88 | -0.90 | -0.90 | -0.74 | -0.90 | -0.90 | -0.85 | -0.80 | -0.84 | -0.90 | -0.85 | — | -0.90 | -0.84 | -0.89 |
| 0.35 | 0.35 | 0.20 | 0.20 | 0.26 | 0.20 | 0.20 | 0.28 | 0.20 | 0.26 | 0.20 | 0.20 | 0.20 | 0.20 | 0.26 | 0.26 | |
| 3 | -0.85 | -0.95 | -0.90 | -0.90 | -0.91 | -0.95 | -0.95 | -0.86 | -0.95 | -0.95 | -0.90 | -0.90 | -0.85 | -0.86 | -0.90 | -0.86 |
| 0.28 | 0.20 | 0.28 | 0.20 | 0.31 | 0.20 | 0.20 | 0.31 | 0.20 | 0.20 | 0.28 | 0.20 | 0.28 | 0.31 | 0.20 | 0.31 | |
| 4 | -0.90 | -0.88 | -0.88 | -0.93 | -0.83 | -0.93 | -1.00 | -1.00 | -0.88 | -1.00 | -0.95 | -0.95 | -0.90 | -0.94 | -0.89 | -0.90 |
| 0.20 | 0.35 | 0.35 | 0.35 | 0.35 | 0.25 | 0.20 | 0.20 | 0.35 | 0.20 | 0.20 | 0.20 | 0.20 | 0.26 | 0.26 | 0.28 | |
| 5 | -0.78 | -0.90 | -0.90 | -0.90 | -0.90 | -0.90 | -0.86 | -0.90 | -0.90 | -0.90 | -0.86 | -0.86 | -0.85 | -0.85 | -0.77 | -0.88 |
| 0.35 | 0.20 | 0.20 | 0.20 | 0.20 | 0.20 | 0.31 | 0.20 | 0.20 | 0.20 | 0.31 | 0.25 | 0.20 | 0.20 | 0.24 | 0.35 | |
| 6 | -0.86 | -0.91 | -0.86 | -0.93 | -0.85 | -0.96 | -0.95 | -0.91 | -0.91 | -0.96 | -1.00 | -0.91 | -0.86 | -1.00 | -0.91 | -1.08 |
| 0.31 | 0.31 | 0.31 | 0.35 | 0.20 | 0.31 | 0.20 | 0.31 | 0.31 | 0.31 | 0.20 | 0.31 | 0.31 | 0.20 | 0.31 | 0.35 | |
| 7 | -0.85 | -0.95 | -0.78 | -0.95 | -0.90 | -0.95 | -0.89 | -0.89 | -0.90 | -0.95 | -0.90 | -1.00 | -0.80 | -0.89 | -0.89 | -1.00 |
| 0.20 | 0.20 | 0.31 | 0.20 | 0.20 | 0.20 | 0.26 | 0.26 | 0.20 | 0.20 | 0.20 | 0.20 | 0.20 | 0.26 | 0.26 | 0.20 | |
| 8 | -0.90 | -1.00 | -0.95 | -1.00 | -0.96 | -1.10 | -1.05 | -1.06 | -1.01 | -1.10 | -1.05 | -1.05 | -1.02 | -1.06 | -1.11 | -1.26 |
| 0.28 | 0.20 | 0.28 | 0.28 | 0.31 | 0.20 | 0.28 | 0.31 | 0.31 | 0.28 | 0.28 | 0.28 | 0.24 | 0.24 | 0.31 | 0.31 | |
| 9 | -0.81 | -0.81 | -0.80 | -0.86 | -0.85 | -0.85 | -0.70 | -0.80 | -0.81 | -0.95 | -0.86 | -0.80 | -0.81 | -0.81 | -0.76 | -0.91 |
| 0.25 | 0.25 | 0.30 | 0.29 | 0.28 | 0.30 | 0.33 | 0.30 | 0.25 | 0.28 | 0.25 | 0.30 | 0.31 | 0.24 | 0.29 | 0.25 | |
| 10 | -0.61 | -0.66 | -0.88 | -0.71 | -0.83 | -0.61 | -0.61 | -0.66 | -0.66 | -0.61 | -0.71 | -0.61 | -0.56 | -0.66 | -0.48 | -0.56 |
| 0.33 | 0.31 | 0.34 | 0.33 | 0.34 | 0.34 | 0.31 | 0.31 | 0.31 | 0.31 | 0.33 | 0.31 | 0.33 | 0.33 | 0.28 | 0.31 | |
| 11 | -0.56 | -0.78 | -0.68 | -0.78 | -0.68 | -0.58 | -0.85 | -0.85 | -0.83 | -0.91 | -0.70 | -0.80 | -0.65 | -0.80 | -0.70 | -0.81 |
| 0.33 | 0.31 | 0.34 | 0.31 | 0.34 | 0.34 | 0.30 | 0.30 | 0.31 | 0.25 | 0.33 | 0.30 | 0.33 | 0.30 | 0.33 | 0.29 | |
| 12 | -0.53 | -0.70 | -0.68 | -0.51 | -0.80 | -0.85 | -0.75 | -0.78 | -0.70 | -0.70 | -0.80 | -0.53 | -0.60 | -0.72 | -0.72 | -0.86 |
| 0.34 | 0.33 | 0.34 | 0.33 | 0.30 | 0.30 | 0.33 | 0.31 | 0.33 | 0.33 | 0.30 | 0.34 | 0.33 | 0.33 | 0.33 | 0.29 | |
| 13 | -0.61 | -0.58 | -0.58 | -0.48 | -0.66 | -0.77 | -0.75 | -0.70 | -0.77 | -0.91 | -0.75 | -0.70 | -0.50 | -0.72 | -0.66 | -0.70 |
| 0.34 | 0.34 | 0.34 | 0.34 | 0.34 | 0.33 | 0.33 | 0.33 | 0.33 | 0.29 | 0.33 | 0.33 | 0.32 | 0.33 | 0.34 | 0.33 | |
| 14 | -0.52 | -0.40 | -0.45 | -0.52 | -0.36 | -0.40 | -0.42 | -0.45 | -0.35 | -0.31 | -0.52 | -0.69 | -0.65 | -0.58 | -0.65 | -0.65 |
| 0.30 | 0.27 | 0.27 | 0.30 | 0.26 | 0.25 | 0.30 | 0.32 | 0.27 | 0.26 | 0.33 | 0.32 | 0.33 | 0.34 | 0.33 | 0.33 | |
| 15 | -0.67 | -0.80 | -0.70 | -0.65 | -0.80 | -0.77 | -0.77 | -0.77 | -0.70 | -0.77 | -0.77 | -0.73 | -0.65 | -0.68 | -0.71 | -0.67 |
| 0.33 | 0.30 | 0.33 | 0.33 | 0.30 | 0.33 | 0.33 | 0.33 | 0.33 | 0.33 | 0.33 | 0.34 | 0.33 | 0.34 | 0.34 | 0.33 | |
| 16 | -0.67 | -0.73 | -0.68 | -0.75 | -0.81 | -0.73 | -0.80 | -0.80 | -0.73 | -0.75 | -0.80 | -0.63 | -0.66 | -0.76 | -0.75 | -0.60 |
| 0.28 | 0.31 | 0.31 | 0.30 | 0.25 | 0.31 | 0.26 | 0.26 | 0.31 | 0.26 | 0.26 | 0.34 | 0.29 | 0.25 | 0.30 | 0.33 | |
| 17 | -0.91 | -0.91 | -1.15 | -1.05 | -1.20 | -1.18 | -1.13 | -0.96 | -1.25 | -1.15 | -1.15 | -1.06 | -1.15 | -1.13 | -1.13 | -1.11 |
| 0.24 | 0.24 | 0.20 | 0.20 | 0.20 | 0.35 | 0.35 | 0.25 | 0.20 | 0.20 | 0.20 | 0.31 | 0.20 | 0.35 | 0.35 | 0.31 | |
| 18 | -0.71 | -0.70 | -0.74 | -0.74 | -0.61 | -0.74 | -0.75 | -0.80 | -0.71 | -0.63 | -0.69 | -0.80 | -0.63 | -0.70 | -0.69 | -0.61 |
| 0.31 | 0.26 | 0.26 | 0.26 | 0.31 | 0.26 | 0.28 | 0.20 | 0.31 | 0.31 | 0.27 | 0.20 | 0.34 | 0.26 | 0.27 | 0.31 | |
| 19 | -1.13 | -1.10 | -0.96 | -0.95 | -1.01 | -1.15 | -1.11 | -1.11 | -1.06 | -1.11 | -1.11 | -1.11 | -0.96 | -1.06 | -1.15 | -1.28 |
| 0.35 | 0.20 | 0.24 | 0.20 | 0.31 | 0.20 | 0.31 | 0.31 | 0.31 | 0.31 | 0.31 | 0.31 | 0.31 | 0.24 | 0.20 | 0.35 | |
| 20 | -1.15 | -1.30 | -1.30 | -1.10 | -1.25 | -1.30 | -1.25 | -1.20 | -1.20 | -1.20 | -1.13 | -1.15 | -1.10 | -1.20 | -1.13 | -1.24 |
| 0.20 | 0.20 | 0.20 | 0.20 | 0.20 | 0.20 | 0.20 | 0.20 | 0.20 | 0.20 | 0.25 | 0.20 | 0.20 | 0.20 | 0.25 | 0.26 | |
| 21 | -0.85 | -0.95 | -0.93 | -0.98 | -0.95 | -1.00 | -1.00 | -1.00 | -0.93 | -1.05 | -1.03 | -1.00 | -0.88 | -1.03 | -1.10 | -1.15 |
| 0.28 | 0.20 | 0.35 | 0.35 | 0.20 | 0.20 | 0.20 | 0.20 | 0.35 | 0.20 | 0.35 | 0.20 | 0.35 | 0.35 | 0.20 | 0.20 |