Different scenarios of topological phase transitions in homogeneous neutron matter
Abstract
We study different scenarios of topological phase transitions in the vicinity of the condensation point in neutron matter. The transitions occur between the Fermi-liquid state and a topologically different one with two sheets of the Fermi surface. Two possibilities of a rearrangement of quasiparticle degrees of freedom are shown: the first-order topological phase transition and the second-order one. The order of the phase transition is found to be strongly dependent on the value of the critical wave vector of the soft mode. The thermodynamics of the system is also studied. It is shown that the topology of the quasiparticle momentum distribution is mainly determined by the neutron matter density, while the temperature is essential in a narrow density region. A simple explanation of the first-order topological phase transition at is given.
pacs:
21.65.-f, 26.60.-c, 71.10.AyI Introduction
Dense neutron matter is an example of systems in which correlations of single-particle degrees of freedom are strongly enhanced in a certain region of external parameters. Such enhancement is attributed to an exchange of critical fluctuations of a very soft collective mode in a vicinity of its collapse Dugaev1976 . In dense neutron matter, critical spin-isospin fluctuations with quantum numbers of the neutral pion are enhanced close to the condensation point (PCP) MigdalRevModPhys1978 . Critical density for the neutral pion condensation fm-3 predicted in microscopic calculations Wiringa ; AkmalPandRav1998 is reached in a typical neutron star with the central density of fm-3.
Strong momentum dependence of the quasiparticle (QP) interaction due to exchange of critical spin-isospin fluctuations may result in a change in the topology of the ground state of a neutron QP system Voskr2000 . To our knowledge, the possibility of a change in the topology of the ground state was discussed for the first time in Ref. Frohlich-PR-1950 for electronic systems. In nuclear physics, QP momentum distributions with a topology different from that of the Fermi sphere were considered in Refs. Vary-PRC-1979 ; Zabolitsky-PRC-1979 for model interactions and in Ref. Aguilera-PRC-1980 for semirealistic ones.
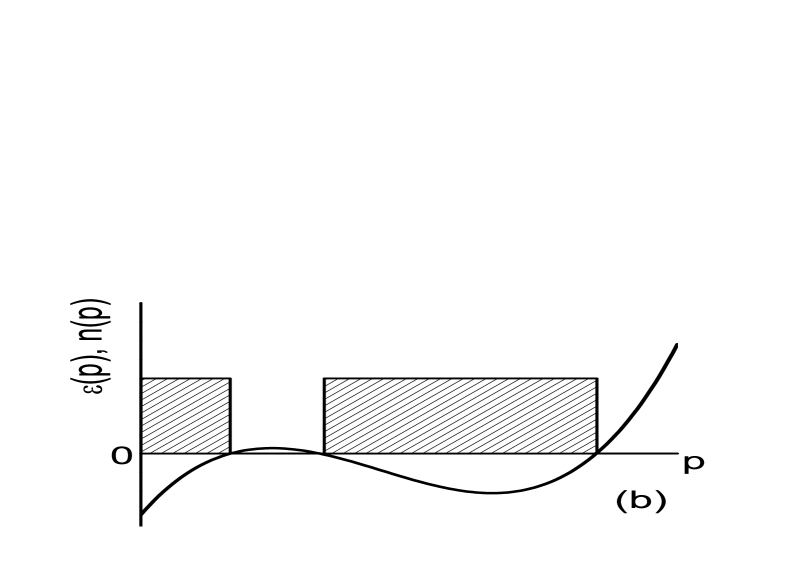
The non-Fermi-liquid topology of the ground state QP momentum distribution in the vicinity of PCP was first discussed in Ref. Voskr2000 . With the increase of the density towards the PCP value the QP spectrum (measured from the chemical potential ) becomes a nonmonotonic function and at certain density touches the momentum axis at some point (see panel (a) of Fig. 1). This situation is associated with a quantum critical point (QCP) KhodelTwoScen2007 at which the single-particle density of states diverges KhodelTopCros2011 . Beyond the QCP, the Landau state with the Fermi step QP distribution becomes unstable as it violates the necessary stability condition
| (1) |
Here is the volume element in the momentum space and the factor 2 stands for summation over spin projections. The constraint (1) requires a positive change in the total energy of the system for any admissible variation of the QP momentum distribution that conserves the density
| (2) |
Thus a new state appears with an unoccupied region (“bubble”) in the momentum distribution, which has several sheets of the Fermi surface (panel (b) of Fig. 1). This is the state that was considered in Refs. Vary-PRC-1979 ; Zabolitsky-PRC-1979 ; Aguilera-PRC-1980 . Further development concerning states with many bubbles can be found in Refs. ZverBaldo1998 ; ArtPogShag1998 . It is also worth noting investigations Aguilera-PRC-1982 concerning abnormal occupation in boson matter.

Reconstructions of the QP momentum distribution in strongly correlated Fermi systems changing the Fermi surface topology are generally referred Volovik-book-2007 to as topological phase transitions (TPTs). It should be noted that, besides the bubble scenario, there is another type of TPT which is called the fermion condensation KS-JETPL-1990 ; Volovik-JETPL-1991 ; Nozieres-1992 . In this scenario, the QP spectrum acquires a flat band , and the Fermi surface changes its dimension. The relation between the bubble scenario and the fermion condensation is discussed in Ref. KhodelQCP2008 .
Going back to the neutron matter problem, we note that a bubble formation beyond the QCP is quite important for cooling of neutron stars Voskr2000 ; VAKhod2004 . Indeed, a new sheet of the neutron Fermi surface with a low value of the corresponding Fermi momentum plays an important role for operation of the direct Urca processes: . In a neutron star’s core these processes are generally considered to be forbidden Yk-book-2007 due to the kinematic restriction on the Fermi momenta of the involved particles, . In the typical density range of the core ( fm-3 is the normal nuclear density), the proton fraction does not exceed , and the right-hand side of the kinematic equality is estimated by . The appearance of the new sheet of the Fermi surface at the point provides agreement with the kinematic restriction. This mechanism was considered in Refs. Voskr2000 ; VAKhod2004 as a possibility for the enhanced cooling of some neutron stars (e.g., Vela, Geminga, and 3C58).
II Quasiparticle approach near pion condensation point
II.1 General relations
The method we use for a description of neutron matter near the PCP is based on an implementation of the Landau-Migdal QP approach to strongly correlated Fermi systems that is reviewed in details in Ref. Khod2011MigAnn . Within this approach, the QP spectrum and the QP momentum distribution at finite temperature are evaluated by solving the set of equations,
| (3) | |||
| (4) | |||
| (5) |
The first equation of this set is the Landau relation where is the QP interaction function Landau ; Abrikos and stands for the free neutron mass; the second equation is the Fermi-Dirac formula in which is a functional of ; and the last one is the normalization condition.
The QP interaction function is identified Landau ; Abrikos with the limit of the vertex function ,
| (6) |
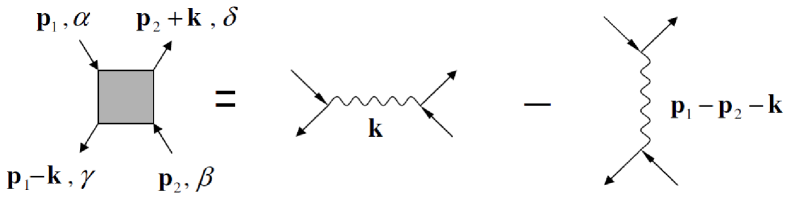
where is the residue of the single-particle Green function and stands for Pauli spin matrices. According to Ref. Dugaev1976 , the most singular contribution to the vertex function near the PCP comes from an exchange of a soft spin-isospin collective mode. The corresponding direct and the exchange graphs are shown in Fig. 2. At the limit , the contribution of the exchange graph still exhibits a strong dependence on the relative momentum . Therefore the QP interaction function reads Voskr2000
| (7) |
where is the interaction vertex of nucleons and pions in neutron media, is the propagator, and the general arguments of the operators are in parentheses.
II.2 Topological phase transitions
The occurrence of TPTs in dense neutron matter can be traced with the help of the strong momentum dependence of the QP interaction function near the PCP. As was discussed in Ref. MigdalRevModPhys1978 , the spectrum of -like collective excitations in neutron matter is given by a particular branch of poles of the propagator. The behavior of this branch depends on the density of the system. Pion condensation occurs at the critical density where the excitation energy vanishes, , together with its derivative, , at a certain momentum . As a consequence, the following conditions at the PCP are valid:
| (8) |
Thus using the Taylor expansion of , the interaction function entering in Eq. (3) can be written Voskr2000 ; VAKhod2004 ; Baldo2004 in the form
| (9) |
where is an effective coupling constant and is an effective radius in momentum space. The notation stands for the trace over the spin variable.
Previous investigations Baldo2004 within the QP interaction (9) were focused on the ground-state topology, and quantities were regarded as phenomenological parameters. For convenience of readers, we present in Fig. 3 a topological phase diagram in variables obtained in that work. The label FL corresponds to the Fermi-liquid state and LBi, to states with sheets of the Fermi surface.
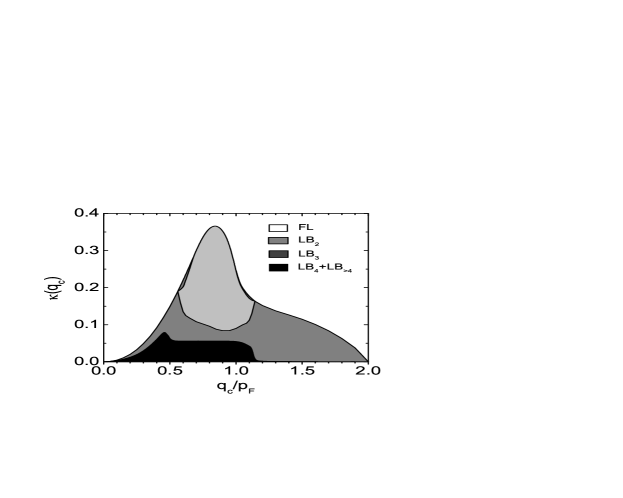
A change in the density leads to a change in the system position on the diagram. Transitions between different regions of the phase diagram represent TPTs that can occur in neutron matter. Until recently, all such TPTs were considered KhodelQCP2008 ; Khod2011MigAnn to occur continuously according to violation of Eq. (1). However, an attentive investigation PanZver2012 within the model (9) revealed another possibility, namely, a first-order TPT. Such a scenario of the Fermi surface reconstruction in a homogeneous isotropic Fermi system was first found PanZverBaldo2011 in a model of strongly correlated 2D electron gas beyond the QCP. Below, we present a detailed analysis of possible TPTs for the neutron matter problem.
III Semi-microscopic QP interaction function
The above discussion of TPTs was restricted by the phenomenological description (9) of the QP interaction function. It is possible to convey neutron matter physics near the PCP in a more direct way. A semi-microscopical expression for the QP interaction can be derived by use of the microscopic formula (7).

The bare -nucleon interaction vertex is given PionBook by
| (10) |
where is the dimensionless -nucleon coupling constant, is the pion mass, and is the diagonal isospin matrix. The vertex renormalization in neutron matter is due to nucleon-nucleon correlations that can be described by means of the Landau-Migdal amplitude MigdalTKFS
| (11) |
Here is the Fermi momentum in equilibrium nuclear matter and is the effective nucleon mass. According to Ref. MigdalRevModPhys1978 , the renormalized static vertex reads
| (12) |
The function is the static susceptibility of free QPs proportional to the Lindhard function:
| (13) |
where is the neutron Fermi momentum.
The pion propagator in Eq. (7) is connected with the polarization operator: . The microscopic description of the pion polarization operator is a quite subtle matter PionBook . We use here its semi-microscopic representation MigdalMarkMish1974
| (14) |
The first term describes processes of particle-hole excitations where nucleon-nucleon correlations are taken into account by the denominator. The second term is a phenomenological one and describes -resonance-hole excitations. The -scattering processes in neutron matter are neglected.
Finally, one arrives at the formula
| (15) |
for the interaction function, where the polarization operator is given by (14). In Eq. (15), the constants , , are fixed all along the further discussion, while two sets of parameters for the phenomenological part of the polarization operator are used. The first set,
| (16) |
corresponds to Ref. MigdalMarkMish1974 , while the second one,
| (17) |
is suggested in this work. Both sets reproduce the value fm-3 that agrees with the critical density of condensation obtained in Wiringa ; AkmalPandRav1998 . The difference between the two parametrizations is in the corresponding value of the critical wave vector , which is not known accurately from microscopic calculations. We also note that and are quite sensitive to tuning of parameters and . The behavior of the QP interaction function is shown in Fig. 4. The parametrization (16) leads to (that is less then ), while (17) leads to . Figure 4 also demonstrates the amplification of the QP interaction with an increase of (equally, the density ). The divergence is reached at the PCP point, and correspondingly for the first and the second parametrizations.
IV Different scenarios of topological phase transitions
In this Section, we discuss results of the analysis of topological rearrangements of QP degrees of freedom based on the semi-microscopic QP interaction function. The QP spectrum and the QP momentum distribution are determined by the set of Eqs. (3),(4),(5). Due to the assumed dependence of the interaction function (15) on the relative momentum , Eq. (3) can be integrated by parts, yielding
| (18) |
For solving the equations a contracting iterations method was used. The case of was modeled by , where .
First, we consider the results obtained within the model (16) where . The evolution of QP degrees of freedom, driven by an increase of , is displayed in Fig. 5.


It has a continuous behavior in agreement with the scenario of TPTs with violation of the necessary stability condition (1). As the Fermi momentum reaches the critical value , a bifurcation occurs, and a new zero of the QP spectrum appears at the momentum . Beyond the , the QP momentum distribution possesses two sheets of the Fermi surface with coordinates and . The size of the bubble region (which is equal to ) increases continuously from the zero value with further increase of .


Dealing with Eq. (18) for the QP spectrum, one can consider the corresponding energy functional
| (19) |
The behavior of the energy is given in panel (a) of Fig. 6. It shows a monotonic increase according to the continuous picture of the evolution of the ground state in Fig. 5. A second-order topological transition occurs between the FL and the LB2 states exactly at the critical point .
Passing to the model (17) where , we first consider panel (b) of Fig. 6. As it is seen, there are two different states in the interval . The coexistence of several solutions of Eqs. (4),(5),(18) was established by considering different initial conditions for the iteration procedure. Fig. 7 represents QP spectra and QP momentum distributions of coexisting states. At the value the ground state is the FL one (panel (a)), while there is also a LB2 state (panel (b)) with a slightly higher energy value. It is worth emphasizing that the bubble region has finite, not negligible size . A first-order phase transition occurs at . Beyond the transition point, the LB2 state (panel (d)) becomes energetically favored over the FL state (panel (c)). Finally, the local energy minimum of the functional (19), corresponding to the FL state, becomes unstable footnote (for ) and only the LB2 ground state remains (see panel (b) of Fig. 6).
We proceed with a thermodynamic analysis concerning the case of the first-order TPT. Thermodynamic functions of neutron matter with the Fermi momentum are given by Fig. 8.
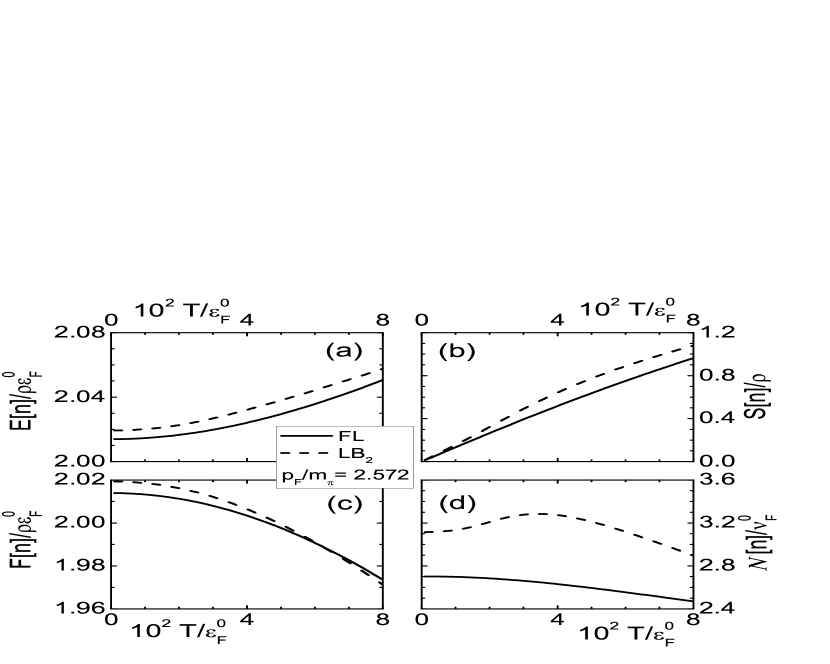
Panel (a) demonstrates that the FL state is lower in the energy than the LB2 one up to the temperature MeV. At the same time, panel (b) shows that the entropy
| (20) |
of the LB2 state grows more rapidly with increasing temperature than the entropy of the FL state. An interplay of contributions to the free energy leads to a first-order TPT driven by the temperature. Behavior of the free energy given by panel (c) demonstrates the first-order phase transition at the temperature . Finally, panel (d) shows the temperature evolution of the density of states
| (21) |
To elucidate the temperature behavior of the thermodynamic functions under consideration, we present in Fig. 9 QP spectra and QP momentum distributions of the FL state and of the LB2 one at the point near the phase transition. This figure shows that the entropy and the density of states of the LB2 state are larger than those of the FL state due to the fact that in the first case, two sheets of the Fermi surface “melt”, while in the second case only one does.


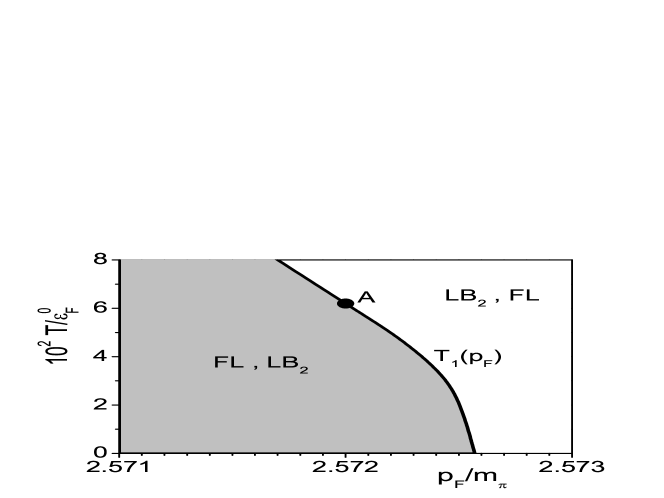
The results of the analysis on the temperature behavior of QP states, in the region near the point (see panel (b) of Fig. 6), are summarized by the -phase diagram of neutron matter shown in Fig. 10. The diagram consists of two regions: the first one corresponds to the FL phase of the system, while the other one to the LB2 phase. The regions are separated by the line of the first-order TPTs. The diagram shows that neutron matter state topology is determined by the temperature in a quite narrow density interval.
V Energetics of LB2 states
In this Section, we elucidate why the system appears to be in the LB2 phase. The energy functional (19) can be rewritten in the form
| (22) |
Here the interaction energy is given by means of the structure function
| (23) |
In the case , which we address below, the set of all possible QP momentum distributions with one or two sheets of the Fermi surface (that is the FL or LB2 states) is specified by
| (24) | |||
| (25) |
The last equation follows from the normalization condition (5). This class is referred below as QP distributions of type. In this case, the structure function is evaluated explicitly, the corresponding formulas are given in the Appendix. It is sufficient, due to Eq. (25), to deal with one parameter. The convenient choice is (the width of the occupied region in the QP momentum distribution) that defines distribution parameters
| (26) |
The value corresponds to i.e. to the case of the Fermi step. The decrease of leads to a monotonic increase of .
The behavior of the structure function is shown in panel (a) of Fig. 11.


Its explicit form, corresponding to the Landau state (), is well known
| (27) |
It is remarkable that in the other important case of thin () -type QP distributions that can appear by a first-order TPT, one obtains
| (28) |
This result is demonstrated well by Fig. 11, and reflects a decrease of the overlap of the momentum distributions in the integral in Eq. (23). As a consequence, this leads to a reduction of the interaction energy,
| (29) |
The kinetic energy, on the contrary, shows enhancement in agreement with the explicit result
| (30) |
The total energy in the case of distributions of the type in the limit is given by
| (31) |
This function is plotted on panel (b) of Fig. 11 and shows a minimum value
| (32) |
at the point Finally, we note that the energy appears to be lower than the Fermi-liquid one,
| (33) |
when the QP interaction is sufficiently strong. Indeed, if one characterizes the QP interaction function by an effective coupling constant , Eqs. (32) and (33) show that and at the large- limit.
Thus, the appearance of LB2 states is explained by the interplay between the kinetic and the interaction energy contributions. The existence of this energy minimum, generally, does not dependent on whether the Landau state is present or not. We remark that this simple explanation is limited to regarding the set of QP momentum distributions. A generalization to a more complete class could in principle reveal an instability of a LB2 state with respect to some energetically favored one PanZver2012 . The solid proof of the existence of the LB2 ground state comes from the direct solution of Eqs. (4),(5), and (18).
VI Conclusion
In this article we have considered two scenarios of topological phase transitions in homogeneous neutron matter. The transitions occur between the Fermi-liquid state and the other one with two sheets of the Fermi surface. The investigation was performed with the use of a semi-microscopic expression for the quasiparticle interaction function in the vicinity of condensation point. The order of the phase transition is shown to depend on the value of the critical wave vector . The first possibility for a rearrangement of the quasiparticle degrees of freedom is the second-order topological phase transition. It occurs when and corresponds to a quantum-critical-point scenario KhodelTwoScen2007 ; KhodelTopCros2011 ; KhodelQCP2008 of the Fermi surface reconstruction. The second possibility studied in this work is the first-order topological phase transition. This case occurs when and is connected with a sudden change in the quasiparticle momentum distribution and spectrum. The first-order topological phase transition can be driven by change of either the density or the temperature. Thermodynamic functions and the phase diagram have been calculated. It is shown that the influence of the temperature on the Fermi surface topology is essential in a quite narrow density region. A simple explanation of the origin of the first-order topological phase transition at is given.
VII Acknowledgments
We thank V. A. Khodel and E. E. Saperstein for their interest to this work and useful discussions. One of the authors (S.S.P.) would like to thank INFN (Sezione di Catania) for hospitality during his stay in Catania. This research was partially supported by Grants No. NSh-7235.2010.2 and No. 2.1.1/4540 of the Russian Ministry for Science and Education, and by the RFBR Grants No. 11-02-00467-a and No. 12-02-00955-a.
VIII Appendix
The structure function within the set of QP momentum distributions reads
| (34) |
Here is a volume the intersection of two spheres with radii and , , while the distance between their centers is equal to the vector length. The value of the volume is specified by the expression
| (35) |
The first term corresponds to an intersection case, while the second one corresponds to a complete enclosure of the smaller sphere into the bigger one. The function has the form
| (36) |
References
- (1) A. M. Dyugaev, Sov. Phys. JETP, 43, 1247 (1976).
- (2) A. B. Migdal, Rev. Mod. Phys. 50, 107 (1978).
- (3) R. B. Wiringa, V. Fiks and A. Fabrocini, Phys. Rev. C 38, 1010 (1988).
- (4) A. Akmal, V. R. Pandharipande and D. G. Ravenhall, Phys. Rev. C 58, 1804 (1998) [arXiv:nucl-th/9804027]; A. Akmal, V. R. Pandharipande, ibid. 56, 2261 (1997) [arXiv:nucl-th/9705013].
- (5) D. N. Voskresensky, V. A. Khodel, M. V. Zverev and J. W. Clark, The Astrophysical Journal 533, 127 (2000) [arXiv:astro-ph/0003172].
- (6) H. Fröhlich, Phys. Rev. 79, 845 (1950).
- (7) M. de Llano, J. P. Vary, Phys. Rev. C 19, 1083 (1979).
- (8) M. de Llano, A. Plastino, J. G. Zabolitzky, Phys. Rev. C 20, 2418 (1979).
- (9) V. C. Aguilera-Navarro, R. Belehrad, M. de Llano, M. Sandel, J. P. Vary, O. Rojo, Phys. Rev. C 22, 1260 (1980).
- (10) V. A. Khodel, JETP Lett. 86, 721 (2008) [arXiv:0709.3653].
- (11) V. A. Khodel, J. W. Clark, M. V. Zverev, JETP Lett. 94, 73 (2011) [ arXiv:1105.2552].
- (12) M. V. Zverev and M. Baldo, JETP 87, 1129 (1998) [arXiv:cond-mat/9807324].
- (13) S. A. Artamonov, Yu. G. Pogorelov, V. R. Shaginyan, JETP Lett. 68, 942 (1998) [arXiv:cond-mat/9811024].
- (14) V. C. Aguilera-Navarro, R. Barrera, M. de Llano, J. W. Clark, A. Plastino, Phys. Rev. C 25, 560 (1982).
- (15) G. E. Volovik, Quantum Phase Transitions from Topology in Momentum Space, Springer Lecture Notes in Physics Vol. 718 (Springer, Berlin, 2007), p. 31.
- (16) V. A. Khodel and V. R. Shaginyan, JETP Lett. 51, 553 (1990).
- (17) G. E. Volovik, JETP Lett. 53, 222 (1991).
- (18) P. Nozières, J. Phys. I (France) 2, 443 (1992).
- (19) V. A. Khodel, J. W. Clark, M. V. Zverev, Phys. Rev. B 78, 075120 (2008) [arXiv:0806.1908].
- (20) V. A. Khodel, J. W. Clark, M. Takano and M. V. Zverev, Phys. Rev. Lett. 93, 151101 (2004).
- (21) P. Haensel, A. Y. Potekhin, D. G. Yakovlev, Neutron Stars 1, Equation of State and Structure, Springer Astrophysics and Space Science Library Vol. 326 (Springer, Berlin, 2007).
- (22) V. A. Khodel, J. W. Clark, M. V. Zverev, Phys. Atom. Nucl. 74, 1237 (2011) [arXiv:1108.4023].
- (23) E. M. Lifshitz, L. P. Pitaevsky, L. D. Landau and E. M. Lifshitz Course of Theoretical Physics Vol. 9, Statistical Physics Part 2 (Pergamon Press, Oxford, 1980).
- (24) A. A. Abrikosov, L. P. Gor’kov, I. E. Dzyaloshinski, Methods of Quantum Field Theory in Statistical Physics (Prentice-Hall, London, 1963).
- (25) M. Baldo, V. V. Borisov, J. W. Clark, V. A. Khodel and M. V. Zverev, J. Phys.: Condens. Matter 16, 6431 (2004) [arXiv:cond-mat/0402481].
- (26) S. S. Pankartov, M. V. Zverev, JETP Lett., to be published.
- (27) S. S. Pankartov, M. V. Zverev, M. Baldo, JETP Lett. 93, 591 (2011) [arXiv:1106.5160].
- (28) T. Ericson, W. Weise, Pions and Nuclei (Claredon Press, London, 1988).
- (29) A. B. Migdal, Theory of Finite Fermi Systems and Applications to Atomic Nuclei (Wiley, New York, 1967).
- (30) A. B. Migdal, O. A. Markin, and I. I. Mishustin, Sov. Phys. JETP, 39, 212 (1974).
- (31) Detailed analysis of the energy functional (19) with a QP interaction amplitude of the form (9) can be found in Ref. PanZver2012 for nuclear matter and in Ref. PanZverBaldo2011 for 2D electron gas problems.