The Nature of the Si ii 6150Å, Ca ii HK, Ca ii IR-triplet, and other Spectral Features in Supernova Type Ia Spectra
Abstract
Spectra of Type Ia Supernovae (SN Ia) show both continuum-like and absorption-like line features. The pseudo equivalent width (pEW) and Doppler shift of absorption-line-like features, such as Si ii 6150Å, Ca ii HK 3750Å, and the Ca ii IR-triplet 8150Å quantities that are often associated with the optical depth and the velocity of a shell of interacting material, are important tools for interpreting and classifying the SN Ia spectra. In this paper, we examine the nature of spectral features in SN Ia spectra using W7 model spectra and a technique that we call “knock-out” spectra. We show that the P-Cyg profiles of Si ii 6150Å and many other features are largely emission dominated, rather than absorption dominated, and that the concepts of “absorption line” and “continuum” are therefore not adequate to describe the nature of spectral features in SNe Ia. Apparent absorption features, like Si ii 6150Å, are frequently just coincidental troughs between two (or more) uncorrelated emission features. In this situation, the pEW measured between these emission peaks is little related to the true strength of the presumed absorption feature. Furthermore, using the same knock-out technique, we demonstrate how spectral features overlap each other at different times after the explosion. This overlap distorts individual line profiles and affects measured absorption-line velocities. With synthetic SN Ia ejecta stratifications that are tuned to match specific observations, the method presented in this paper can in principle be used to quantify the effects of specific line opacities on measured line velocity, line strength, and line blending, and improve the interpretation and informative value of observed SN Ia spectra.
Subject headings:
stars: Supernovae: general - radiative transfer - methods: numerical1. Introduction
Supernovae of Type Ia (SN Ia) generally show very similar spectral and photometric behavior (e.g. Filippenko 1997). Because of this interesting homogeneity (and the fact that these objects become extremely bright) SNe Ia have proven to be very important objects to study the universe at large distances (Riess et al., 1998; Perlmutter et al., 1999). Yet despite the general similarity, there are an even more interesting photometric and spectroscopic diversities among SNe Ia. Whereas photometrical diversity has long been studied (Phillips, 1993; Wang et al., 2003), good spectroscopic data have only recently become available in large numbers (CfA SN Program Blondin et al. 2012; Berkeley SN Ia Program Silverman et al. 2012).
One step towards understanding spectroscopic diversity is finding similarities and defining classes. A number of spectral classification schemes for SN Ia have been proposed in literature. These are based on measurements performed on conspicuous Si ii and Ca ii absorption features present in all “normal” (Branch et al., 1993) SN Ia. These absorption feature measurements include: 1) The feature strength, expressed as pseudo equivalent width (pEW, see Folatelli 2004) (Branch et al., 2006); 2) The line blue-shift, expressed as expansion velocity (Wang et al., 2009); and 3) The rate of change in blue-shift, expressed as velocity gradient (Benetti et al., 2005).
It is well known that atomic transition lines formed in a rapidly expanding atmosphere like SN Ia have P-Cyg profiles (Lamers & Cassinelli, 1999). P-Cyg profiles generally show a superposition of an emission wing that is more or less symmetric around the transition’s rest wavelength plus an absorption wing that is blue shifted. But the precise shape of P-Cyg profiles in relativistically expanding atmospheres, and specifically the ratio of emission to absorption, strongly depends on details of the atmosphere (Hutsemekers, 1993), including: 1) The radial extension of the line forming region; 2) The velocity gradient across the line forming region; and 3) The wavelength dependence of the “continuum” and its change across the line forming region.
Another fact that complicates the interpretation of SN Ia spectra is the large number of transition lines that leave their signature in the spectra in an indistinguishable way (i.e., smeared out by the large expansion velocities of SN Ia ejecta). As shown by Kasen (2006) and Kromer & Sim (2009) tens of millions of transitions must be included to calculate the SN Ia opacity accurately. Even though some of these lines are stronger than others, the background opacity formed by the millions of weaker lines is not gray (Kasen, 2006), which leaves its signature on the profiles of those stronger lines.
Clearly, the line profiles in SN Ia spectra contain a large amount of information about the detailed atmospheric conditions (like the distribution of nuclear products), and understanding them better will increase the power of spectroscopic observations to improve our understanding of SN Iaİn this paper we will demonstrate that the P-Cyg profiles of Si ii 6150Å and many other lines can be emission- instead of absorption-dominated well before peak brightness. We also show the implications this has for interpreting the pEW and the Doppler shift of absorption-like line features.
2. Methods
As described in the previous section, a realistic reproduction of P-Cyg profiles requires a model that describes the run of physical conditions over the geometrical extent of the line forming region. In this paper we do not aspire to attain perfect reproductions of observed P-Cyg profiles but rather focus on understanding the general nature of spectral features as they are observed for SNe Ia. For this purpose we calculate “knock-out” spectra from models in which a relatively small subset of atomic transition lines are removed from the opacity, but all other quantities (e.g. temperature, material density, electron density, atomic level population numbers) are kept fixed. We then compare the knock-out spectra with the original spectra, which were calculated using the full, unaltered opacity. The direct comparison between altered and unaltered opacity spectra shows what the signature of the removed subset of atomic transition line(s) on the full spectrum was.
The “knock-out technique is different from other, similar procedures that have been done or could be done. For example, Bongard et al. (2008) calculated “single-ion” spectra with the purpose of identifying the ions that shape the two so-called Si ii features in the 5000–7000Å wavelength region. Their method is similar in that they also redo a simulation with modified opacities and other quantities fixed. The main difference is that, instead of perturbing the full opacities as little as possible, the single-ion opacities are qualitatively different (much lower) and therefore the single-ion spectra are not similar to the normal spectrum.
Kromer & Sim (2009) present an approach for monte carlo (MC) transport in which MC packets record the ion involved in the last line-emission interaction before the leaving the computational domain. This procedure has the advantage that the additional information gained is obtained directly from a fully self-consistent simulation. A limitation of this approach compared to the knock-out approach is that it provides no information about line absorption.
Another approach would be to alter the abundance of individual chemical elements, recalculate self-consistent light curves and spectra, and examine how spectral features change due to the change in abundance. The temperature, electron density and population numbers will all change as a result of the changes in the opacity and the radiation field. The changes in the properties of spectral lines can no longer be attributed to line opacities only but are the result of the complex interplay of line- and continuum-opacities, temperatures, electron densities, and ionization/excitation balance (through the electron density and temperature). This approach really addresses the question of how the spectral lines would change if the composition of the ejecta changed, which is an important but very different question than the one we address here.
Each of these approaches has an important and valid use, but we believe that the knock-out approach provides the best insight into the question that we address in this paper: what is the signature of a particular atomic transition (or a set of transitions) on the full SN Ia spectrum.
The subtle differences between knock-out spectra relative to the normal flux level require that model spectra be calculated with high precision and low noise levels. In this paper, we use PHOENIX, a state-of-the-art, general purpose stellar atmosphere code (Hauschildt, 1992; Hauschildt & Baron, 1999, 2004, 2006; van Rossum, 2012). This code solves the special relativistic radiation transport problem with high accuracy using characteristic rays and operator splitting methods (Olson & Kunasz, 1987). The time evolution of synthetic SN Ia spectra is calculated self-consistently with PHOENIX using the radiation energy balance (REB) method (van Rossum, 2012). PHOENIX with the REB method can in principle calculate synthetic SN Ia spectra in NLTE; however, NLTE is particularly challenging in the SN Ia problem, given the huge number of lines that play a role, and thus doing this is still a work in progress. Therefore we use the LTE approximation in this paper.
Determining the density profile and the distribution of chemical elements in SN Ia ejecta from explosion models has been a highly active field of research for decades. Since the first phenomenological 1-dimensional (1D) explosion model that successfully reproduced the basic observational characteristics of SN Ia W7 (Nomoto et al., 1984), explosion models and simulations have incorporated more physics and use better numerical techniques (e.g. Khokhlov (1991); Jordan et al. (2008); Kasen et al. (2009); Seitenzahl et al. (2013); Kromer et al. (2013); Long et al. (2014)). Yet the properties of the ejecta produced by these simulations often agree no better with those inferred from observations. As a result, W7 therefore continues to be an important 1D reference model (e.g. Kasen et al. (2006); Kromer & Sim (2009); van Rossum (2012); Wollaeger & van Rossum (2014)) that is useful for studying the nature of spectral features. The properties of the ejecta in the W7 model were not tuned to match a specific SN Ia. For this reason, we compare our results to the Hsiao et al. (2007) (hereafter Hsiao07) spectral templates rather than to the spectra of individual SN Ia.
3. Results
Figure 1 shows the W7 model spectra compared to the Hsiao07 templates at four different times post explosion (pe). The peak template luminosity is aligned with the peak model luminosity at day 18pe. A single scaling factor is applied to the unit-less template flux (simultaneously for all times) to globally match the model flux. Apart from these two tightly constrained parameters, there is no freedom in the comparison.
In Figure 1 three important SN Ia features are examined with knock-out spectra: Si ii 6150Å, Ca ii HK 3750Å, and the Ca ii IR-triplet 8150Å. The lab wavelengths of the corresponding lines are Si ii 6347 and 6371Å (commonly together referred to as 6355Å), Ca ii 3934 and 3969Å, and Ca ii 8498, 8542, and 8662Å. The colored areas below the regular spectrum represent features that are in emission in the normal (full) spectrum, while those above the regular spectrum represent features that are in absorption in the normal (full) spectrum.

Figure 2 shows how results from multiple knock-out spectra can be combined into a single plot. We show the colored areas representing the knock-out spectra of lines or groups of lines on top of each other for two reasons. First, this reduces the number of plots necessary to visualize the data. Second, the stacked colored areas show how the shapes of different spectral features are formed by different line opacities or sets of line opacities. It is important to note that there is no physical interpretation of the imaginary flux level at the top or the bottom of the stacked colored areas because spectra are not linear combinations of line profiles.
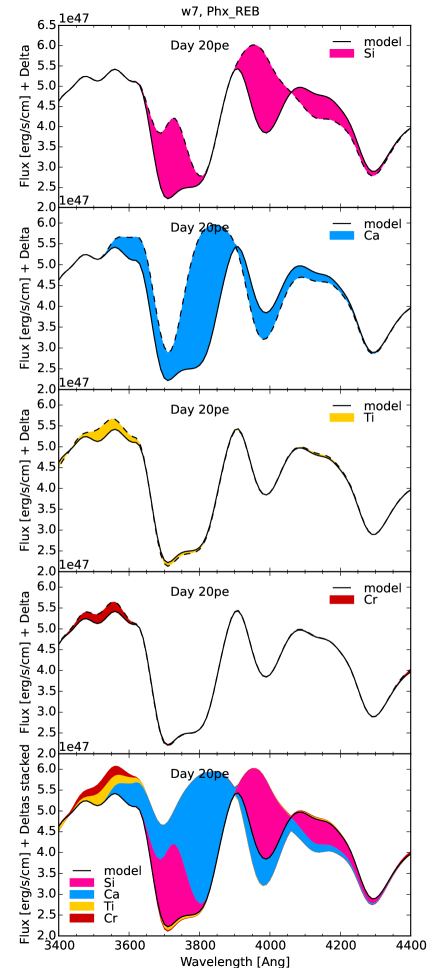

Figure 4 shows the same W7 model spectra at day 10, 20, 30, and 40 post explosion as in Figure 1, but instead of showing three specific features, knock-out spectra are plotted for all of the atomic line opacities that contribute significantly to the shape of the spectrum, with different colors corresponding to different chemical elements. In order to stress that the stacked colored areas in Figure 4 have no physical meaning, Figure 4 shows the same knock-out spectra plotted relative to the peak spectral flux level and without stacking. For reference, the figure also shows the Bessell (1990) UBVRI filter functions, arbitrarily normalized.
![[Uncaptioned image]](/html/1208.3781/assets/x4.png) Figure 3.— W7 model spectra (solid line) with knock-out spectra shown for different chemical species at 10, 20, 30, and 40 days post explosion (pe).
Apparently, the spectra are largely emission dominated longwards of 5500Å and the pseudo-continuum level is significantly lower than the emission peaks on both sides of the absorption features.
Ideally, pEW evaluations should take this into account.
The important Si ii 6355Å feature is poorly reproduced by the W7 model (and by other models, see text), especially from day 30pe on.
Figure 3.— W7 model spectra (solid line) with knock-out spectra shown for different chemical species at 10, 20, 30, and 40 days post explosion (pe).
Apparently, the spectra are largely emission dominated longwards of 5500Å and the pseudo-continuum level is significantly lower than the emission peaks on both sides of the absorption features.
Ideally, pEW evaluations should take this into account.
The important Si ii 6355Å feature is poorly reproduced by the W7 model (and by other models, see text), especially from day 30pe on.
![[Uncaptioned image]](/html/1208.3781/assets/x5.png) Figure 4.— The same knock-out spectra for different chemical elements as shown in Figure 4, but plotted relative to the peak spectral flux level (see also Figure 2) without stacking.
The dashed curves show the UBVRI Bessell 1990 band filter functions.
The important Si ii 6150Å and Ca ii HK features, and many others, show emission wings that are often stronger than the respective absorption wings.
The Ca ii HK feature (like many others) is not an isolated feature, but is instead blended with contributions from Si, Co, Ti, and S.
This compromises measurements of both the feature strength and velocity.
In all four epochs shown here, the U-band and the B-band contain contributions from many different elements, more so than others.
Figure 4.— The same knock-out spectra for different chemical elements as shown in Figure 4, but plotted relative to the peak spectral flux level (see also Figure 2) without stacking.
The dashed curves show the UBVRI Bessell 1990 band filter functions.
The important Si ii 6150Å and Ca ii HK features, and many others, show emission wings that are often stronger than the respective absorption wings.
The Ca ii HK feature (like many others) is not an isolated feature, but is instead blended with contributions from Si, Co, Ti, and S.
This compromises measurements of both the feature strength and velocity.
In all four epochs shown here, the U-band and the B-band contain contributions from many different elements, more so than others.
Figure 5 zooms in on the Si ii 6150Å feature at 6, 8, 12, and 16 days post explosion. In contrast to Figure 1, which shows the knock-out spectrum for the Si ii 6355Å line opacity only, here the combined effect of all of the Si line opacities is shown in pink, similar to Figure 4. The Si ii 6150Å feature is one of the most distinct features in SN Ia spectra, and is often used to make line velocity and pEW measurements. It can be seen that the shape of this feature is determined not only by the Si ii 6150Å line opacity itself, but also by C, O, Mg, S, Fe, and Co line opacities and by other Si line opacities like Si ii 5972Å. These blends of other lines affect both the velocity at which the profile minimum occurs and the pEW of the line. In addition, over time the profile of the Si ii 6150Å line itself develops an emission wing that is stronger than its absorption component. Thus the true strength of the Si ii 6150Å absorption feature is smaller than the pEW of the whole trough, which is partially formed by multiple, correlated, small, emission-line wings on either side.

The effects of line blending on the absorption velocity of the Si ii 6150Å trough are demonstrated in Figure 6. The feature velocity as measured in the regular spectrum is lower than the actual line velocity of the isolated Si ii 6355Å line feature. ¿From Figure 4 and Figure 5 it can be inferred that line emission from S, Fe, and Co lines lift up the left side of the Si ii 6355Å profile more than the right side. ¿From day 28pe on the Si ii 6355Å feature can no longer clearly distinguished from neighboring features in the W7 model spectra.
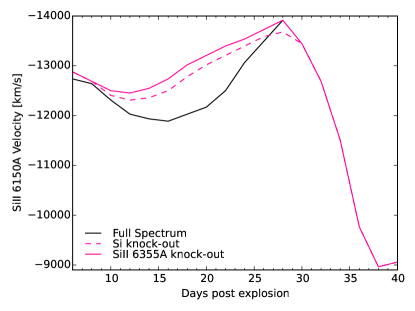
Figure 7 shows two different measurements of the strength of the Si ii 6150Å feature. The pEW measurement is agnostic about the nature of the feature and assumes a linear run of the continuum between the flux peaks on either side of the absorption feature. The true equivalent width (EW) measurement evaluates the true absorption of the Si ii 6355Å line only, isolated from other, unrelated features, and using the knowledge of the true continuum for this particular line, as it can be determined using knock-out spectra for this line. The pEW values are much larger than the EW values but, more importantly, the trend is different between the two.

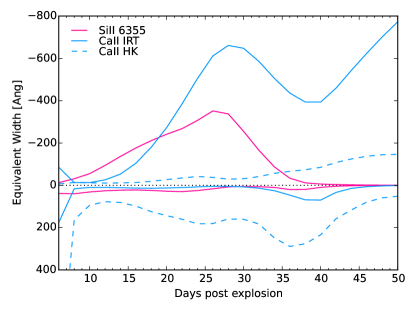
Figure 8 presents the evolution of the EW measure of the Si ii 6355Å, Ca ii IRT, and Ca ii HK features. Similar to Figure 7, the EW is calculated using the run of the known true continuum level over the line profiles, as determined from the knock-out spectra for each of these lines. In the W7 model spectra, the Si ii 6355Å and the Ca ii IRT line profiles are emission dominated from approximately day 10pe on. The Ca ii HK line profile is absorption dominated before day 44pe.
3.1. Absorption features
Si ii 6150Å absorption
On day 10pe, the absorption trough around 6150Å is dominated by Si iiȮn day 20pe, the Si ii feature has mostly changed to emission and is significantly supported by Co emission. This trend continues on day 30pe, before Fe emission (at nearly the same wavelength) completely takes over at day 40pe.
S ii “W” absorption
On day 10pe, the absorption trough around 5700Å is clearly dominated by S ii. On day 20pe, it is heavily blended with Co and Fe emission, and on day 30pe S ii has vanished.
Mg ii absorption
On day 10pe, the Mg ii absorption around 4300Å is blended with Si, S, and Fe absorption. On day 20pe, Fe absorption and Co emission dominate Mg ii, and on day 30pe Mg ii has vanished.
Ca ii absorption
The Ca ii HK absorption around 3750Å at day 10pe has contributions from Si and S absorption and Ti emission. On day 20pe and 30pe, the Ca ii HK trough is significantly deepened by Si absorption, obviously affecting its pEW (note that this problem does not affect the true EW values plotted in Figure 8). This also changes the absorption velocity.
The Ca ii IRT feature appears mainly in emission.
Fe ii 5000Å blend
The wide absorption trough around 5000Å is commonly identified as the “Fe ii blend” (e.g. Folatelli (2004); Hachinger et al. (2006)). Figure 4 and 4 show, however, that the Fe is weaker than contributions from other elements at day 10, 20, and 30pe. Only as late as day 40pe, this feature is really dominated by Fe absorption.
4. Discussion and Conclusions
4.1. Absence of an important emission peak
Generally, W7 provides a reasonably good fit to the Hsiao07 templates. There is, however, one important discrepancy. The model does not produce the emission peak around 5800Å that is observed on day 20, 30, and 40pe. This discrepancy is also seen in the spectra for W7 calculated using other radiation transport codes (e.g. Kasen et al. 2006; Kromer & Sim 2009; Wollaeger & van Rossum 2014). This is problematic because this emission peak is responsible for the blue side of the Si ii 6150Å trough important for line velocity and pEW measurements.
What makes this problem even more interesting is that other SN Ia explosion models do not produce this emission peak either (e.g. Kasen et al. 2009, Figure 2b; Röpke et al. 2012, Figure 3; Sim et al. 2013, Figure7). There are two possible reasons why this emission peak is absent from the models: 1. the chemical element(s) responsible for the observed peak is(are) under-represented in the explosion models, 2. the opacity data for the elements present in the models are missing one or more important transition lines11footnotemark: 1. Note that NLTE effects do affect the shape of SN Ia spectra (Baron et al., 1996), but are unlikely to explain discrepancies that are as large as this missing emission peak.
Since the origin of the observed emission line is unknown and it shapes the blue side of the Si ii 6150Å absorption trough, special care must be taken in interpreting the pEW of this important trough.
4.2. Blended features
Line features are known to strongly blend in SN Ia spectra, but it is still common to speak of identified features, named after the predominant contributor. Figures 4 and 4 show the degree of blending of the spectral lines in the model spectra as a function of time. The degree of blending depends on the detailed atmospheric conditions, which vary between SNe Ia. The W7 results presented here provide a qualitative picture of the blending effects. When combined with synthetic SN Ia ejecta configurations (density and composition) that are tuned to fit the spectra of a particular SN Ia, the knock-out spectra approach presented in this paper would allow the degree of blending to be determined quantitatively, increasing the information that can be gleaned from SN Ia spectra.
4.3. The Si ii 6150Å feature
The Si ii 6150Å feature is the strongest feature in many SN Ia spectra and is the feature that is most widely used to characterize and classify SN Ia spectra. It therefore deserves special attention.
Figure 6 compares the velocity of the Si ii 6355Å absorption line with that of the 6150Å trough.
Thus the figure compares the velocity of isolated Si with the value measured using the full spectrum.
At early times, the Si ii 6150Å trough is filled on the blue side by emission from the next bluer Si ii line, leading to lower measured velocities, but the effect is small, amounting to only a few percent.
Figure 8 shows that Si ii emission gradually declines from day 26pe on.
At the same time, the peak of the Si ii emission is seamlessly taken over by Fe ii emission at a slightly larger wavelength.
This reduces the pEW, and reduces the measured Si ii velocity and increases its measured gradient, at late times compared to their actual values.
For these reasons, correlating the measured Si ii 6150Å velocity at late times with values at around peak luminosity or earlier (see, e.g. Howell et al. 2006; Blondin et al. 2012) could be problematic, since the early- and late-time measured values of the velocity do not have the same physical origin. The same problems may apply to the definition of the velocity gradient definition used in Benetti et al. (2005). The improved velocity gradient definition used in Blondin et al. (2012) limits the use of Si ii 6150Å velocities to day 10 post-maximum brightness (approximately day 28pe for W7), and thus partly avoids these problems.
4.4. The nature of spectral features in SN Ia spectra
In this subsection we discuss why the concepts of absorption-line identifications and “continuum” can be misleading terms for interpreting SN Ia spectra.
Line Identifications
In the interpretation of SN Ia spectra, line-identification labels are often associated with apparent absorption troughs, and the peaks in the flux between the troughs are used to define the “continuum” level. However, many of the features in SN Ia spectra are due predominantly to emission. Figure 4 shows that, for wavelengths larger than 5400Å the spectral features generally are emission dominated (except possibly Si ii at very early times). Even at day 20pe (close to peak luminosity), emission contributes significantly to the flux level down to wavelengths as short as 3800Å. The widths and depths of these absorption troughs depend strongly on the strengths and separation of the adjacent emission features.
The Continuum Flux Level
Estimating a realistic pseudo continuum for a SN Ia spectrum is not an easy task. What can be said is that estimating the pseudo continuum using a line connecting adjacent observed flux peaks in the spectrum is unrealistic for many features at most evolution times, since line emission is strong in SN Ia spectra.
Definition of SN Ia feature strength
SN Ia ejecta configurations (density and composition) that are tuned to fit the observed spectra of a specific SN Ia would, in principle, allow the pseudo continuum to be determined for any spectral feature, using the method presented in this paper. However, such tuned ejecta configurations are not yet generally available.
In the meantime, it might be better to measure the strength of spectral features using the height difference of P-Cyg profiles, rather than the pEW method. The strength of a spectral feature would then be defined as the difference between the flux at the minimum of the trough and the flux at the maximum of the peak on the red side of the trough, normalized to the mean of the two fluxes. The emission peak on the blue side of the trough, whose strength is unrelated to the strength of the feature of interest, would thus be excluded, potentially giving a more robust and informative measure of feature strength. Note that, using this definition, the strength of a spectral feature is a dimensionless quantity that does not use the width of the feature, which is loosely related to the absorption velocity. Consequently, the measured strength and velocity of a velocity feature may be more independent. Applying this new measure of the strength of spectral features to large SN Ia spectral datasets can show whether its use strengthens the correlation between it other spectroscopic or photometric properties, or not, and how its use affects classification schemes based on line strengths.
In future work, we will extend the method presented in this paper by using synthetic SN Ia ejecta configurations (density and composition) tuned to produce synthetic spectra that match the spectra of specific SNe Ia. Such an approach, using parameterized radiation transfer calculations, based on both W7 and 2D and 3D simulations of more recent explosion models, will help make it possible to infer information from observed SN Ia spectra in a more physically self-consistent way.
References
- Baron et al. (1996) Baron, E., Hauschildt, P. H., Nugent, P., & Branch, D. 1996, MNRAS, 283, 297
- Benetti et al. (2005) Benetti, S., Cappellaro, E., Mazzali, P. A., et al. 2005, ApJ, 623, 1011
- Bessell (1990) Bessell, M. S. 1990, PASP, 102, 1181
- Blondin et al. (2012) Blondin, S., Matheson, T., Kirshner, R. P., et al. 2012, AJ, 143, 126
- Bongard et al. (2008) Bongard, S., Baron, E., Smadja, G., Branch, D., & Hauschildt, P. H. 2008, ApJ, 687, 456
- Branch et al. (1993) Branch, D., Fisher, A., & Nugent, P. 1993, AJ, 106, 2383
- Branch et al. (2006) Branch, D., Dang, L. C., Hall, N., et al. 2006, PASP, 118, 560
- Filippenko (1997) Filippenko, A. V. 1997, ARA&A, 35, 309
- Folatelli (2004) Folatelli, G. 2004, New Astronomy Reviews, 48, 623
- Hachinger et al. (2006) Hachinger, S., Mazzali, P. A., & Benetti, S. 2006, MNRAS, 370, 299
- Hauschildt (1992) Hauschildt, P. H. 1992, JQSRT, 47, 433
- Hauschildt & Baron (1999) Hauschildt, P. H., & Baron, E. 1999, Journal of Computational and Applied Mathematics, 109, 41
- Hauschildt & Baron (2004) —. 2004, A&A, 417, 317
- Hauschildt & Baron (2006) —. 2006, A&A, 451, 273
- Howell et al. (2006) Howell, D. A., Sullivan, M., Nugent, P. E., et al. 2006, Nature, 443, 308
- Hsiao et al. (2007) Hsiao, E. Y., Conley, A., Howell, D. A., et al. 2007, ApJ, 663, 1187
- Hutsemekers (1993) Hutsemekers, D. 1993, ApJ, 417, 97
- Jordan et al. (2008) Jordan, IV, G. C., Fisher, R. T., Townsley, D. M., et al. 2008, ApJ, 681, 1448
- Kasen (2006) Kasen, D. 2006, ApJ, 649, 939
- Kasen et al. (2009) Kasen, D., Röpke, F. K., & Woosley, S. E. 2009, Nature, 460, 869
- Kasen et al. (2006) Kasen, D., Thomas, R. C., & Nugent, P. 2006, ApJ, 651, 366
- Khokhlov (1991) Khokhlov, A. M. 1991, A&A, 245, 114
- Kromer & Sim (2009) Kromer, M., & Sim, S. A. 2009, MNRAS, 398, 1809
- Kromer et al. (2013) Kromer, M., Fink, M., Stanishev, V., et al. 2013, MNRAS, 429, 2287
- Lamers & Cassinelli (1999) Lamers, H. J. G. L. M., & Cassinelli, J. P. 1999, Introduction to Stellar Winds
- Long et al. (2014) Long, M., Jordan, IV, G. C., van Rossum, D. R., et al. 2014, ApJ, 789, 103
- Nomoto et al. (1984) Nomoto, K., Thielemann, F., & Yokoi, K. 1984, ApJ, 286, 644
- Olson & Kunasz (1987) Olson, G. L., & Kunasz, P. B. 1987, J. Quant. Spec. Radiat. Transf., 38, 325
- Perlmutter et al. (1999) Perlmutter, S., Aldering, G., Goldhaber, G., et al. 1999, ApJ, 517, 565
- Phillips (1993) Phillips, M. M. 1993, ApJ, 413, L105
- Riess et al. (1998) Riess, A. G., Filippenko, A. V., Challis, P., et al. 1998, AJ, 116, 1009
- Röpke et al. (2012) Röpke, F. K., Kromer, M., Seitenzahl, I. R., et al. 2012, ApJ, 750, L19
- Seitenzahl et al. (2013) Seitenzahl, I. R., Ciaraldi-Schoolmann, F., Röpke, F. K., et al. 2013, MNRAS, 429, 1156
- Silverman et al. (2012) Silverman, J. M., Kong, J. J., & Filippenko, A. V. 2012, ArXiv e-prints
- Sim et al. (2013) Sim, S. A., Seitenzahl, I. R., Kromer, M., et al. 2013, MNRAS, 436, 333
- van Rossum (2012) van Rossum, D. R. 2012, ApJ, 756, 31
- Wang et al. (2003) Wang, L., Goldhaber, G., Aldering, G., & Perlmutter, S. 2003, ApJ, 590, 944
- Wang et al. (2009) Wang, X., Filippenko, A. V., Ganeshalingam, M., et al. 2009, ApJ, 699, L139
- Wollaeger & van Rossum (2014) Wollaeger, R. T., & van Rossum, D. R. 2014, ApJS, 214, 28