SDSS J102623.61+254259.5: the second most distant blazar at =5.3
Abstract
The radio–loud quasar SDSS J102623.61+254259.5, at a redshift =5.3, is one of the most distant radio–loud objects. Since its radio flux exceeds 100 mJy at a few GHz, it is also one of the most powerful radio–loud sources. We propose that this source is a blazar, i.e. we are seeing its jet at a small viewing angle. This claim is based on the spectral energy distribution of this source, and especially on its strong and hard X–ray spectrum, as seen by Swift, very typical of powerful blazars. Observations by the Gamma–Ray Burst Optical/Near–Infrared Detector (GROND) and by the Wide–field Infrared Survey Explorer (WISE) allow to establish the thermal nature of the emission in the near IR–optical band. Assuming that this is produced by a standard accretion disk, we derive that it emits a luminosity of erg s-1 and that the black hole has a mass between 2 and 5 billion solar masses. This poses interesting constraints on the mass function of heavy () black holes at high redshifts.
keywords:
galaxies: active – quasars: general – X–rays: general1 Introduction
Blazars are Active Galactic Nuclei (AGN) whose relativistic jets are seen at a small angle from our line of sight, smaller than , where is the bulk Lorentz factor of the emitting plasma. The radiation emitted by their jets is therefore strongly boosted, making them visible at high redshifts. The most distant blazar known is Q0906+6930 (Romani et al. 2004; Romani 2006) with a redshift . The spectral energy distribution (SED) of this source reveals both the thermal (i.e. strong optical emission lines and continuum) and boosted non–thermal (dominating in all bands but the near IR and optical) components. This is a common characteristic of powerful blazars at high redshift: the non thermal emission is characterized by two broad humps, peaking at lower frequencies as the bolometric luminosity increases, making the underlying thermal emission visible in powerful blazars (since it stands between the two non–thermal humps; Ghisellini et al. 2010a; 2010b). The high energy hump, in these sources, peaks below 100 MeV, disfavoring its detection by the Large Area Telescope (LAT) instrument onboard the Fermi satellite (Atwood et al. 2009). Instruments observing in the hard X–ray band can instead have more chances to detect them, and in fact the Burst Alert Telescope (BAT) onboard the Swift satellite (Gehrels et al. 2004) have detected blazars up to larger redshifts than LAT (compare Ajello et al. 2009 and Ackermann et al. 2011). Their X–ray spectrum is hard [i.e. , assuming ], and this, together with a relatively strong X–ray to optical flux ratio, can be taken as a signature of the blazar nature of the source.
In this letter we suggest that SDSS J102623.61+254259.5, a radio–loud AGN at , is a blazar, i.e. the viewing angle is smaller than . If so, then this source indicates the presence, at approximately the same redshift, of other sources pointing in other directions, having similar intrinsic physical properties, including the black hole mass. Note that the flatness of the radio spectrum is not sufficient to guarantee the blazar nature of SDSS J102623.61+254259.5, since slightly misaligned sources (with respect to ) still show a flat radio spectrum, especially at relatively large radio frequencies (at , the observed 1.4 GHz flux corresponds to a rest frame frequency of 9 GHz), where the radio lobe steep radio emission does not contribute. Evidences for its blazar nature are its very large radio–loudness and very large radio luminosity. Observed by Swift, it revealed a strong and hard X–ray flux, confirming its blazar nature. Observations performed by the Gamma–Ray Burst Optical/Near–Infrared Detector (GROND; Greiner et al. 2008) and by the WISE satellite (Wright et al. 2010), together with the Sloan Digital Sky Survey (SDSS; York et al. 2000) spectrum, allowed to constrain the properties of the thermal emission.
In this work, we adopt a flat cosmology with km s-1 Mpc-1 and .
| (Å) | 4587 | 6220 | 7641 | 8999 | 12399 | 16468 | 21706 |
|---|---|---|---|---|---|---|---|
| AB magnitude | 24.0 | 22.070.08 | 19.970.03 | 19.860.04 | 19.500.10 | 19.230.15 | 19.070.21 |
2 B2 1023+25 as a blazar candidate
To obtain a sample of high redshift blazar candidates, we selected a list of quasars included in the SDSS DR7 Quasar catalog (Schneider et al. 2010), that have been analysed by Shen et al. (2011), with and radio–loudness , defined as (rest frame) in the work by Shen et al. We required a high radio–loudness in order to preferentially select objects with the jet directed toward us. Through this selection, we obtained a sample of 31 sources with including 3 with . The latter sources have no rest frame 2500 Å flux and hence we calculated extrapolating from the continuum at .
SDSS J102623.61+254259.5 (= B2 1023+25) is the best blazar candidate from this list, because of its very high redshift and extreme radio–loudness (). The precise value of the redshift is somewhat uncertain, since in NED, taken from the 6th Data Release of the Sloan survey (DR6), while in DR7, and in DR8. In this paper we assumed therefore a value of =5.3. This is a known quasar, observed for the first time in the B2 Catalog of radio sources (Colla et al. 1972). The radio position of this source is RA=10h26m23.62s, DEC=+25d42m59.4s and, according to the CRATES All–Sky Survey (Healey et al. 2007), the source has a flat spectrum with [between 1.4 and 4.8 GHz; ] and with a radio flux of and . We retrieved a number of radio fluxes from archival data111 ASI Science Data Center (ASDC): http://tools.asdc.asi.it/ . Moreover, B2 1023+25 is included in the WISE All–Sky Source Catalog222 Data retrieved from http://irsa.ipac.caltech.edu/ , with clear detections in the two bands at lower wavelengths of the instrument, i.e. m and m.
We retrieved and analyzed data of Fermi/LAT (Atwood et al., 2009) collected in the period 2008 August 4th – 2012 June 14th ( yrs). Photons of class 2 (“source”), with energies in the range 0.1–100 GeV, collected in a region of radius from the source position, were analyzed by using LAT Science Tools v. 9.27.1, Instrument Response Function P7, and the corresponding background maps. The followed procedures are described in detail in the analysis threads of the Fermi Science Support Center333http://fermi.gsfc.nasa.gov/ssc/data/analysis/. Particularly, the sources B2 1023+25 and Q0906+693 were fitted with a power law model, together with any other source of the 2FGL catalog (Nolan et al., 2012) within from their sky coordinates. The analysis resulted in no detection for both sources, with a upper limit on the photon flux above 100 MeV of ph cm-2 s-1.
2.1 GROND observations
The 7–band GROND imager, mounted at the 2.2 m MPG/ESO telescope at La Silla Observatory (Chile), started observing B2 1023+25 on 2012, April 16th at 23:16:56 UTC. We carried out two 8–minutes observations simultaneously in all 7 bands for a total exposure time of 919 s in the optical as well as 960 s in the NIR bands. Observations were carried out at an average seeing of 1.2 and at an average airmass of 2.1. The source was clearly detected in all bands but for which an upper limit of 24.0 (AB magnitude) can be given.
The GROND optical and NIR image reduction and photometry were performed using standard IRAF tasks (Tody 1993) similar to the procedure described in Krühler et al. (2008). A general model for the point–spread function (PSF) of each image was constructed using bright field stars, and it was then fitted to the point source. The absolute calibration of the bands was obtained with respect to the magnitudes of SDSS stars within the blazar field while the bands calibration was obtained with respect to magnitudes of the Two Micron All Sky Survey (2MASS) stars (Skrutskie et al. 2006).
Tab. 1 reports the observed AB magnitudes, not corrected for the Galactic extinction of from Schlegel et al. (1998).
2.2 Swift observations
Since this is our best blazar candidate, we requested a ToO observation from the Swift team, in order to have X–ray data to confirm our hypothesis. The Swift satellite observed B2 102325 twice: on 2012, June 21st (ObsID: 00032500001) and on 2012, June 22nd (ObsID: 00032500002). Data of the X–ray Telescope (XRT, Burrows et al. 2005) and the UltraViolet Optical Telescope (UVOT, Roming et al. 2005) were downloaded from HEASARC public archive, processed with the specific Swift software included in the package HEASoft v. 6.12444 Including the XRT Data Analysis Software (XRTDAS) developed under the responsibility of the ASI Science Data Center (ASDC), Italy. , and analysed. The calibration database was updated on July 16, 2012. We did not consider the data of the Burst Alert Telescope (BAT, Barthelmy et al. 2005), given the weak X–ray flux.
The total exposure on the XRT was of 10 ks and resulted in 26 counts. Given the low statistics, the fit with a power law model with Galactic absorption ( cm-2, Kalberla et al. 2005) was done by using the likelihood (Cash 1979). The output parameters of the model were and an integrated observed flux erg cm-2 s-1. The X–ray data displayed in the SED (Fig. 2) has been rebinned to have in each bin.
UVOT observed the source with two filters only: , with 8.4 ks exposure, and , with 1.6 ks. Both resulted in no detection with upper limits of the observed magnitudes equal to 21.70 and 20.76 mag, respectively.
2.3 Estimate of the disc luminosity
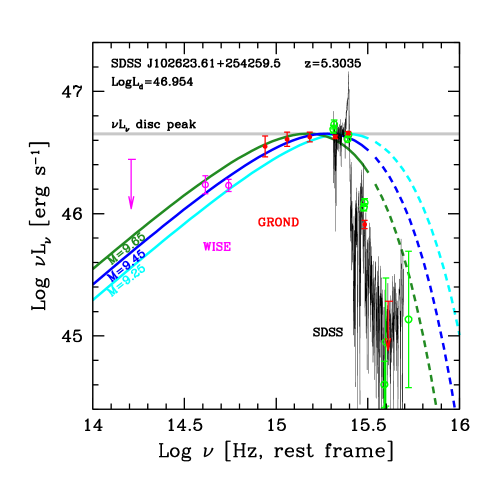
We can calculate the disc luminosity in two ways. The first is by assuming that the IR–optical flux is produced by a standard, Shakura & Sunjaev (1973) accretion disc, and finding the best that accounts for the data. In this respect, for B2 1023+25 we have a rather good set of IR–optical data showing that the peak of the disc emission is at frequencies just below the absorption caused by intervening clouds (see Fig. 1). Since the overall is about twice the peak luminosity, we directly derive .
The second method is through the broad emission lines, assuming they re–emit a fraction (i.e. their covering factor) of the ionizing luminosity, and assuming that the latter is provided by the accretion disc. The average value of is around 0.1 (Baldwin & Netzer, 1978; Smith et al., 1981), with a rather large dispersion. B2 1023+25 shows a prominent broad Ly, that unfortunately is absorbed in its blue wing. Using only the red wing, and subtracting the continuum in the same frequency range (adopting a power law model), we derive and a FWHM=4000 km s-1. These are twice the values we measured for the red wing only, implicitly assuming that the line is intrinsically symmetric. The ratio between the entire BLR luminosity and has been calculated by Francis et al. (1991) and Vanden Berk et al. (2001). The former gives a , while the latter gives a . Therefore (5–10) erg s-1. Finally, assuming , the estimate for the disc luminosity is (5–10) erg s-1. Although this estimate is affected by relevant uncertainties (e.g. partially absorbed Ly line and uncertain value of ), the estimated range encompasses the value found with the first method.
3 Black Hole Mass estimate
The flux and spectrum of the disc depend on the central black hole mass and on the accretion rate . The latter is traced by the total disc luminosity , with the efficiency parameter assumed to be . If we measure (hence ), we are left with as the only remaining free parameter. For a given , the black hole mass determines the peak frequency of the disc emission. A larger mass implies a larger disc surface and hence a lower temperature emitting a given luminosity. Therefore, for a fixed , a larger shifts the peak to lower frequencies. Then the best agreement with the data fixes . We adopt erg s-1, as discussed above, and calculate the overall spectrum from a standard Shakura & Sunjaev (1973) disc.
Fig. 1 shows the data in the IR–optical band (as labelled) and three disc emission spectra calculated assuming the same and three different mass values: (green line), (blue) and (cyan). Fig. 1 shows that, outside this range of masses, the model does not satisfactory reproduce the data any longer.
4 Overall spectral energy distribution
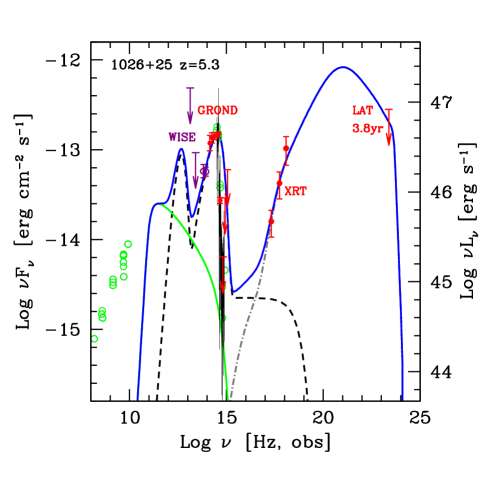
Fig. 2 shows the overall SED of B2 1023+25, together with a fitting model. The latter is described in Ghisellini & Tavecchio (2009), and consists of one emitting zone, in which relativistic electrons, whose energy distribution is derived through a continuity equation, emit by the synchrotron and Inverse Compton processes. The accretion disk component is accounted for, as well the infrared emission reprocessed by a dusty torus and the X–ray emission produced by a hot thermal corona sandwiching the accretion disc. The parameters adopted to fit the SED are very similar to other powerful blazars studied and interpreted with the same model (Ghisellini et al., 2010a; 2010b). The bulk Lorentz factor is , the size of the emitting region is cm, located at a distance of cm from a black hole of . The magnetic field is G. The main emission process for the X–ray and –ray non–thermal continuum is the inverse Compton process off the emission line photons (i.e. External Compton). Since the emitting region is rather compact, its radio emission is self–absorbed (up to600 GHz) and cannot account for the observed radio flux, that must necessarily come from much larger zones. The Poynting flux carried by the jet is erg s-1, and the power spent to produce the radiation we see is erg s-1. The power in the bulk motion of the emitting relativistic electrons is erg s-1, while the power in cold protons (assuming one proton per relativistic electron) is erg s-1.
4.1 Comparison with Q0906+6930
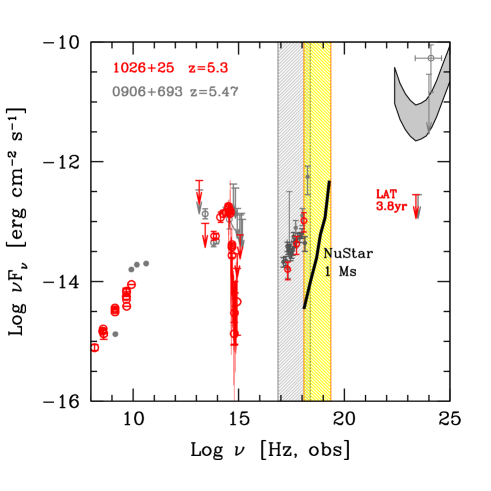
Fig. 3 shows how the SED of B2 1023+25 compares with the SED of Q0906+693. As can be seen, the two SEDs are very similar. The only, remarkable, difference could be in the –ray band, if the tentative EGRET association with Q0906+6930 is real. On the other hand, the upper limits of Fermi/LAT are the same for the two sources. This may suggest that the EGRET flux is not produced by Q0906+6930, although variations of even more than two orders of magnitude of the –ray flux are not uncommon for blazars (see e.g. Abdo et al. 2011; Ghirlanda et al. 2011).
Fig. 3 shows, as vertical stripes, the energy bands of XRT and of NuStar (Harrison et al., 2010). We report also the pre–launch estimated NuStar sensitivity for an exposure of 1 Ms. It is remarkable that both sources have an X–ray flux lying one order of magnitude above the NuStar sensitivity, making their detection possible even with a moderate exposure time, and even at the high energy limit of the instrument, i.e. at 80 keV. Note that 80 keV correspond, in the rest frame of a source, to 500 keV, that could be rather close to the peak of the high energy emission.
5 Discussion and conclusions
In this letter we propose that the radio–loud, high redshift quasar B2 1023+25 is a blazar. It is the second most distant blazar known up to now, with redshift , that corresponds to an age of the Universe of yrs.
Both its thermal and non–thermal components are very luminous. In agreement with the blazar sequence (Fossati et al. 1998) the two broad non–thermal humps peak at small frequency. In particular, the hard X–ray spectrum and the upper limit in the –ray band constrain the high energy component to peak in the MeV region of the spectrum. Therefore this source, along with the similar other powerful blazars, should have a relatively large hard X–ray flux and would have been an ideal target for planned hard X–ray instruments, such as EXIST, Symbol–X and NHXM, and it is a good target to be observed with the only orbiting satellite with focussing hard X–ray telescopes, i.e. NuStar (Harrison et al., 2010). The great sensitivity over its energy range [5–80 keV] enables it to detect the hard X–ray spectrum of this source, even if it cannot directly observe the peak of the high energy hump.
Thanks to the good data coverage in the IR–optical range, given by the combination of the 7 simultaneous optical–near IR filters of GROND coupled with WISE and SDSS data, we were able to estimate the central black hole mass, that turned out to be between 2 and 5 billion solar masses. This relatively small range compares well with the virial estimates in general (that have at least a factor 4 of uncertainties, see e.g. Vestergaard & Peterson 2006), and, in particular, it is the only method applicable for this source, where only a partially absorbed Ly line is visible (and virial methods are not yet well calibrated in this case). Near–IR spectroscopy, and hence the detection of the broad CIV and MgII lines, would help to improve the virial estimate of the black hole mass and be a valuable cross–check of our estimate, based on the disk–continuum.
It is remarkable to find radio–loud AGN hosting BH that massive at an age of the Universe of only yrs. The discovery that B2 1023+25 is a blazar, together with that one of Q0906+693, in fact, implies the existence of an entire family of radio–loud, very massive quasars in the early Universe, whose jet is not aligned with our line–of–sight. Moreover, it is possible to roughly estimate the number of these objects and their spatial density.
The comoving density of heavy black holes at high redshifts of radio–loud sources has been studied by Volonteri et al. (2011), based on the 3 years BAT catalog and the blazar luminosity function, in hard X–rays, derived by Ajello et al. (2009), and modified (beyond ) by Ghisellini et al. (2010a). In the latter paper the observational constrain on the blazar density with black holes heavier than in the redshift bin was based on the detection of only one object: Q0906+6930. Assuming it was the only blazar in the entire sky in this redshift bin, Ghisellini et al. (2010a) derived a comoving density of Gpc-3 of blazars hosting an heavy black hole in the bin (see Fig. 15 in that paper).
B2 1023+25 was selected in the SDSS catalog covered by FIRST observations, and the common area of the sky of these two surveys is 8770 square degrees. Its existence in this portion of the sky implies that the space density of blazars hosting a black hole is a factor greater than estimated previously (increasing the corresponding comoving density to Gpc-3). In turn, the density of all radio–loud sources hosting a black hole must be a factor larger, namely Gpc-3 in the bin. Note that this is a lower limit, since other high redshift blazars could exist, but not yet identified as such.
Moreover, assuming that the ratio of radio–loud to radio–quiet AGN is , the SMBHs with have to be at least just after yrs from the birth of the Universe.
Acknowledgements
We would like to thank the anonymous referee for useful comments. This publication makes use of data products from the Wide–field Infrared Survey Explorer, which is a joint project of the University of California, Los Angeles, and the Jet Propulsion Laboratory/California Institute of Technology, funded by the National Aeronautics and Space Administration. Part of this work is based on archival data, software or on–line services provided by the ASI Data Center (ASDC). Part of the funding for GROND (both hardware as well as personnel) was generously granted from the Leibniz Prize to Prof. G. Hasinger (DFG grant HA 1850/28–1). This work made use of data supplied by the UK Swift Science Data Centre at the University of Leicester
References
- [] Abdo A.A., Ackermann M., Ajello M. et al., 2011, ApJ, 733, L26
- [] Ackermann M., Ajello M., Allafort, A. et al., 2011, ApJ, 743, 171
- [] Ajello M., Costamante L., Sambruna R.M. et al., 2009, ApJ, 699, 603
- [] Atwood W.B. Abdo A.A. Ackermann M. et al., 2009, ApJ, 697, 1071
- [] Baldwin J.A. & Netzer H., 1978, ApJ, 226, 1
- [] Barthelmy S., Barbier L., Cummings J. et al., 2005, Space Sci. Rev. 120, 143
- [] Burrows D., Hill J., Nousek J., et al., 2005, Space Sci. Rev. 120, 165
- [] Cash W., 1979, ApJ, 228, 939
- [] Celotti A., Padovani P. & Ghisellini G., 1997, MNRAS, 286, 415
- [] Colla G., Fanti C., Fanti R. et al., 1972, A&AS, 7, 1
- [] Fossati G., Maraschi L., Celotti A., Comastri A. & Ghisellini G., 1998, MNRAS, 299, 433
- [] Francis P.J., Hewett P.C., Foltz C.B., Chaffee F.H., Weymann R.J. & Morris S.L., 1991, ApJ, 373, 465
- [] Gehrels N., Chincarini G., Giommi P. et al., 2004, ApJ, 611, 1005
- [] Ghirlanda G., Ghisellini G. & Tavecchio F., Foschini L., Bonnoli G. 2011, MNRAS, 413, 852
- [] Ghisellini G. & Tavecchio F., 2009, MNRAS, 397, 985
- [] Ghisellini G., Della Ceca R., Volonteri M. et al., 2010a, MRAS, 405, 387
- [] Ghisellini G., Tavecchio F., Foschini L., Ghirlanda G., Maraschi L. & Celotti A., 2010b, MNRAS, 402, 497
- [] Greiner J., Bornemann W., Clemens C. et al., 2008, PASP, 120, 405
- [] Harrison F.A., Boggs S., Christensen F. et al., 2010, SPIE, 7732, 21
- [] Healey S.E., Romani R.W., Taylor G.B. et al., 2007, ApJS, 171, 61
- [] Kalberla P.M.W., Burton W.B., Hartmann D., Arnal E.M., Bajaja E., Morras R. & Pöppel W.G., 2005, A&A, 440, 775
- [] Krühler, T., Küpcü Yoldas, Greiner, J. et al., 2008, ApJ, 685, 376
- [] Nolan P.L., Abdo A.A., Ackermann M. et al., 2012, ApJS, 199, 31
- [] Romani R.W., Sowards–Emmerd D., Greenhill L. & Michelson P., 2004, ApJ, 610, L9
- [] Romani R.W., 2006, AJ, 132, 1959
- [] Roming P., Kennedy T., Mason K. et al., 2005, Space Sci. Rev. 120, 95
- [] Schlegel D.–J., Finkbeiner D. P. & Davis M., 1998, ApJ, 500, 525
- [] Schneider D. P., Richards, G. T., Hall P. B. et al., 2010, AJ, 139, 2360S
- [] Shakura N.I. & Sunjaev R.A., 1973, A&A, 24, 337
- [] Shen Y., Richards G.T., Strauss M.A. et al., 2011, ApJS, 194, 45
- [] Smith M.G., Carswell R.F., Whelan J.A.J et al., 1981, MNRAS, 195, 437
- [] Skrutskie, M. F., Cutri, R. M., Stiening, R. et al., 2006, AJ, 131, 1163
- [] Tody D., 1993, Astronomical Data Analysis Software and Systems II, 52, 173
- [] Vanden Berk D.E., Richards G.T., Bauer A. et al., 2001, AJ, 122, 549
- [] Vestergaard M. & Peterson B.M., 2006, ApJ, 641, 689
- [] Wright E.L., Eisenhardt P.R.M., Mainzer A.K. et al., 2010, AJ, 140, 1868
- [] York D.G., Adelman J., Anderson J.E. et al., 2000, AJ, 120, 1579