Are Outflows Biasing Single-Epoch C IV Black Hole Mass Estimates?
Abstract
We use a combination of reverberation mapping data and single-epoch spectra of the C iv emission line in a sample of both low and high-redshift active galactic nuclei (AGNs) to investigate sources of the discrepancies between C iv- and H-based single-epoch black hole mass estimates. We find that for all reverberation mapped sources, there is a component of the line profile that does not reverberate, and the velocity characteristics of this component vary from object-to-object. The differing strength and properties of this non-variable component are responsible for much of the scatter in C iv-based black hole masses compared to H masses. The C iv mass bias introduced by this non-variable component is correlated with the shape of the C iv line, allowing us to make an empirical correction to the black hole mass estimates. Using this correction and accounting for other sources of scatter such as poor data quality and data inhomogeneity reduces the scatter between the C iv and H masses in our sample by a factor of 2, to only 0.2 dex. We discuss the possibility that this non-variable C iv component originates in an orientation-dependent outflow from either the proposed broad line region (BLR) disk-wind or the intermediate line region (ILR), a high-velocity inner extension of the narrow line region (NLR).
Subject headings:
galaxies: active — galaxies: nuclei — line: profiles — quasars: emission lines1. INTRODUCTION
Observations of galaxies in the local universe have led to the nearly universal acceptance that massive galaxies house a supermassive black hole (BH) at the center of their gravitational potential well. In the local universe, the masses of the BHs are strongly correlated with some properties of their host galaxies, leading to the and relationships (e.g. Ferrarese & Merritt, 2000; Gebhardt et al., 2000; Tremaine et al., 2002; Marconi & Hunt, 2003; Graham, 2007; Gültekin et al., 2009; Graham et al., 2011). Because of the apparent tight evolutionary relationship between the BH and its host, one way in which to probe galaxy evolution is to trace the growth of the central BH. In order to do this, we need reliable methods for measuring BH masses in the near and distant universe.
Direct dynamical BH mass measurement methods work only for nearby quiescent galaxies in which the gravitational sphere of influence of the BH can be spatially resolved (see, e.g., the review by Ferrarese & Ford, 2005, though also see Gültekin et al., 2009 for a discussion of deriving masses without resolving the sphere of influence). On the other hand, reverberation mapping (Blandford & McKee, 1982; Peterson, 1993) can be applied to active galactic nuclei (AGNs) to measure BH masses both locally and at cosmological distances. Unfortunately, the required length of the spectrophotometric monitoring campaigns needed to make the measurements becomes longer with increasing source luminosity and distance. As a result, current measurements only extend to sources with (see, e.g., Peterson et al., 2004; Bentz et al., 2009b; Denney et al., 2010; Grier et al., 2012a; see Kaspi et al. 2007 for a tentative result for a 2 quasar).
Extending direct mass measurements to large samples of objects at high redshifts in order to study the co-evolution of BHs and galaxies is not likely to be possible in the near future with current resources. However, the results from reverberation mapping of local AGNs can be used to calibrate indirect estimates of BH masses for large samples of objects using single spectra. These “single-epoch” (SE) mass estimates rely on the observed tight correlation between the monochromatic AGN luminosity, , and the radius of the broad line region (BLR), , measured in reverberation mapping experiments. With this method, only two observables are then needed: (1) a measurement of the AGN luminosity to use as a proxy for the BLR radius through this relationship (Kaspi et al., 2005, 2007; Bentz et al., 2006, 2009a), and (2) a measurement of a broad emission-line width (typically H, H, Mg ii , or C iv ) to estimate the Doppler-broadened BLR line-of-sight (LOS) velocity dispersion, . Combining these observables, a virial BH mass can be calculated as , where is the gravitational constant and is a scale factor of order unity related to the BLR geometry and kinematics111For reverberation mapping results that use the line width measured from the rms spectrum, an ensemble average, , sets the AGN BH mass scale zero-point, and is determined assuming AGNs follow the same relationship as quiescent galaxies (Onken et al., 2004; Woo et al., 2010). For SE masses, has a different calibration based on the differences between the SE and rms line widths for H (see Collin et al., 2006)..
The majority of reverberation mapping results to date use time delays measured from H emission line variability. Consequently, the most robust SE mass scaling relation is based directly on the relationship for this emission-line (see Collin et al., 2006; Vestergaard & Peterson, 2006; Bentz et al., 2009a). Scaling relationships for other broad emission lines are also available (McLure & Jarvis, 2002; Vestergaard & Peterson, 2006; McGill et al., 2008; Vestergaard & Osmer, 2009), but these SE mass scaling relationships are calibrated to the RM-based H mass scale rather than by direct measurements of the time delays for these lines. In this way, SE masses can be estimated for large samples of AGNs observed in spectroscopic surveys and across a large range of redshifts (see, e.g., Kollmeier et al., 2006; Shen et al., 2008, 2011).
This suite of intercalibrated AGN BH mass scaling relations initially seems the ideal method for using the myriad of optical survey spectra of AGNs to study BH-galaxy coevolution at all redshifts. However, there are significant concerns as to the reliability of masses based on lines other than H due to observed systematics in these masses compared to H masses. For example, only tentative reverberation results exist for Mg ii (Metzroth et al., 2006), so the use of Mg ii as a virial mass indicator is based only on its similar ionization potential and line width compared to H (McLure & Dunlop, 2004; Vestergaard & Osmer, 2009). Studies have shown, however, that Mg ii-based masses suffer from clear systematics, some of which may be related to the Eddington ratio (Onken & Kollmeier, 2008) or systematic line width differences between Mg ii and H (see Croom, 2011). Mg ii-based masses are also susceptible to biases related to the prescription used for measuring the line width (Rafiee & Hall, 2011).
The same is true of SE masses based on C iv. The current C iv mass scaling relationship (Vestergaard & Peterson, 2006, hereafter VP06) is based on a direct calibration to H reverberation-mapped AGNs. For this sample, VP06 found a relatively small scatter in the SE masses compared with the RM masses, dex, which has since been cited as the typical assumption of the accuracy of SE masses. Additional studies have also found a general consistency between C iv-based and Balmer-line-based masses (e.g., Greene et al., 2010; Assef et al., 2011). However, other authors have questioned the reliability of C iv as a result of finding little consistency or correlation and a large scatter between C iv- and H-based SE masses. These studies contend that C iv-based masses have too much scatter compared with H masses to be a reliable virial mass indicator (e.g., Baskin & Laor, 2005; Netzer et al., 2007; Sulentic et al., 2007; Shen & Liu, 2012).
One common postulate for this seeming unreliability is that the C iv emission region is susceptible to outflows and winds (see Richards et al., 2011, and references therein). Such non-virial gas velocities are then believed to bias the resulting SE mass measurements, rendering them unreliable. Interestingly, however, such dynamics do not seem to affect the C iv RM-based masses. In the few objects where RM measurements have been made for multiple emission lines, C iv results follow the expected virial relation with other low-ionization lines (Peterson & Wandel, 2000) and the BH masses derived from the individual lines, including C iv, are mutually consistent (Peterson et al., 2004). Here, we explore this apparent contradiction — why would RM-based C iv masses behave as expected but SE masses do not? In §2 we first review the fundamental assumptions that make estimating a SE mass possible. In §3 we investigate properties of the C iv profile in the RM sample, identifying a source of bias related to the C iv line profile. In §4 we quantify this bias and empirically fit a correction to C iv masses that significantly reduces the scatter between C iv and H SE masses. Finally, in §§5 and 6 we put our results in context to other studies, suggest a physical interpretation to explain our observations in terms of an orientation-dependent outflow, and summarize our findings.
2. Single-epoch Masses: The Fundamental Assumptions
We start by reviewing the assumptions made to estimate a SE BH mass. These assumptions are based on the different means with which the physical parameters required to measure a black hole mass (BLR radius and velocity) are inferred in indirect (SE) and direct (RM) methods.
SE masses rely on the continuum luminosity as a proxy for the BLR radius, and this is susceptible to two sources of uncertainty that do not affect direct RM measurements of the BLR radius: variability and host galaxy contamination. First, since RM measures the BLR radius directly from the delay between the continuum emission and the reprocessed line emission, an RM mass is not directly dependent on the luminosity. Instead, the measured BLR radius and velocity (and associated uncertainties) are physically connected to the intrinsic AGN luminosity through photoionization and its effects on BLR emission properties (e.g., the locally optimally-emitting cloud model; Baldwin et al., 1995). As a result, RM will always give the same mass independent of the intrinsic variability (cf. Bentz et al., 2007; Grier et al., 2012a, b). However, the delay that makes RM experiments possible means that the photons responsible for the luminosity measured in a SE spectrum are not the same as those responsible for producing the line emission whose width is measured in the same spectrum. Therefore, the reliability of SE masses depends on the assumption that the difference between the observed SE luminosity and that responsible for triggering the observed line emission is negligible, or at least small. Fortunately, the variability amplitude of AGNs is relatively small, %, on reverberation time scales — the light-crossing time of the BLR (see, e.g., MacLeod et al., 2010). Since , the uncertainty in the luminosity due to variability is not a dominant source of uncertainty in SE masses and is largely accounted for in the error budget through the uncertainties in the calibration of the relationship itself (see Bentz et al., 2009a). Second, only the AGN luminosity is correlated with the radius of the BLR, since photoionization of the BLR gas from the AGN continuum photons is what drives the relationship. Therefore, SE masses will be overestimated if the observed SE luminosity is not corrected for host galaxy starlight contamination. This contamination has been removed from RM data sets used to calibrate the relationship (Bentz et al., 2006, 2009a), but the RM masses themselves are independent of this contamination.
Next, because velocity is as important a parameter as the luminosity in determining SE BH masses (Assef et al., 2012) and , we must consider differences in the BLR velocity field characterizations of the SE and RM methods. RM masses are largely based on line widths measured from the rms spectrum (i.e., the spectrum formed from the rms flux deviations about the mean spectrum, based on all spectra obtained during a single reverberation mapping campaign), so that only the kinematics of the gas reverberating in response to the continuum photons contribute to the mass determination. The SE line profile is not necessarily equivalent to the rms profile because there can be non-variable emission components present. So, the reliability of SE masses also depends on the fundamental assumption that the SE line-width is an accurate proxy for the rms BLR velocity field. Comparisons of mean and rms H emission-line profiles show that even after removing the contamination from narrow line region (NLR) emission, the SE profile is not identical to the rms profile — not all the H broad line-emitting gas is reverberating, particularly in the high-velocity wings. This results, on average, in narrower rms spectrum profiles than mean spectrum profiles. For H, these differences are not significant enough to strongly bias the SE mass estimates once the differences are taken into account statistically by the calibration of the scale factor, , for SE masses (see, e.g., Collin et al., 2006; Park et al., 2011).
3. The SE versus rms C IV Profile
The many studies comparing SE H masses to RM masses reinforces the reliability of these masses, but no similar investigation exists for the other emission lines used for SE masses. The implication of (1) the large scatter between C iv and H SE masses and (2) the consistency of C iv and H RM masses strongly suggests that the problem lies in the assumption that the C iv mean and rms line widths are similar.
To examine this, we collected mean and rms line width characterizations from RM experiments of both H and C iv. We take the H FWHM and line dispersion, (the second moment of the line profile), measurements from Table 1 of Collin et al. (2006), which have all been measured homogeneously using the methods described by Peterson et al. (2004). Such a resource is not available for the C iv RM data sets, so we acquired the original mean and rms spectra from all available C iv RM experiments (Clavel et al., 1991; Reichert et al., 1994; Korista et al., 1995; Rodriguez-Pascual et al., 1997; Wanders et al., 1997; O’Brien et al., 1998; Peterson et al., 2005; Metzroth et al., 2006; Kaspi et al., 2007). From these mean and rms spectra, we fit and subtracted a linearly interpolated continuum between restframe continuum regions near 1450Å (except for the NGC 7469 rms spectrum, which was fit near 1500Å, where the continuum appeared lower) and 1700Å. We then measured the C iv line widths directly (i.e., no functional forms were fit), except for the case of the rms spectrum of NGC 4395, which was too noisy to measure directly. In this case, a sixth order Gauss-Hermite polynomial was fit to the data, and the width was measured from the fit. We employ the same line width measurement techniques as those utilized for H in order to have a homogeneous comparison. These new C iv measurements are given in Table 1.
| mean spectrum | rms spectrum | |||||
|---|---|---|---|---|---|---|
| Object | Data Set11For objects with multiple measurements, we include a note to distinguish between them; see References for details. | FWHM | FWHM | Ref.22Marie Curie Fellow | ||
| 3c390.3 | 6000150 | 536040 | 11340700 | 5760 50 | 1 | |
| Fairall 9 | 3040 50 | 410040 | 3290900 | 2670130 | 2 | |
| NGC 3783 | 3120 60 | 291020 | 4060200 | 2790 70 | 3 | |
| NGC 4151 | 1988 | 3180130 | 519030 | 13820530 | 5740 70 | 4 |
| NGC 4151 | 1991 | 6610260 | 480030 | 10450280 | 5160 90 | 4 |
| NGC 4395 | Visit 2 | 1070 10 | 213020 | 5840350 | 2510 50 | 5 |
| NGC 4395 | Visit 3 | 1270 10 | 195020 | 1900170 | 990150 | 5 |
| NGC 5548 | HST | 4080 70 | 394010 | 6840150 | 3640 30 | 6 |
| NGC 5548 | IUE | 4860250 | 410060 | 5590200 | 4110 60 | 7 |
| NGC 7469 | 3290 90 | 357030 | 4380190 | 2670 30 | 8 | |
| S50836+07133Unfortunately, we had to exclude this object from our analysis because the rms spectrum was very noisy, and the C iv variable emission was blended with variable He ii 1640, so a reliable C iv line width could not be measured from the rms spectrum. | 8920190 | 460030 | 9 | |||
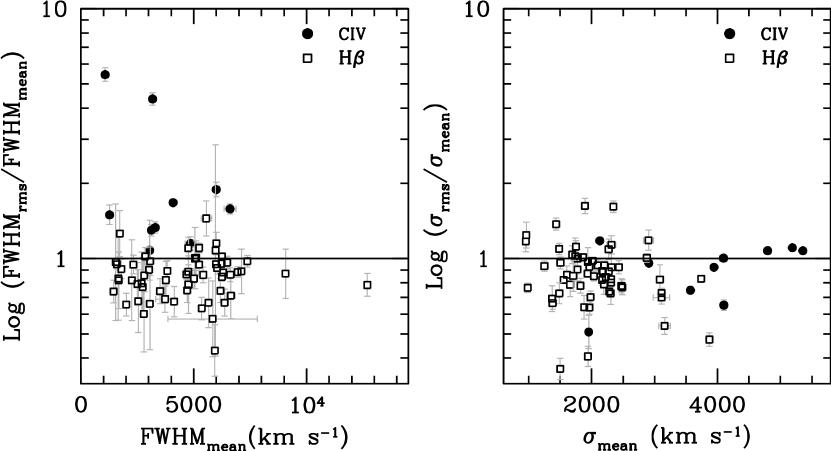
Figure 1 shows the ratios of the mean and rms line widths as a function of the line width for H (open symbols) and C iv (closed symbols). We consider first the results for the FWHM. The known trend that H shows systematically narrower rms than mean line widths (Collin et al., 2006) is clearly apparent, as the H ratios lie mostly below unity. On the other hand, C iv shows a systematically different trend, with all objects having broader rms than mean spectrum line widths, and in some cases the difference is quite large. The line dispersion ratios for H show a similar offset from unity, albeit with greater scatter. On the other hand, the C iv line dispersion ratios are now uniformly scattered around unity. Figure 1 shows that there are significant differences between the time variable and instantaneous or mean characterization of the H and C iv broad emission-line widths. These differences are larger for the FWHM than for the line dispersion, and they are the largest and least uniform for the FWHM characterization of the C iv line.
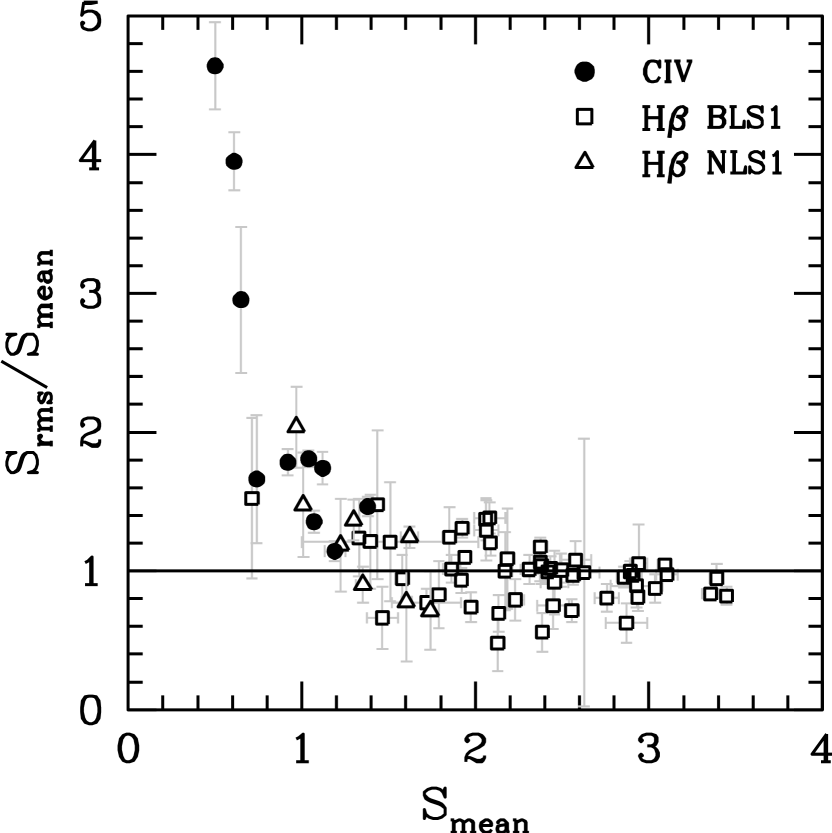
We investigate this incompatibility further by parameterizing the shape of the line profile in terms of the ratio . Profiles with lower values of have ‘peaky’ profiles with larger kurtosis, while those with higher values of have ‘boxy’ profiles with smaller kurtosis. A Gaussian profile has and a kurtosis of three. Figure 2 shows the ratio between the line shapes determined from the mean and rms spectra, , for both H and C iv. The shapes of the mean and rms H line profiles are essentially indistinguishable. There may be a weak effect associated with narrow line Seyfert 1’s (open triangles), where it is difficult to accurately remove the contribution from the narrow-line component. For C iv, however, the shapes of the mean and rms line profiles tend to be very different. The consistency in the mean and rms H line shape allows the simple offset in H widths seen in Figure 1 to be easily compensated for in the standard recalibration of the RM BH masses for SE data. No such calibration would work for C iv without introducing extra scatter in the SE mass estimates compared to RM mass estimates.
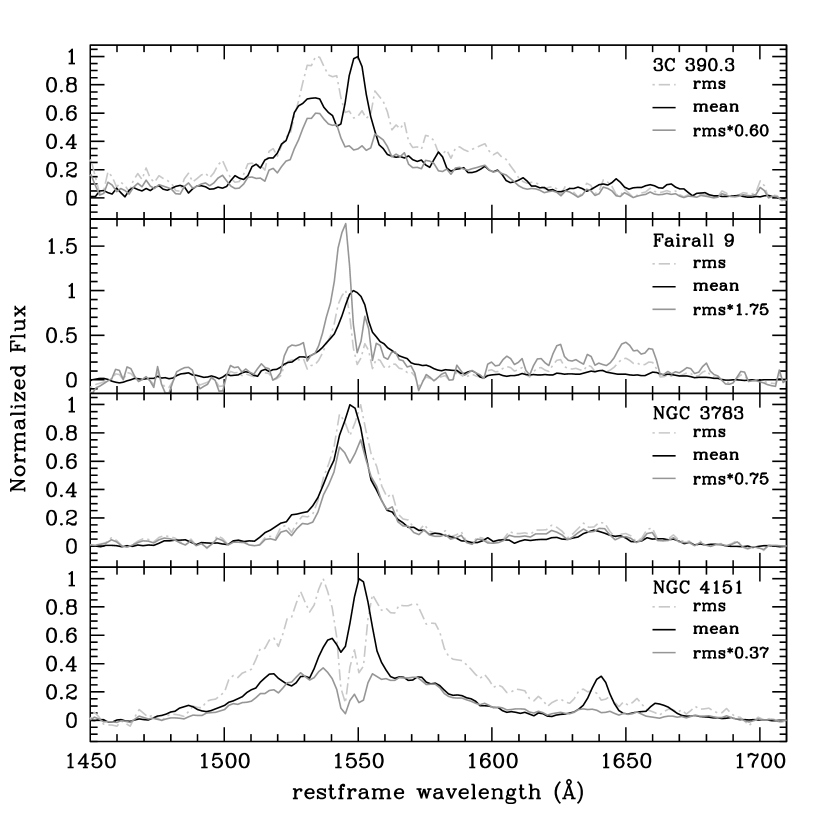
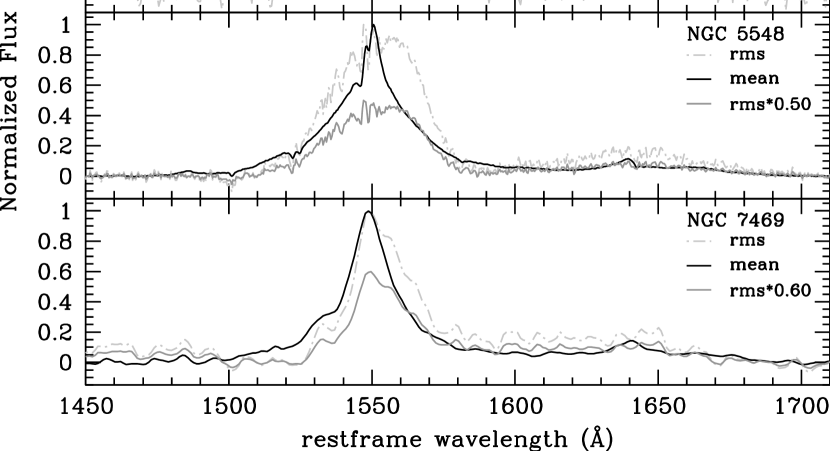
The differences between the SE and rms C iv profile can also be seen through visual inspection of the mean and rms spectra observed in C iv reverberation mapping campaigns. Figure 3 shows the mean and rms profiles for the RM sample, excluding the quasar monitored by Kaspi et al. (2007). The black curves show the mean spectrum C iv profile, normalized to the peak flux after subtracting a local, linearly interpolated continuum, and the gray, dashed-dotted curves show the corresponding continuum-subtracted normalized C iv line profile from the rms spectrum. Here the continuum was fit to both the mean and rms spectra using regions near restframe 1450Å and 1700Å. Normalizing in this way makes it easy to see that the FWHM in the rms spectrum is broader than that in the mean spectrum for all objects, as was also seen in Figure 1. More interestingly, however, are the visibly different shapes of the C iv lines in the mean and rms spectra. This was also already demonstrated in Figure 2, but we see in Figure 3 that the mean spectrum has an additional, low-velocity component absent from the rms spectrum for all objects but Fairall 9. In the case of Fairall 9, the rms signal is weak and the strength of the narrow core component in the rms spectrum is within the level of the flux uncertainties of the IUE campaign data, which makes it difficult to interpret the shape differences (see Rodriguez-Pascual et al., 1997). In general, it appears that the SE or mean C iv profile is made up of two components: a non-variable, largely core, component plus a variable component, the velocity profile of which can be isolated in the rms spectrum. We can emphasize which portion of the mean spectrum is variable with the solid gray curves in Figure 3 that show the normalized rms spectra scaled in flux by an arbitrary fraction to match (by eye) the mean and rms spectrum flux level in the red wing of C iv.
4. Shape Bias in C IV BH Masses
The existence of two components in the SE C iv profiles, only one of which is variable, has significant implications for the determinations of SE C iv BH masses, both for individual estimates but also for calibrating the C iv mass scale itself. The contribution of the non-variable component creates a bias to the relevant (i.e., reverberating) BLR velocity field. This is particularly true when using the FWHM to characterize the line width. Furthermore, the strength and profile of the non-variable component is not uniform object-to-object, so a simple change in the scale factor, , or subtraction of a constant, narrow velocity component will not work. Instead, it seems likely that any correction must be based on the shape of the individual C iv line profile.
To explore this, we compiled several samples from the literature that (1) have both C iv and H mass estimates, and (2) for which both FWHM and characterizations of the line width are published or for which we can measure them from the original C iv spectra so that we can calculate the shape parameter, . These samples include those of VP06, Assef et al. (2011, hereafter A11), and Netzer et al. (2007, hereafter N07). A11 provide all the needed quantities in their Tables 3 and 4. We use their “Prescription A” because it is most similar to the method used by VP06. We also consider both the group I and group II objects from A11, excluding only the broad absorption line quasar, H1413+117, leaving a sample of 11 objects.
The VP06 sample is of particular interest for investigating biases, since it calibrates the C iv SE BH mass scale. VP06 often used multiple SE spectra of a single object and calculated masses from each epoch. Furthermore, the epochs and number of spectra they used varied from object to object and between C iv and H. Here we are more interested in the SE C iv and H masses and for different objects rather than different epochs, so we derived a geometric average of each of these quantities for the VP06 sample. For objects with more than one epoch of data, we use the C iv FWHM and to calculate for each epoch, and then calculate a simple average of the individual values of , adding uncertainties from each epoch in quadrature222Intrinsic variations in could occur from epoch to epoch, so averaging over epochs may be removing information about long timescale changes in emission-line profiles known to exist. However, the standard deviation about the mean in all objects for which we calculate an average is much smaller than the formal uncertainties in propagated from the uncertainties in the measurements of the SE FWHM and .. We also average the SE C iv masses and uncertainties given in Table 2 of VP06 for each object in the same way. Finally, we recalculate the SE H mass using the updated formula provided by A11 (their Equation 4), which is based on the most recent calibration of the H relation of Bentz et al. (2009a). We then similarly average these SE masses to end up with one H mass for each object. Objects that had SE H masses but not SE C iv masses were omitted from the sample. For the six objects lacking an SE H mass, we used the RM mass, which is generally equivalent333This is not strictly correct because host galaxy starlight has not been removed from the SE luminosities. The resulting H masses for these six objects will be somewhat underestimated compared to the expected SE H mass (this underestimation is likely dex, based on the average difference calculated from the rest of the sample, for which both SE and RM masses are available).. This results in a sample of 27 objects taken from VP06.
N07 did not publish values for their sample, but their study was based on SDSS spectra. Thus, we obtained the SDSS spectra and remeasured both the FWHM, , and their uncertainties following the methods for “Prescription A” described by A11. This includes fitting sixth order Gauss-Hermite polynomials to the C iv profiles because of the typically poor data quality of this sample (average S/N per pixel in the continuum near restframe 1700Å is only 5.4). Interestingly, in several cases, our measurement for the FWHM of the C iv line in the N07 sample differs significantly from the values presented by N07, as shown in Figure 4. Unfortunately, N07 neither describe how they determined the widths of the lines given in their Table 2 nor provide any uncertainties on these measured values, so reconciling these differences is not possible here. Nonetheless, this highlights the difficulties in these types of studies as different measurement techniques applied to the same data set can result in statistically different measurements of the same quantities (see also Assef et al., 2011; Vestergaard et al., 2011; Park et al., 2011). We will continue to use our own FWHM measurements of the N07 sample because they have been determined with methods consistent with those applied to the other samples used here. We flag seven of these objects not necessarily because they are all outliers in any part of our analysis, but because we have evaluated their line widths to be potentially unreliable due to evidence for absorption in the C iv line profiles of the SDSS spectra444The classification of absorption here is based solely on the observed SDSS spectra. However, the existence of some such absorption has been verified in new, higher data obtained for seven of the N07 sources (Assef et al., 2011, Denney et al. in prep)..

Using our C iv line widths and the continuum luminosities given by N07, we calculate new SE C iv masses for each of the 15 objects in this sample based on the FWHM and following Equations 7 and 8 of VP06 (also Equation 6 of A11). We also recalculate the SE H mass using the FWHM and luminosity provided by N07 but using the formula given by A11. Unfortunately, we could not calculate uncertainties in the mass estimates because N07 do not provide uncertainties on the H width or optical/UV luminosity measurements. Nonetheless, this partial reanalysis places all masses on the same mass scale, with homogeneously measured C iv line widths.
In Figure 5, we show the ratio of C iv to H SE masses as a function of the line shape, . The top panel shows the BH masses calculated using the FWHM of the line. The different symbol types represent the different samples. There is a statistically significant correlation of the mass residuals with C iv line shape. The Spearman rank order coefficient, given in the top right corner of the plot, is , and the probability that such a correlation would arise by chance if the quantities were intrinsically uncorrelated is . These statistics were determined with only 46 of the 53 original objects because we omitted the seven absorbed N07 targets (gray stars) from the analysis.
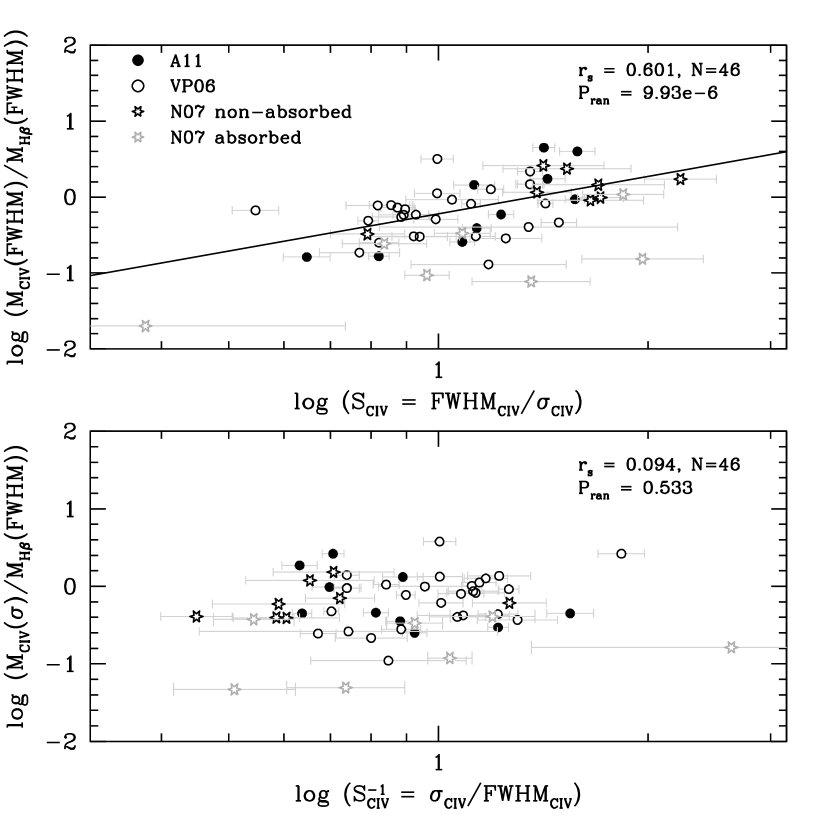
An initial concern when correlating the line shape, which is determined from the C iv FWHM, with the BH mass residuals, which are also a function of the C iv FWHM, is that the correlation is a consequence of this redundant dependence, effectively plotting FWHM vs. FWHM. To test this possibility, we also calculated the C iv BH mass using and compare the resulting mass residuals with H to the inverted the line shape parameter, , in the bottom panel of Figure 5. The H SE BH mass is still determined using the FWHM. Now both axes depend on in the same way they depend on FWHM in the top panel. If the correlation in the top panel was due only to a redundant dependence on line width in both coordinate axes, we would expect to see a correlation of similar strength in the bottom panel, but we find no correlation, with and . Furthermore, a partial correlation test between the quantities correlated in the top panel, with FWHM as a nuisance variable, results in a partial correlation coefficient, , which is nearly equal to that from the equivalent test for the bottom panel, with as the nuisance parameter, i.e., , yet again, we don’t see a correlation of the -based masses with . This not only confirms that the strong correlation of FWHM-based masses with shape is real (i.e., not due to a redundant dependence of BH mass and shape on line width), but also that C iv masses based on more reliably reproduce, in general, the H mass estimates. This latter point is not altogether surprising, since depends less on the structure of the core of the line profile, where the non-variable C iv emission component most strongly affects the shape.
The strength of the correlation between the FWHM-based mass residuals and C iv line shape suggests that this shape trend could explain a significant fraction of the scatter between SE C iv and H masses observed in the literature, as the studies discussed in the Section 1 generally used FWHM-based C iv masses. We can fit the correlation of the mass differences with shape to derive a corrected FWHM-based C iv SE mass equation of the form
| (1) |
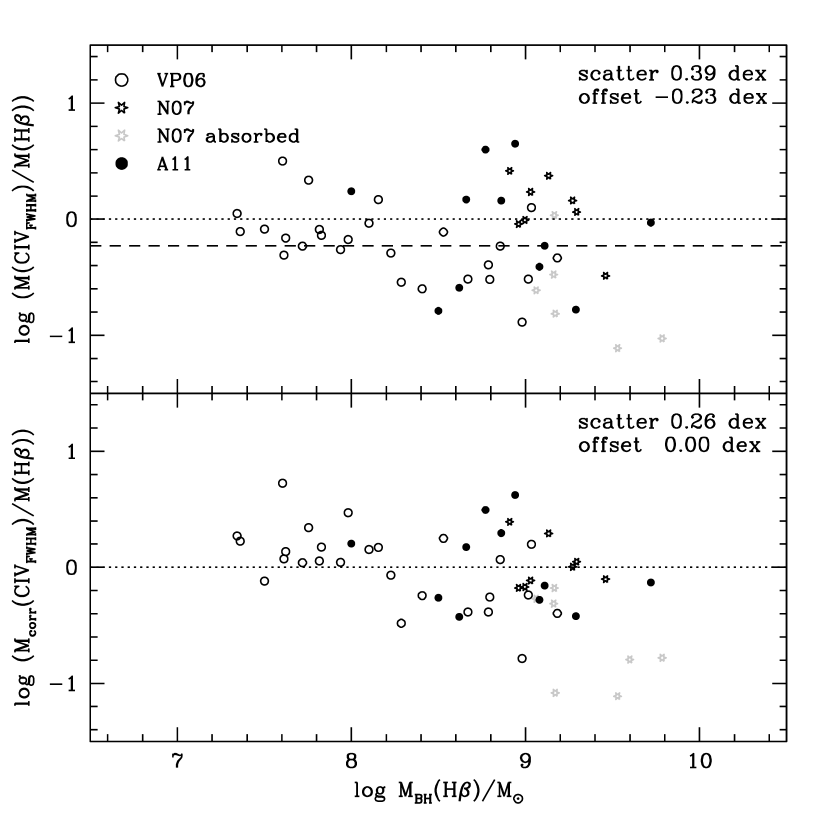
where the uncertainties in the slope and the intercept are given in Table 2. The top panel of Figure 6 shows the original FWHM-based C iv-to-H mass residuals as a function of H SE BH mass. The scatter in the combined sample about the 1:1 relation of equal C iv-to-H mass is 0.39 dex, and there is a mean offset of dex. The bottom panel shows the same residuals after correcting for the C iv line shape bias using Equation (1). There is no longer a mean offset and the scatter is now only 0.26 dex. We have excluded the absorbed N07 targets (gray stars) from the fit and latter scatter determination because the C iv mass of these objects is biased by factors other than the intrinsic C iv line shape (e.g., absorption; see also Denney et al. in prep.).
| Data Set | Slope | Intercept | Scatter |
|---|---|---|---|
| A11 | 3.65 0.79 | -0.336 0.101 | 0.20 dex |
| N07 | 1.49 0.67 | -0.172 0.143 | 0.16 dex |
| VP06 | 2.01 0.64 | -0.046 0.062 | 0.26 dex |
| Combined | 1.63 0.38 | -0.219 0.051 | 0.26 dex |
Despite the decreased scatter, there are still outliers. Many of these are the previously discussed N07 objects. The largest A11 sample outlier is Q0142100, but this object was classified as a group II object by A11, due to an unreliable H line width, so the problem may have nothing to do with C iv. The two largest VP06 outliers (one above and one below the 1:1 relation) are the two radio loud AGNs in the RM sample, 3C 120 and 3C 390.3. This may simply be a coincidence or may indicate that radio loud AGNs follow a different C iv shape relation than radio quiet AGNs. For example, Richards et al. (2011) found very distinct differences between the C iv properties of the radio-loud and radio-quiet populations.
5. Discussion
5.1. Other Line Width and Shape Characterizations
The FWHM is the most widely-used line-width characterization in the literature, and it has the advantages of being easy to measure and relatively insensitive to blending in the line wings. On the other hand, measurements of are robust for a wide range of line profiles and have been found to be a less biased line characterization in some cases (see, e.g., Peterson et al., 2004; Denney et al., 2009; Rafiee & Hall, 2011). The problems with measuring include difficulties in accurately defining the line wings, particularly in low spectra, and in the presence of other blended emission-line features. Despite these concerns, Figures 1 and 5, respectively, show that characterizing the C iv width with leads to (1) velocities that are more consistent with the 1:1 relation between the mean and rms spectrum in the reverberation-mapped sample, and (2) masses that show less bias with the line shape, . In fact, when we calculate the C iv mass using (i.e., Equation 8 of VP06), the scatter in the mass residuals about the 1:1 relation of 0.28 dex is only slightly larger than the scatter in the corrected FWHM-based masses (0.26 dex) shown in Figure 6, albeit with an additional systematic offset of dex indicating a zero-point calibration difference between the full sample and VP06. This offset could be due to the C iv shape bias or other systematic uncertainties in the exact prescription for calculating , such as blending with the red shelf (see, e.g. Fine et al., 2010; Assef et al., 2011). In either case, if we adjust the zero-point of the VP06 relation to eliminate the offset, the remaining scatter about unity is only 0.26 dex, equivalent to the FWHM-corrected C iv masses.
Because our shape correction to the C iv mass is a combination of only the FWHM and , expanding Equation (1) shows that we have effectively fit a virial relation of the form , where in general, and here, and . The preferentially higher weight of the line dispersion in this expansion explains the similarity of the scatter between the shape-corrected masses and -based masses. We also determined the C iv shape correction strictly from the kurtosis of the C iv profile. Results are not shown because they were only based on the N07 and A11 samples for which we had access to the data, but are consistent with using . This demonstrates that utilizing either (1) a combination of line width plus shape, or (2) a more complex (i.e., than FWHM) characterization of the C iv line profile is necessary to properly calibrate C iv and H masses due to the contamination of the non-variable component of C iv. Baskin & Laor (2005) also found that the scatter between C iv and H masses could be reduced by fitting a C iv mass correction based on additional C iv profile information, albeit with more parameters, to what we have done here. Additionally, Wang et al. (2009) and Park et al. (2011) have suggested relaxing a strict virial requirement () altogether as a means to reduce scatter in the calibration of SE mass scales due to systematic differences between various SE line profiles and the rms H profile to which these mass scales are ultimately calibrated. Rafiee & Hall (2011) found that this relaxation could also explain the “sub-Eddington boundary” for FWHM-based BH masses, but then again, so could using -based masses with the typical virial requirement.
5.2. Sources of Remaining Scatter
While the C iv shape correction defined by Equation (1) significantly reduces (by 0.13 dex) the scatter in the C iv-to-H mass residuals, a scatter of 0.3 dex still remains. We briefly investigated three potential sources for this remaining scatter:
-
1.
Data quality: Several absorbed N07 objects (gray stars) became even larger outliers after the C iv shape correction. This suggests that the measured line width in these objects is not the intrinsic line width, so the correction to these sources was meaningless. This is a serious concern for SE masses measured from survey quality spectra, which are typically of relatively low (see Denney et al., 2009; Assef et al., 2011, and Denney et al., in prep. for additional discussions and investigations of this concern).
-
2.
Data Inhomogeneity: As there is no universal prescription for AGN spectral decomposition and line width measurements, inhomogeneity in the data analysis and computational methods used to derive SE masses leads to measurable systematics when trying to compare masses between samples and emission lines. This is demonstrated by the comparison of our FWHM measurements of the N07 sample in Figure 4 (see also Assef et al., 2011; Vestergaard et al., 2011, for additional sample to sample comparisons). There are also no universal mass scaling relationships for each emission line, and differences in the mass scale also lead to differences in masses derived by different studies (see discussions by McGill et al., 2008; Shen & Liu, 2012).
-
3.
H Systematics: Literature comparisons between SE C iv and H masses typically blame C iv masses for any observed inconsistencies, since H is arguably the most well-characterized and best-studied line in terms of direct RM-based masses for comparison. However, H it is not without systematics of its own, particularly contamination by NLR emission and host galaxy starlight, which are relatively unimportant for C iv. The systematics introduced into the H line width and/or optical luminosity can be significant (Denney et al., 2009; Bentz et al., 2009a; Park et al., 2011).
We tested if the scatter in the C iv-to-H masses could be further reduced by addressing these additional sources of scatter. First, we removed (1) single VP06 epochs with pixel-1 in the continuum, (2) the seven objects from the N07 sample that show evidence for absorption (we could not cull pixel-1 data from this sample without eliminating it completely), and (3) the three A11 sources defined as Group II objects due to unreliable H widths and other issues (see Assef et al., 2011, for details).
Next, we removed host starlight from the VP06 sample by replacing the SE H masses with the RM H masses. Ideally, host starlight should be removed from all samples, but the required host fluxes are not available. In any case, the VP06 sample is the most susceptible to this bias because of its relatively lower mean AGN luminosity. This choice removes some of the consistency between the treatment of this sample compared to the A11 and N07 samples, but these differences are smaller than the accuracy gained by this correction.
Finally, fully removing the data analysis inhomogeneity is not possible. However, we fit and defined a shape-based C iv mass correction independently for each sample, since the sample-to-sample inhomogeneities in the spectral fitting and line width measurement techniques have likely led to a sub-optimal C iv shape correlation fit based on the combined sample. We list the individual sample fit parameters and uncertainties in Table 2. Figure 7 shows the results of these modifications to our analysis. The top panel again shows the ratio of the C iv-to-H masses of this “high-quality” sample before correcting C iv masses for the shape bias. Here the scatter around the 1:1 relation is now 0.33 dex, and the systematic offset is small, showing that simply removing poor quality data and host galaxy starlight alone can reduce the scatter. The bottom panel shows the residuals after correcting the C iv masses using the individual shape corrections determined for each homogeneous sample. Here the scatter is only 0.22 dex, demonstrating the C iv and H masses to be in very good agreement. The remaining scatter is less than the previously estimated intrinsic systematic uncertainties of dex inherent in SE masses (VP06) and is comparable to the uncertainty in the calibration of the relationship (Bentz et al., 2009a, though see also Peterson, 2010 for evidence that the intrinsic scatter is somewhat lower).

5.3. The BH Mass – Luminosity Color Correlation
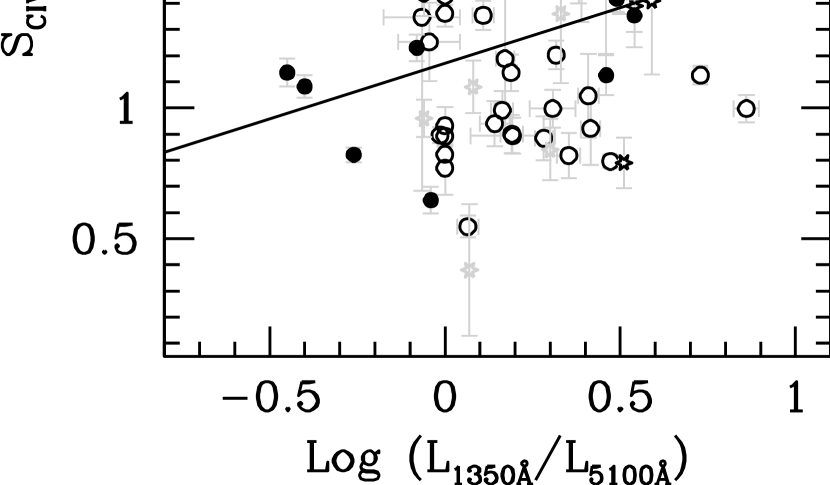
In their comparison of C iv and H-based masses in a sample of lensed quasars, A11 discovered a strong correlation between the ratio of C iv-to-H masses and the ratio of UV-to-optical luminosity. Such a correlation is naively expected, since the ratio of these masses is a function of the ratio of UV-to-optical luminosity. However, the slope of the correlation measured by A11 was in excess of that expected, if the only source of the correlation was the dependence of on (). Interestingly, if we combine the blueshift–equivalent width relation of Richards et al. (2011) with the blueshift–color relation of Gallagher et al. (2005), we expect a shape–color correlation in the sense that high (low) C iv profiles are seen in bluer (redder) AGNs. This means that our shape correction operates in the same sense as the A11 color correction.
Figure 8 shows this shape–color correlation. To be consistent, we used only SE, non-host-corrected for all objects, which necessarily decreased the VP06 sample by six objects. We compare the statistics from this shape–color correlation with the A11 mass–color correlation, but we first subtracted the expected dependence of the A11 correlated quantities on the ratio of the luminosities by removing the the luminosity term, , from the A11 mass residuals. This leaves only the excess correlation observed by A11, and is a more consistent comparison with the shape–color correlation, in which there is no redundant dependence on luminosity in both coordinate axes. The Spearman statistics listed in Table 3 show that both correlations are weak, but the correlation of with color is the stronger of the two. Since A11 did not use this combined sample to discover or define this correlation, we also make a comparison using the A11 sample alone. The fit to the A11 sample is denoted by the solid line in Figure 8, and the Spearman statistics are listed the top corner as well as in Table 3. The statistics show that these correlations are still not particularly strong, but are more significant than for the combined sample (as also noted by A11). The correlation of with color is, again, the more statistically significant of the two.
| Correlated | ||||
|---|---|---|---|---|
| Quantity | Data Set | |||
| Combined | 0.231 | 0.152 | 40 | |
| A11 | 0.555 | 0.077 | 11 | |
| Combined | 0.207 | 0.201 | 40 | |
| A11 | 0.527 | 0.096 | 11 | |
We also measured the mass–color correlation slope of the A11 Group I objects after correcting these FWHM-based C iv masses with Equation (1) above. A11 originally measured this slope to be . We measure a new slope of , which is marginally consistent with the expected slope of 0.53 from the mass scaling relationship dependence on . This suggests that the shape bias in the C iv masses is a likely driver for the A11 mass–color correlation and can at least partially explain the steep slope observed by A11. Additional work is underway using a larger sample to either identify or rule out additional effects, e.g., non-universal SEDs, that could also be contributing to the excess slope observed by A11.
5.4. Origin of the Non-variable C IV Component
Our analyses in §§3 and 4 have shown (1) that the SE C iv profile is a composite of both a variable (reverberating) component and non-variable component, and (2) that object-to-object differences in the characteristics of the non-variable component are a primary cause for the large scatter in FWHM-based SE C iv BH masses as compared to H masses. Here we discuss possible origins for these differences.
5.4.1 The “Traditional” Narrow Line Region
The first, obvious, possibility is to associate the low velocity component with the “traditional”, low-density NLR, i.e., the region responsible for emitting narrow forbidden lines, such as [O iii] . A NLR component is observed in the H emission line and has sometimes been assumed to be a component of the C iv profile as well (e.g., Baskin & Laor, 2005; Sulentic et al., 2007; Greene et al., 2010; Shen & Liu, 2012). However, we argue that this cannot be the origin of the non-variable component of C iv for the following reasons:
-
1.
While the C+3 ion is photo-ionized, the C iv emission line transition is excited collisionally. Photoionization models suggest that C iv emission from the low-density NLR region must therefore be weak (Ferland & Osterbrock, 1986). In contrast, the non-variable component seen in the mean C iv profiles of Figure 3 is often quite strong. Admittedly, C iv emission is still seen in Seyfert 2 spectra (e.g., Collins et al., 2005; Zheng et al., 2008), also suggesting a possible origin in the NLR, but studies have additionally shown that NLR emission line strengths and ratios are different between Seyfert 1’s and Seyfert 2’s (Zhang et al., 2008) and may be dependent on inclination (Fine et al., 2011).
-
2.
Not all C iv SE profiles show an obvious narrow, core component. The presence and strength of this component is also anticorrelated with blueshift and the C iv equivalent width (Wills et al., 1993; Richards et al., 2002; Leighly & Moore, 2004; Richards et al., 2011). It is much more probable that this reflects differences in the BLR kinematics or geometry between objects rather than correlations between NLR and BLR kinematics.
-
3.
A large percentage of C iv SE profile peaks are blueshifted (Richards et al., 2011), some by thousands of km s-1. While NLR emission can be blueshifted from the systemic redshift, it would not be expected to show these large of blueshifts. If present, NLR emission should appear at or at least near the systemic redshift, leaving it relatively redshifted with respect to the highly blueshifted C iv profile (Wilkes, 1984). One would then expect potential double-peaked profiles in these objects, rather than this component simply being absent. Such a feature is not observed here, in large samples, or even in composite AGN spectra (see, e.g., Richards et al., 2011).
-
4.
We subtracted the scaled rms spectrum from the mean spectrum of all objects shown in Figure 3 (except Fairall 9 because of the poor quality rms spectrum) and measured the FWHM of the residual non-variable components using the same methods as in Section 3. We also measured the FWHM of the O iii 5007 line from this sample, subtracting a linear, local continuum, from available optical data. Figure 9 shows that the velocity widths of the non-variable narrow cores are larger (often significantly so) than those measured in the unblended NLR O iii 5007 line. Combining these relatively broad core widths with the core strength and additional blue excess emission in most of this sample, it is unlikely that this component is, at least solely, from the traditional, low-density, extended NLR emission.

5.4.2 A BLR Disk-wind
The presence of a BLR wind has been used to explain a wide variety of observed AGN phenomena. This includes, for instance, the often blueshifted C iv profile (see Richards et al., 2011, and references therein), absorption line features (e.g., Hamann et al., 2011), and AGN outflows and feedback (e.g., Reeves et al., 2009). Richards et al. (2011) argue that the sources with the largest blueshifted C iv profiles are the “wind-dominated” sources, where this wind component causes a blueshifted peak and line asymmetries (cf. Leighly & Moore, 2004) in the SE C iv profile. These observations are consistent with the non-variable blue excess emission we observe when comparing the RM mean and rms spectra. However, we also observe a strong low-velocity, non-variable core in some objects. So in terms of the SE BH mass estimates alone, if this total non-variable component (core blue excess) is a disk-wind, it is the peaky, low -value objects with the strongest SE core components that would have the largest wind “contamination” or bias in their FWHM and therefore FWHM-based SE mass measurements.
The BLR disk-wind has been suggested to be launched from the inner, high-velocity, high-ionization regions of the BLR or outer accretion disk (cf. Murray & Chiang, 1997; Elvis, 2000, 2012), so the additional non-variable, low-velocity core component observed here does not readily fit into this model unless there is an orientation dependence of the wind component relative to the line of sight (LOS). The RM mean and rms spectra in Figure 3 as well as C iv profiles in general show that the strength of the blueward asymmetric emission appears to be roughly anti-correlated with the strength of the low-velocity core (e.g., the blueshift–equivalent width relation discussed by Richards et al. 2011). Therefore, we argue that if this non-variable component does originate in an outflowing BLR wind, there should be an orientation dependence, where the change in C iv profile from ‘peaky’ to ‘boxy’, or low to high , is due to varying levels of LOS wind contamination to the broad emission line profile as a function of orientation. Furthermore, because this component does not reverberate, such a wind would necessarily be optically thin to the ionizing continuum (see, e.g., Korista & Goad, 2004, who discuss the possibility that low optical depth can explain the non-variable wings of the H profile).
For a diskwind BLR (cf. Figure 1 of Murray & Chiang, 1997) to support our observations of the variablenon-variable C iv profile and put these observations in context to other C iv observations, an optically-thin wind that is more polar than equatorial is required. In this case C iv can still be emitted in the wind but does not reverberate. We can then make a simple generalization for a composite “disk” (variable component) plus “wind” (non-variable component) C iv profile (see also Wang et al., 2011). We would then expect the following orientation-dependence of the profile of each component:
-
•
The disk: As the inclination decreases (goes from edge-on to face-on), the disk component experiences a general narrowing in velocity width due to the change in inclination. There is no other a priori requirement for the shape of the line; photoionization and BLR geometry model-fits to the Balmer line profiles have shown that a wide variety of both single- and double-peaked profiles can exist and still arise from a virialized disk-like distribution of gas with varying optical depths (see review by Eracleous et al., 2009, and references therein).
-
•
The wind: At high (closer to edge-on) inclinations, the wind component is narrow and centered near the C iv systemic velocity, as the direction of outflow is largely perpendicular to the LOS. As the inclination decreases, more of the wind is observed to be outflowing along the LOS. Consequently, the wind emission is distributed across a larger, preferentially blue-shifted, range of velocities, so the peak also blueshifts and decreases in flux.
5.4.3 The Intermediate Line Region
Another previously suggested explanation for the peaky SE core component in some C iv lines is that this emission arises in an “intermediate line region” (ILR; Wills et al., 1993; Brotherton et al., 1994). Such a region is explained as a higher-velocity, higher-density inner (i.e., closer to the BLR) extension of the NLR. Wills et al. (1993) alternately suggest a different, simple model in which the core C iv emission could be coming from a bipolar outflow, but this may not be mutually exclusive to the ILR/inner NLR. More recent spatially-resolved studies of the kinematics and physical conditions in the inner NLRs of local Seyferts (e.g., Das et al., 2005; Kraemer et al., 2009; Crenshaw et al., 2010; Fischer et al., 2010, 2011) show a link between possible ILR C iv emission and biconical outflows (cf. Crenshaw & Kraemer, 2007). While we mentioned above that densities in the “typical”, i.e., extended, NLR are not high enough to result in significant emission from high-ionization species, spatially resolved STIS spectra have co-located high-ionization-line emission with knots of [O iii] emission in the inner NLR (e.g. Collins et al., 2005). Such emission must be enhanced by collisional processes (Kriss et al., 1992), such as shock heating or microturbulance, mechanisms likely to be present if this emission is arising in an outflow (Kraemer et al., 2007). Nelson et al. (2000) and Kraemer et al. (2000) show that with HST observations of nearby Seyferts, spatially-resolved C iv emission does arise outside the unresolved nucleus, i.e., from the ILR/inner NLR. However, the C iv emission flux drops significantly faster than [O iii] emission as a function of radius. The spatially resolved inner knots of [O iii] emission also show relatively high, 1000 km s-1, and even blueward asymmetric velocities (Nelson et al., 2000; Das et al., 2005; Fischer et al., 2011), both reminiscent of the non-variable C iv component we see here. Unfortunately, and important for potentially characterizing the non-variable C iv profile, because the [O iii] emission extends to much larger radii and lower velocities, the line profile of the “integrated” [O iii] emission in typical ground-based spectra of both near and distant objects is not a good template match for the observed non-variable C iv core emission.
In this type of scenario, the non-variable component of the C iv line, i.e., both the peaky, low-velocity C iv core emission and blue excess, could be attributed to the ILR emission and part of a biconical outflow. LOS emission-line profiles from such a distribution of gas would therefore exhibit velocity widths larger than the typical, extended NLR region that is probed by integrated forbidden-line emission profiles, but narrower than typical BLR emission. Additionally, if the gas is outflowing, blueshifts are to be expected, and potentially more prominent for the higher gas velocities, since this emission likely arises at closer radii and may therefore by more highly collimated by the bicone. These are all expectations consistent with the observations of the C iv emission line profile seen here and in previous studies. Furthermore, our orientation-dependent model of the non-variable C iv emission introduced above fits equally well with an origin in a biconical ILR outflow as in the BLR disk-wind, since the LOS component from the inner region of such an ILR outflow should change as a function of orientation. Such a distribution of gas would also not be expected to reverberate. Because the spatial scales are large relative to the time scale of variability, any reverberation signal would be spatially damped. Therefore, the non-variable nature of such an emission component naturally holds for this origin, at least on reverberation time scales.
5.5. Evidence for Orientation-Dependence
Both origins for the non-variable C iv component that we suggest above require an orientation dependence to the outflow component of C iv emission. We first looked for indications of an orientation dependence by comparing our orientation expectations with the C iv profile trends observed in the RM sample. To do this, however, we must isolate the non-variable component profile to search for signs of orientation dependence. This was done through a spectral decomposition of the mean spectrum C iv profiles shown in Figure 3. We assume that the mean profile is a superposition of the BLR ‘disk’ (variable component) and outflow (non-variable component). The rms profile shows variable emission only, so we generalize this emission to arise solely in the reverberating BLR ‘disk’. We decompose the mean profiles into variable and non-variable components by first fitting the scaled rms profile (solid gray curves in Fig. 3) with a sixth order Gauss-Hermite polynomial as a means to derive a smooth profile for the disk component. We subtract this component from the mean spectrum, and attribute the residual non-variable flux to the outflow component. We fit the residual emission again with a GH polynomial after interpolating over any narrow absorption features.
We highlight this decomposition for the C iv profiles of NGC 4151, whose mean spectrum has a relatively low -value (0.61) with a strong non-variable core, and NGC 7469, which has higher (0.92) with a notably weaker non-variable core but with additional, non-variable blue excess. The results of the decomposition for these two sources are shown in Figure 10, where the original mean and rms spectrum and individual and composite (disk plus outflow) profile fits are shown for NGC 4151 and NGC 7469 in the top and bottom panels, respectively.
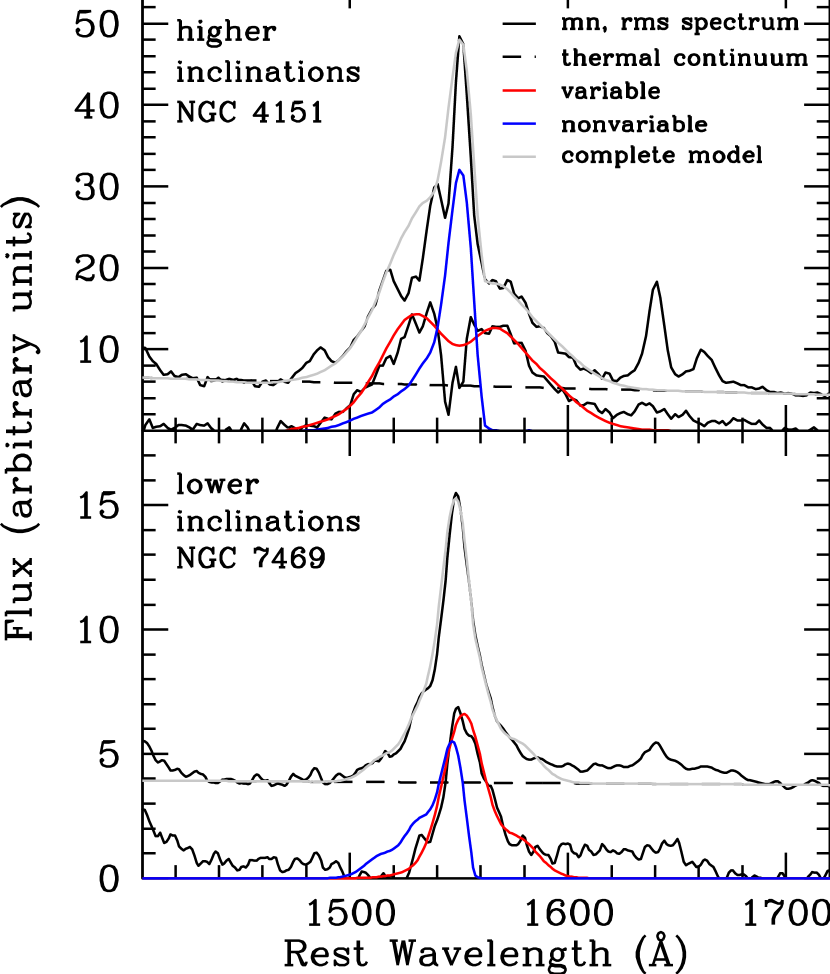
From this exercise, we observe for NGC 4151 that (1) the rms profile (our disk component) is broad and double-peaked, possibly demonstrating the emission expected from an inclined disk (Eracleous & Halpern, 1994), and (2) the relatively narrow velocity distribution of non-variable residuals would also be expected from an outflow directed largely perpendicular to the LOS. While the model-fit to the rms spectrum over-predicts the flux in the core, this acts only to somewhat underestimate the core strength but does not significantly change the profile of the residual non-variable component. As it would not be possible to view this broad-line AGN perfectly edge-on and still see a broad-line AGN (in the unified model), the extended and blue-shifted wing in the non-variable component profile is also consistent with the expectations for this component arising in an outflow. For NGC 7469 we see (1) a less peaky and more blueshifted outflow component and (2) a narrower disk component. These are both expected characteristics of a more face-on orientation. The combined fit conspires to produce a smooth but slightly asymmetric profile, characteristic of many SE C iv profiles.
The orientation-dependent model we describe here is naively simple. Interestingly, however, our crude decomposition using two test cases from the RM sample places no a priori expectations for the profiles of the individual variable and non-variable components. Yet, the results of attributing these components to a BLR diskoutflow composite profile are strikingly similar to what is expected if we are viewing NGC 4151 at a higher inclination (more edge on) and NGC 7469 at a relatively lower inclination (more face on).
There are also numerous discussions in the literature of orientation dependencies to observed AGN properties. For example, Richards et al. (2002) suggested the possibility of an orientation effect in the C iv blueshifts, and thus wind component, though interestingly in the opposite sense that we argue here. Richards et al. (2002) advocated that large blue-shifted profiles were viewed from more edge-on orientations, which follows the expectations of the largely equatorial wind in the Murray & Chiang (1997) model. However, Richards et al. (2011) argue against such a dependence based on radio morphology studies. Other radio morphology studies also show no or only weak orientation-dependence of C iv widths (Jarvis & McLure, 2006; Fine et al., 2011). However, these studies are based primarily on using the FWHM, and we have shown here that C iv FWHM measurements are biased by the non-variable component. In fact, C iv profiles resulting from an orientation-dependence of the non-variable component in the sense we propose above (creating preferentially peaky profiles for high inclination and boxy profiles for low inclination) would act to mask the expected changes in the FWHM of the BLR ‘disk’ component that these studies hope to probe: The non-variable component contamination will lead to an artificially large measurement of the FWHM for low inclinations and an artificially small measurement of the FWHM for high inclinations.
Another place to search for possible orientation-dependent quasar phenomena is in the characteristics of broad absorption line quasars (BALQSOs), which have been inferred to be viewed preferentially more edge-on (e.g., Murray et al., 1995; Elvis, 2000). This is partly because their continua are relatively more reddened than non-BALQSOs (Reichard et al., 2003, and references therein). However, other observations and models have shown that (1) polar outflows are also capable of producing BALs (Brotherton et al., 2006; Zhou et al., 2006; Ghosh & Punsly, 2007; Borguet & Hutsemékers, 2010), (2) individual fits to BALs cannot constrain the geometry and orientation of the BAL region (Hamann et al., 1993), and (3) radio BAL and nonBAL quasars are nearly indistinguishable across a wide range of observed and physical properties, including spectral shape, spectral index, and polarization properties (Bruni et al., 2012). This evidence suggests that BALs can be observed in quasars over broad range of orientations.
Furthermore, discussing the results of some previous studies in the context to this simple orientation dependence of the C iv SE profile leads to some novel interpretations of the observations (though we do not claim to be able to explain every aspect of these observed phenomena with only inclination):
-
•
The Baldwin Effect (Baldwin, 1977). We argue that the lowest equivalent width objects are those that tend to have high and are the most face-on. The continuum photons escaping the central source should therefore be the least obscured by other nuclear material. This will lead to a larger observed luminosity, on average, compared to higher inclination objects, which we argue are observed to have high-equivalent width, low profiles due to wind contamination.
-
•
NLR Component Removal (e.g. Baskin & Laor, 2005; Sulentic et al., 2007). Some studies argue the narrow C iv core originates in the NLR. Yet, Sulentic et al. (2007) have pointed out that the narrow-line components in C iv are often broader and stronger than typical, “O iii 5007-like”, NLR emission. Though Sulentic et al. (2007) found better correlations between C iv and H after removing a narrow core component, they were still left with a large scatter between their C iv and H masses. In the context of our model and other arguments in Section 5.4.1, the large scatter remaining in the Sulentic et al. (2007) results is most probably due to the uncertainty in fitting and subtracting their “narrow” component. Since the orientation-dependent non-variable component cannot simply be described as a typical NLR emission line, a traditional spectral decomposition does not work for C iv.
-
•
“Extincted” red wing of C iv (see e.g., composite spectra of Richards et al., 2002, 2011). Past physical explanations for this phenomenon (cf. Gaskell, 1982) include a combination of radial gas motions and obscuration, though Gaskell admits that it is questionable whether the dust grains required for such obscuration could survive in the BLR. Our orientation-dependent disk-outflow model explains this phenomenon simply: as the inclination decreases, the observed range of disk velocities narrows. Conversely, the observed velocities of the outflow component are increasing as it becomes directed more along the LOS, effectively filling in the high-velocity portion of the profile previously occupied by the disk emission. However, this process is preferentially blueward asymmetric because the receding component of the outflow is not visible through the disk. This leaves the red side of the profile devoid of emission from the highest velocity gas.
-
•
Correlation of blueshift with luminosity (Richards et al., 2011). This is expected if these are the population of objects seen more face-on. Furthermore, Gallagher et al. (2005) demonstrated with a color-blueshift distribution that large blueshift AGNs are less likely to have red continua, regardless of whether intrinsic or dust-reddened. This would similarly be true if we are seeing these objects more face-on.
-
•
Intrinsic colors of BALQSOs (Reichard et al., 2003). Despite the observed trend of BALQSOs being more reddened than nonBAL quasars, Reichard et al. (2003) found that after correcting for SMC-like dust reddening, BALQSOs appear to be drawn from the same parent population as nonBALs (see also Bruni et al., 2012). Upon further detailed inspection of BALQSO properties as a function of ‘intrinsic’ colors, Reichard et al. (2003) also discovered the same nonBAL quasar C iv emission line trends of larger (smaller) equivalent width profiles for ‘intrinsically’ red (blue) HiBALs (their Figure 9). This suggests to us that the obscuration typical of BALQSOs may not necessarily be an orientation dependent effect (e.g., from a torus, which would indicate a preferential edge-on orientation). Instead, if the C iv line shape trend is an orientation effect as we suggest, the obscuring regions responsible for producing BALs in quasars may in fact be orientation independent. The range of observed C iv profiles in BALQSOs is then additional evidence that BALs can be observed over a range in orientations.
Realistically, there are many geometrical, kinematical, and physical properties of the BLR that could cause varying contributions from the LOS component of a BLR disk-wind, and most likely, more than one effect is present in varying degrees for different samples of AGNs. For example, Murray & Chiang (1997) find that stronger core emission from an equatorial wind component can occur without requiring an inclination-dependence; instead, it is the result of simply extending the outer radius of the wind-emitting region. We focus only on inclination here because it is arguably the simplest to conceptualize, still suffices to explain many observed trends, and fits the observations whether the non-variable emission originates in an outflow from the BLR or ILR. Ideally, we would like to use direct orientation measurements to corroborate our interpretation that the C iv profile changes are a result of an orientation-dependence of the non-variable emission. Unfortunately, such orientation measurements are scarce.
The most promising methods use radio morphology (e.g. Brotherton, 1996; Vestergaard et al., 2000; Jarvis & McLure, 2006; Fine et al., 2011) or NLR kinematics (see, e.g., Fischer et al., 2010, 2011). As mentioned above, past radio studies may be biased by typically only using the FWHM, and these studies should be revisited (though see Vestergaard et al., 2000, who find the strongest C iv orientation dependence using the full width at peak intensity, which would be less susceptible to contamination from the non-variable core). NGC 3783 and NGC 4151, two objects in our RM sample, have been targeted for NLR kinematical modeling to determine orientation. The best-fit models indicate an inclination of only away from the LOS for NGC 3783 (T. Fischer, priv. comm.; Fischer et al. in prep) and for NGC 4151, near the maximum expected for a Type 1 spectrum (Das et al., 2005). Putting the relative strength of the non-variable core observed in each of these objects in Figure 3 in context to these independent orientation estimates seems to support our expectations that we are observing NGC 3783 and NGC 4151 at relatively low and high inclination, respectively.
6. Summary and Conclusion
We have investigated sources for the large observed scatter between C iv- and H-based single-epoch AGN black hole masses. Our primary line of investigation was to return to the assumptions on which SE BH masses are based by comparing the C iv profiles in the mean and rms spectra from reverberation mapping experiments. These include the requirement that the velocity width of the mean, or SE profile be a reasonable representation of the rms profile width — the velocity profile corresponding to emission from reverberating gas. We found that the SE or mean C iv emission-line profiles often have a non-variable low-velocity core component and/or blue excess that does not appear in the rms profiles and therefore does not reverberate. The presence of these non-variable components in the SE C iv profiles are biasing C iv-based BH mass determinations.
We developed an empirical correction for this bias, applicable to FWHM-based C iv masses by using the observed characteristics of the C iv profile, which we parameterize through the ratio, , of the C iv FWHM to . After applying this empirical “shape” correction to the FWHM-based C iv SE BH masses in a sample of low- and high-redshift AGNs with both C iv and H mass estimates, we found that the scatter in the C iv-to-H mass residuals is reduced from 0.39 dex to 0.26 dex for this somewhat heterogeneous sample.
We then investigated the remaining scatter in the C iv-to-H mass ratio by looking at other possible sources. We concluded that data inhomogeneity, poor data quality, and independent biases in the H masses due to NLR emission and host galaxy starlight also contribute to the observed scatter. If we minimize these systematic problems, we found that we could further reduce the scatter in the C iv-to-H mass residuals to 0.22 dex. The significant additional decrease in this scatter as a result of applying individual shape correction factors to each smaller, more homogeneous sample suggests that a shape correction calibration determined from a highly homogeneous sample of both C iv and H-based SE masses may further reduce the mass residual scatter compared to that seen here. We are currently in the process of collecting such a sample of high , simultaneous observations of both the C iv and H emission line regions in a large sample of AGNs using the Xshooter spectrograph on the VLT (see e.g., Ho et al., 2012, for a comparatively smaller sample of such data).
Finally, we investigated whether the C iv shape trend could also be responsible for the mass–color correlation described by A11. We found only a weak correlation between with this UV-to-optical color term. However, this weak shape–color correlation had a similar slope but was actually tighter than the A11 mass–color correlation after removing the expected dependence of that correlation on , implying that the mass–color correlation is simply a manifestation of the C iv shape bias. We further supported this interpretation by demonstrating that the steep slope observed by A11 in the mass–color correlation largely disappears after applying the shape-correction defined in Equation (1) to the A11 FWHM-based masses.
Our shape parameterization of the C iv line profile and correction to the FWHM-based C iv masses was strictly empirical in construction, and not altogether dissimilar from some previous studies (e.g., Baskin & Laor, 2005). However, the additional results gleaned from the reverberation database of mean and rms C iv spectra led to the discovery that the observed range of SE C iv line shapes correlates with the presence of and object-to-object differences in a non-variable emission component. The physical interpretation we suggest could explain the observed differences in this non-variable component is via orientation-dependent sight-lines of a (largely) polar outflow. The SE C iv emission-line profile predictions from such a model (peaky in more edge-on sources, boxy and blue-shifted in more face-on sources) explains the distribution of observed SE profiles as composites of both the reverberating BLR emission and “contamination” from the orientation-dependent non-variable outflow component. This contamination biases the velocity width measured in the SE spectrum relative to the intrinsic velocity dispersion of the reverberating gas, thus biasing SE mass estimates.
The radial origin of such an outflow remains an unanswered question, however. Profile and velocity width comparisons of this non-variable component with the [O iii] 5007 emission line suggest it must be arising from closer in than the extended NLR probed by integrated forbidden line emission. However, it is difficult without further observations and advances in modeling to conclude whether the outflowing gas producing the non-variable C iv emission originates in an inner BLR disk-wind, the intermediate line region, aka, high-velocity inner extension of the traditional NLR, or even a combination of the two. At present, we show no preference as to what that origin may be. Certainly an origin in the intermediate line region produces natural mechanisms to explain the lack of variability of this component (spatial damping) and the orientation-dependence (collimation in a biconical outflow). Plus, spatially resolved biconical outflows have been shown to exist on these scales. On the other hand, such an outflow must be launched from somewhere within the unresolved nucleus. Models seem to favor the inner (high-ionization) regions of the BLR or outer accretion disk for the ultimate source of AGN outflows/winds, but the orientation-dependence of such a wind is, at present, model-dependent.
Future observational studies could potentially constrain the physical origin of this component by studying any potential time dependence of the equivalent width and velocity profile of this component. For example, gross changes in the broad emission-line profile are observed to exist over dynamical time scales for the size of the BLR (see, e.g., Sergeev et al., 2007). So, while we have concluded that this outflow component does not reverberate, if the origin of this component is from an intermediate line region, variability may still be expected on much longer time scales than a single reverberation campaign. If present, a measure of this variability time scale could put a constraint on the location of this emitting region. On the other hand, if the emission is originating in an optically thin wind close to the central source, changes in the amplitude of emission may be expected with changes in the AGN luminosity state. As the ionizing continuum luminosity increases and the ionization front moves outward, we may expect an increase the equivalent width of this emission because the volume and temperature of the ionized gas will also increase.
Regardless of the physical origin, this non-variable component is likely present in some strength and form in all SE C iv emission lines, and we have shown it to be a large, but correctable, source of systematic bias in C iv-based SE BH mass estimates. While we suggest the possibility that the profile of this non-variable component is orientation dependent, more sophisticated models of the BLR and AGN central engines (cf. the models of Chiang & Murray, 1996; Murray & Chiang, 1997; Proga et al., 2000; Proga & Kallman, 2004; Ohsuga & Mineshige, 2011; Proga et al., 2012) taking into account not only orientation, but also photoionization physics, kinematics, geometry, and even radiation pressure are needed. Such models will help us to better understand the full complexity and origin of the C iv emission (both reverberating and non-reverberating) as well as other observed AGN properties. Quasar evolution and/or SED and changes with luminosity could also affect the relationship between the variable and non-variable C iv emission components. Such changes could be independent of orientation and/or lead to different orientation dependencies as a function of these parameters, if, for instance, these physical properties effect the bicone opening angle or the driving mechanism for AGN outflows. If such models and/or additional observational tests can corroborate inclination as the source or at least a large contributor to the differences in the observed C iv profiles and for either all or even particular samples of AGNs, having an inclination indicator as simple as the observed SE C iv profile could be a very powerful tool for better understanding the physics of AGNs and reducing systematics in both SE and RM masses.
As an interesting side note, if a source of this non-variable C iv emission is a BLR disk-wind, we may also consider the possibility that the non-variable, high-velocity wings of H that disappear in rms spectra and have also been potentially attributed to emission from optically-thin gas (see discussion by Korista & Goad, 2004), may also be from this same BLR wind component. H is emitted from larger BLR radii than C iv, so it may only be the very highest velocities of H-emitting gas that are affected by this wind component, particularly as it has been theorized to be launched from the inner BLR.
In the end, however, the rms spectra derived from reverberation mapping campaigns are the only guaranteed means by which to directly probe the uncontaminated, variable profile most relevant for determining accurate black hole masses and to decompose the non-variable component by which we can study its origin. Therefore, more reverberation mapping experiments targeting objects across the full observed distribution of SE C iv profiles as well as multiple epochs for individual objects are needed (1) to expand the sample of C iv mean and rms spectra, (2) to form a more robust C iv shape correction, and (3) to better understand the extent and physical origin of this non-variable component and the bias it imposes on C iv-based BH mass estimates. Furthermore, these programs must also probe larger AGN luminosities and higher redshifts so that results can more directly be applied to the typical quasar populations observed in surveys. Currently, our only option is to extend what has been learned for the relatively, low-luminosity, local Seyfert sample presented here. However, it is imperative for our understanding of galaxy evolution to directly test what systematics, if any, we are introducing by extending results from these local investigations to AGNs at higher redshifts, luminosities, and even in potentially different evolutionary states.
References
- Assef et al. (2012) Assef, R. J., Frank, S., Grier, C. J., Kochanek, C. S., Denney, K. D., & Peterson, B. M. 2012, ApJ, 753, L2
- Assef et al. (2011) Assef, R. J., et al. 2011, ApJ, 742, 93
- Baldwin et al. (1995) Baldwin, J., Ferland, G., Korista, K., & Verner, D. 1995, ApJ, 455, L119
- Baldwin (1977) Baldwin, J. A. 1977, ApJ, 214, 679
- Baskin & Laor (2005) Baskin, A., & Laor, A. 2005, MNRAS, 356, 1029
- Bentz et al. (2009a) Bentz, M. C., Peterson, B. M., Netzer, H., Pogge, R. W., & Vestergaard, M. 2009a, ApJ, 697, 160
- Bentz et al. (2006) Bentz, M. C., Peterson, B. M., Pogge, R. W., Vestergaard, M., & Onken, C. A. 2006, ApJ, 644, 133
- Bentz et al. (2007) Bentz, M. C., et al. 2007, ApJ, 662, 205
- Bentz et al. (2009b) —. 2009b, ApJ, 705, 199
- Blandford & McKee (1982) Blandford, R. D., & McKee, C. F. 1982, ApJ, 255, 419
- Borguet & Hutsemékers (2010) Borguet, B., & Hutsemékers, D. 2010, A&A, 515, A22
- Brotherton (1996) Brotherton, M. S. 1996, ApJS, 102, 1
- Brotherton et al. (2006) Brotherton, M. S., De Breuck, C., & Schaefer, J. J. 2006, MNRAS, 372, L58
- Brotherton et al. (1994) Brotherton, M. S., Wills, B. J., Francis, P. J., & Steidel, C. C. 1994, ApJ, 430, 495
- Bruni et al. (2012) Bruni, G., et al. 2012, A&A, 542, A13
- Chiang & Murray (1996) Chiang, J., & Murray, N. 1996, ApJ, 466, 704
- Clavel et al. (1991) Clavel, J., et al. 1991, ApJ, 366, 64
- Collin et al. (2006) Collin, S., Kawaguchi, T., Peterson, B. M., & Vestergaard, M. 2006, A&A, 456, 75
- Collins et al. (2005) Collins, N. R., Kraemer, S. B., Crenshaw, D. M., Ruiz, J., Deo, R., & Bruhweiler, F. C. 2005, ApJ, 619, 116
- Crenshaw & Kraemer (2007) Crenshaw, D. M., & Kraemer, S. B. 2007, ApJ, 659, 250
- Crenshaw et al. (2010) Crenshaw, D. M., Kraemer, S. B., Schmitt, H. R., Jaffé, Y. L., Deo, R. P., Collins, N. R., & Fischer, T. C. 2010, AJ, 139, 871
- Croom (2011) Croom, S. M. 2011, ApJ, 736, 161
- Das et al. (2005) Das, V., et al. 2005, AJ, 130, 945
- Denney et al. (2009) Denney, K. D., Peterson, B. M., Dietrich, M., Vestergaard, M., & Bentz, M. C. 2009, ApJ, 692, 246
- Denney et al. (2010) Denney, K. D., et al. 2010, ApJ, 721, 715
- Elvis (2000) Elvis, M. 2000, ApJ, 545, 63
- Elvis (2012) —. 2012, Conference proceedings for ”AGN Winds in Charleston” (Charleston, SC; 15-18 Oct. 2011). To be published by ASP; ArXiv:1201.3520
- Eracleous & Halpern (1994) Eracleous, M., & Halpern, J. P. 1994, ApJS, 90, 1
- Eracleous et al. (2009) Eracleous, M., Lewis, K. T., & Flohic, H. M. L. G. 2009, New A Rev., 53, 133
- Ferland & Osterbrock (1986) Ferland, G. J., & Osterbrock, D. E. 1986, ApJ, 300, 658
- Ferrarese & Ford (2005) Ferrarese, L., & Ford, H. 2005, Space Science Reviews, 116, 523
- Ferrarese & Merritt (2000) Ferrarese, L., & Merritt, D. 2000, ApJ, 539, L9
- Fine et al. (2010) Fine, S., Croom, S. M., Bland-Hawthorn, J., Pimbblet, K. A., Ross, N. P., Schneider, D. P., & Shanks, T. 2010, MNRAS, 409, 591
- Fine et al. (2011) Fine, S., Jarvis, M. J., & Mauch, T. 2011, MNRAS, 412, 213
- Fischer et al. (2011) Fischer, T. C., Crenshaw, D. M., Kraemer, S. B., Schmitt, H. R., Mushotsky, R. F., & Dunn, J. P. 2011, ApJ, 727, 71
- Fischer et al. (2010) Fischer, T. C., Crenshaw, D. M., Kraemer, S. B., Schmitt, H. R., & Trippe, M. L. 2010, AJ, 140, 577
- Gallagher et al. (2005) Gallagher, S. C., Richards, G. T., Hall, P. B., Brandt, W. N., Schneider, D. P., & Vanden Berk, D. E. 2005, AJ, 129, 567
- Gaskell (1982) Gaskell, C. M. 1982, ApJ, 263, 79
- Gebhardt et al. (2000) Gebhardt, K., et al. 2000, ApJ, 539, L13
- Ghosh & Punsly (2007) Ghosh, K. K., & Punsly, B. 2007, ApJ, 661, L139
- Graham (2007) Graham, A. W. 2007, MNRAS, 379, 711
- Graham et al. (2011) Graham, A. W., Onken, C. A., Athanassoula, E., & Combes, F. 2011, MNRAS, 412, 2211
- Greene et al. (2010) Greene, J. E., Peng, C. Y., & Ludwig, R. R. 2010, ApJ, 709, 937
- Grier et al. (2012a) Grier, C. J., et al. 2012a, ApJ, 755, 60
- Grier et al. (2012b) —. 2012b, ApJ, 744, L4
- Gültekin et al. (2009) Gültekin, K., et al. 2009, ApJ, 698, 198
- Hamann et al. (2011) Hamann, F., Kanekar, N., Prochaska, J. X., Murphy, M. T., Ellison, S., Malec, A. L., Milutinovic, N., & Ubachs, W. 2011, MNRAS, 410, 1957
- Hamann et al. (1993) Hamann, F., Korista, K. T., & Morris, S. L. 1993, ApJ, 415, 541
- Ho et al. (2012) Ho, L. C., Goldoni, P., Dong, X.-B., Greene, J. E., & Ponti, G. 2012, ApJ, 754, 11
- Jarvis & McLure (2006) Jarvis, M. J., & McLure, R. J. 2006, MNRAS, 369, 182
- Kaspi et al. (2007) Kaspi, S., Brandt, W. N., Maoz, D., Netzer, H., Schneider, D. P., & Shemmer, O. 2007, ApJ, 659, 997
- Kaspi et al. (2005) Kaspi, S., Maoz, D., Netzer, H., Peterson, B. M., Vestergaard, M., & Jannuzi, B. T. 2005, ApJ, 629, 61
- Kollmeier et al. (2006) Kollmeier, J. A., et al. 2006, ApJ, 648, 128
- Korista & Goad (2004) Korista, K. T., & Goad, M. R. 2004, ApJ, 606, 749
- Korista et al. (1995) Korista, K. T., et al. 1995, ApJS, 97, 285
- Kraemer et al. (2007) Kraemer, S. B., Bottorff, M. C., & Crenshaw, D. M. 2007, ApJ, 668, 730
- Kraemer et al. (2000) Kraemer, S. B., Crenshaw, D. M., Hutchings, J. B., Gull, T. R., Kaiser, M. E., Nelson, C. H., & Weistrop, D. 2000, ApJ, 531, 278
- Kraemer et al. (2009) Kraemer, S. B., Trippe, M. L., Crenshaw, D. M., Meléndez, M., Schmitt, H. R., & Fischer, T. C. 2009, ApJ, 698, 106
- Kriss et al. (1992) Kriss, G. A., Davidsen, A. F., Blair, W. P., Ferguson, H. C., & Long, K. S. 1992, ApJ, 394, L37
- Leighly & Moore (2004) Leighly, K. M., & Moore, J. R. 2004, ApJ, 611, 107
- MacLeod et al. (2010) MacLeod, C. L., et al. 2010, ApJ, 721, 1014
- Marconi & Hunt (2003) Marconi, A., & Hunt, L. K. 2003, ApJ, 589, L21
- McGill et al. (2008) McGill, K. L., Woo, J.-H., Treu, T., & Malkan, M. A. 2008, ApJ, 673, 703
- McLure & Dunlop (2004) McLure, R. J., & Dunlop, J. S. 2004, MNRAS, 352, 1390
- McLure & Jarvis (2002) McLure, R. J., & Jarvis, M. J. 2002, MNRAS, 337, 109
- Metzroth et al. (2006) Metzroth, K. G., Onken, C. A., & Peterson, B. M. 2006, ApJ, 647, 901
- Murray & Chiang (1997) Murray, N., & Chiang, J. 1997, ApJ, 474, 91
- Murray et al. (1995) Murray, N., Chiang, J., Grossman, S. A., & Voit, G. M. 1995, ApJ, 451, 498
- Nelson et al. (2000) Nelson, C. H., Weistrop, D., Hutchings, J. B., Crenshaw, D. M., Gull, T. R., Kaiser, M. E., Kraemer, S. B., & Lindler, D. 2000, ApJ, 531, 257
- Netzer et al. (2007) Netzer, H., Lira, P., Trakhtenbrot, B., Shemmer, O., & Cury, I. 2007, ApJ, 671, 1256
- O’Brien et al. (1998) O’Brien, P. T., et al. 1998, ApJ, 509, 163
- Ohsuga & Mineshige (2011) Ohsuga, K., & Mineshige, S. 2011, ApJ, 736, 2
- Onken et al. (2004) Onken, C. A., Ferrarese, L., Merritt, D., Peterson, B. M., Pogge, R. W., Vestergaard, M., & Wandel, A. 2004, ApJ, 615, 645
- Onken & Kollmeier (2008) Onken, C. A., & Kollmeier, J. A. 2008, ApJ, 689, L13
- Park et al. (2011) Park, D., et al. 2012, ApJ, 747, 30
- Peterson (1993) Peterson, B. M. 1993, PASP, 105, 247
- Peterson (2010) —. 2010, IAU Symposium, 267, 151
- Peterson & Wandel (2000) Peterson, B. M., & Wandel, A. 2000, ApJ, 540, L13
- Peterson et al. (2004) Peterson, B. M., et al. 2004, ApJ, 613, 682
- Peterson et al. (2005) —. 2005, ApJ, 632, 799
- Proga & Kallman (2004) Proga, D., & Kallman, T. R. 2004, ApJ, 616, 688
- Proga et al. (2012) Proga, D., Rodríguez Hidalgo, P., & Hamann, F. 2012, ArXiv:1201.3606
- Proga et al. (2000) Proga, D., Stone, J. M., & Kallman, T. R. 2000, ApJ, 543, 686
- Rafiee & Hall (2011) Rafiee, A., & Hall, P. B. 2011, MNRAS, 415, 2932
- Reeves et al. (2009) Reeves, J. N., O’Brien, P. T., Braito, V., Behar, E., Miller, L., Turner, T. J., Fabian, A. C., Kaspi, S., Mushotzky, R., & Ward, M. 2009, ApJ, 701, 493
- Reichard et al. (2003) Reichard, T. A., et al. 2003, AJ, 126, 2594
- Reichert et al. (1994) Reichert, G. A., et al. 1994, ApJ, 425, 582
- Richards et al. (2002) Richards, G. T., Vanden Berk, D. E., Reichard, T. A., Hall, P. B., Schneider, D. P., SubbaRao, M., Thakar, A. R., & York, D. G. 2002, AJ, 124, 1
- Richards et al. (2011) Richards, G. T., et al. 2011, AJ, 141, 167
- Rodriguez-Pascual et al. (1997) Rodriguez-Pascual, P. M., et al. 1997, ApJS, 110, 9
- Sergeev et al. (2007) Sergeev, S. G., Doroshenko, V. T., Dzyuba, S. A., Peterson, B. M., Pogge, R. W., & Pronik, V. I. 2007, ApJ, 668, 708
- Shen et al. (2008) Shen, Y., Greene, J. E., Strauss, M. A., Richards, G. T., & Schneider, D. P. 2008, ApJ, 680, 169
- Shen & Liu (2012) Shen, Y., & Liu, X. 2012, ApJ, 753, 125
- Shen et al. (2011) Shen, Y., et al. 2011, ApJS, 194, 45
- Sulentic et al. (2007) Sulentic, J. W., Bachev, R., Marziani, P., Negrete, C. A., & Dultzin, D. 2007, ApJ, 666, 757
- Tremaine et al. (2002) Tremaine, S., et al. 2002, ApJ, 574, 740
- Vestergaard et al. (2011) Vestergaard, M., Denney, K., Fan, X., Jensen, J. J., Kelly, B. C., Osmer, P. S., Peterson, B. M., & Tremonti, C. A. 2011, in Narrow-Line Seyfert 1 Galaxies and their Place in the Universe
- Vestergaard & Osmer (2009) Vestergaard, M., & Osmer, P. S. 2009, ApJ, 699, 800
- Vestergaard & Peterson (2006) Vestergaard, M., & Peterson, B. M. 2006, ApJ, 641, 689
- Vestergaard et al. (2000) Vestergaard, M., Wilkes, B. J., & Barthel, P. D. 2000, ApJ, 538, L103
- Wanders et al. (1997) Wanders, I., et al. 1997, ApJS, 113, 69
- Wang et al. (2011) Wang, H., Wang, T., Zhou, H., Liu, B., Wang, J., Yuan, W., & Dong, X. 2011, ApJ, 738, 85
- Wang et al. (2009) Wang, J., Dong, X., Wang, T., Ho, L. C., Yuan, W., Wang, H., Zhang, K., Zhang, S., & Zhou, H. 2009, ApJ, 707, 1334
- Wilkes (1984) Wilkes, B. J. 1984, MNRAS, 207, 73
- Wills et al. (1993) Wills, B. J., Brotherton, M. S., Fang, D., Steidel, C. C., & Sargent, W. L. W. 1993, ApJ, 415, 563
- Woo et al. (2010) Woo, J., et al. 2010, ApJ, 716, 269
- Zhang et al. (2008) Zhang, K., Wang, T., Dong, X., & Lu, H. 2008, ApJ, 685, L109
- Zheng et al. (2008) Zheng, W., Wang, J.-X., Kriss, G. A., Sahnow, D., Allen, M., Dopita, M., Tsvetanov, Z., & Bicknell, G. 2008, ApJ, 686, 881
- Zhou et al. (2006) Zhou, H., Wang, T., Wang, H., Wang, J., Yuan, W., & Lu, Y. 2006, ApJ, 639, 716