X-ray Observations of INTEGRAL Discovered Cataclysmic Variable IGR J17195-4100
Abstract
We present analysis of archival X-ray data obtained with the XMM-Newton and Suzaku for a new Intermediate Polar identified as a counterpart of an INTEGRAL discovered -ray source, IGR J17195-4100. We report a new period of 1053.712.2 s in X-rays. A new binary orbital period of 3.52 h is strongly indicated in the power spectrum of the time series. An ephemeris of the new period proposed as the spin period of the system has also been obtained. The various peaks detected in the power spectrum suggest a probable disc-less accretion system. The soft X-rays (3 keV) dominate the variability seen in the X-ray light curves. The spin modulation shows energy dependence suggesting the possibility of a variable partial covering accretion column. The averaged spectral data obtained with XMM-Newton EPIC cameras show a multi temperature spectra with a soft excess. The latter can be attributed to the varying coverage of accretion curtains.
keywords:
binaries; close; stars: novae,cataclysmic variables; X-rays:binaries; stars: individual: IGR17195-41001 Introduction
Cataclysmic variables (CVs) are interacting binaries with a white dwarf accreting matter from a main sequence companion star through a Roche lobe, with a typical orbital period of few hours (see Warner, 1995 for a review). Many of the CVs have high magnetic fields and are called as magnetic CVs (mCVs). The mCVs are further classified as polars (see Cropper, 1990), and Intermediate polars (IPs; see Patterson 1994,Hellier 1996) based on the strength of the observed magnetic fields in them. Polars have very high magnetic fields (10-80 MG) which do not allow the formation of accretion discs, but help to synchronise the spin and orbital periods to a very high degree. Intermediate polars have somewhat less magnetic fields compared to polars ( 10 MG) but sufficient to disrupt the accretion disc and truncate it at a certain distance from the white dwarf. The IPs typically have a spin period of few hundreds of seconds and orbital periods of few hours and many IPs cluster around a Pspin/Porb 0.05 - 0.15 (Norton et al., 2004). The accreting matter in both polars and IPs falls on to the white dwarf through poles along the magnetic field lines. A few IPs show disc-less accretion, and in some cases accretion stream is seen to flip between the two poles as was first reported in V2400 Oph by Buckley et al. (1997). Generally the IPs are hard X-ray emitters. However, many IPs also show a soft X-ray excess typically of a blackbody component in soft X-rays (Evans & Hellier 2007, de Martino et al. 2008, Anzolin et al. 2009). The soft blackbody component in IPs is usually attributed to the presence of accretion curtains (Evans & Hellier, 2007).
The INTEGRAL/IBIS soft Gamma-ray survey (Barlow et al., 2006; Bird et al., 2007) has detected a total of 32 CVs till now which is close to 10 per cent of INTEGRAL detections. These detections are identified mainly with mCVs with 22 confirmed or probable IPs and three polars. IGR J17195-4100 (IGR1719 hereafter) was detected as a source in INTEGRAL observations by Bird et al. (2004) and was later identified with an optical object of Rmag 14.3 mag and classified as an IP by Masetti et al. (2006) based on its optical spectrum. Butters et al. (2008) reported candidate periods of 1842.41.5 s and 2645.04.0 s in IGR1719 based on RXTE observations, whereas a spin period of 18.99250.0006 min (1139.550.04 s) and an orbital period of 4.0050.006 h were reported by Pretorius (2009) from high speed optical photometry. Masetti et al. (2006) determined the distance of IGR1719 close to 110 pc assuming an absolute magnitude MV 9. The X-ray luminosity of the IP as given by Masetti et al. (2006) is 3.61031 erg s-1 in the 0.5-10.0 keV energy range and 5.51031 erg s-1 in the 20-100 keV energy range. Yuasa et al. (2010) analyzed wide-band Suzaku spectra of seventeen IPs with IGR1719 being one of them. The mass, shock temperature and spectral parameters were derived by fitting the X-ray spectra with numerically calculated emission models and the mass of the white dwarf in IGR1719 was estimated as 1.03 M⊙ (Yuasa et al., 2010).
2 Observations and Data Analysis
XMM-Newton observatory (Jansen et al., 2001) observed IGR1719 on 2009 September 3 for a total of 33.6 ks (Obs ID 0601270201). The observations were continuous and taken with the three instruments EPIC-MOS1, MOS2 and pn (Turner et al. 2001 and Strüder et al. 2001) which provide medium resolution spectroscopy in the energy range of 0.2-12.0 keV. We used the latest Science Analysis Software (SAS) version 11.0 software package for data reduction and extraction of lightcurves and generation of spectral products. The temporal and spectral analyses were carried out using XRONOS and XSPEC version 12.7 (Arnaud, K.A., 1996; Dorman & Arnaud, 2001) packages provided in heasoft (Version 6.11).
Suzaku (Mitsuda et al., 2007), the fifth Japanese X- ray astrophysical observatory, observed IGR1719 on 2009 February 18-19 for a total of 73 ks. Suzaku observes in the energy range of 0.2-600 keV with the help of two instruments, X-ray Imaging Spectrometer (XIS; Koyama et al., 2007) and the Hard X-ray Detector (HXD; Takahashi et al., 2007). The XIS consists of four X-ray imaging charge coupled device (CCD) cameras at the focal plane of each of the four X-ray Telescopes (XRT; Serlemitsos et al., 2007). The energy coverage of XIS is similar to the XMM-Newton energy range of 0.2-12.0 keV. The XIS2 camera stopped working near the end of 2006, and therefore we use the data only from the remaining three XIS cameras (XIS0, XIS1 and XIS3). The Suzaku observations of IGR1719 were analysed with the latest heasoft tools and CALDB version 3.1. A log of the observations of IGR1719 is given in Table 1.
| Observatory | Instrument | Start Time | End Time | Exposurea | Count rate |
|---|---|---|---|---|---|
| (UT) | (UT) | (s) | (count s-1) | ||
| Suzaku | XIS | 2009-02-18 11:03:26 | 2009-02-19 07:27:20 | 73.4 (31.3) | 0.25 |
| XMM-Newton | MOS1 | 2009-09-03 06:35:37 | 2009-09-03 15:55:59 | 33.6 (33.6) | 1.62 |
| MOS2 | 2009-09-03 06:35:37 | 2009-09-03 15:56:05 | 33.6 (33.6) | 1.59 | |
| pn | 2009-09-03 06:57:59 | 2009-09-03 15:51:53 | 32.0 (32.0) | 2.55 |
The XMM-Newton data were filtered using the standard pipeline filter criteria and canned screening criteria using the SAS tool xmmselect to obtain cleaned events. A strict criteria of PATTERN=0 and FLAG=0 were used in addition to the standard screening criteria for further extraction and analyses of both the timing and spectral products. A light curve from the source free regions was extracted in the energy range of 8-12keV from the filtered data to check for flaring and no flaring activity was observed during the exposure time. Subsequently the filtered data-set were used in all the further analysis without any temporal filter. No pile-up was observed in the CCD during the observations. A circular region of 25′′ was used to extract the source light curve.
The energy spectra of the source and the background region were extracted separately from all the three EPIC cameras using the SAS task xmmselect. The source spectra were extracted from a circular region of radius 25′′, whereas the background spectra are extracted from a nearby source-free region from the same chip. Spectral energy responses were generated with rmfgen and arfgen tasks in SAS. Data from MOS1 and MOS2 were combined together and an effective spectral response was generated by combining the responses and effective areas of MOS1 and MOS2. The spectra were binned for a minimum of 50 counts per bin.
The Suzaku data were filtered using the xselect tool available in heasoft by applying the standard filtering criteria typically used for creating the cleaned event files. The light curves were extracted from a circular region with a radius 30′′ with a bin time of 1 s. The background was extracted from a nearby source free regions. The background subtracted light curves of IGR1719 taken from the three XIS cameras were summed together and subjected to timing analysis.
2.1 Timing Analysis
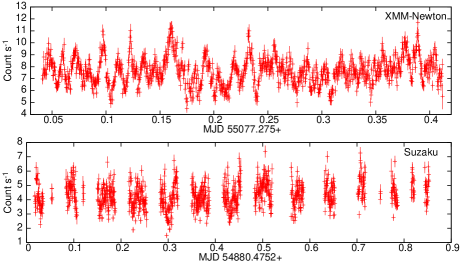
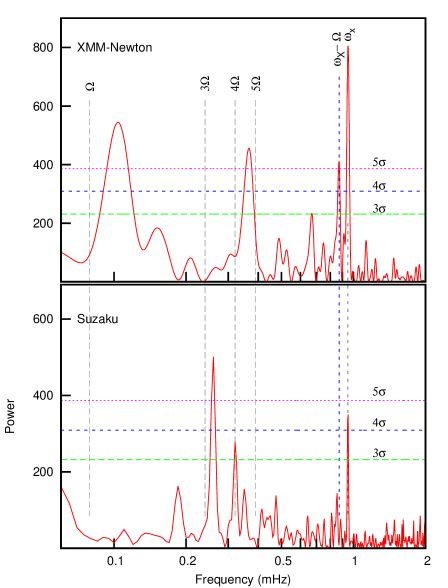
The background subtracted light curves obtained from the three EPIC cameras: MOS1, MOS2 and pn cameras in the energy range of 0.3-10.0 keV are summed and plotted in the top panel of Figure 1. Similarly, the X-ray light curve obtained from the Suzaku is shown in the bottom panel of Fig. 1. The light curves clearly show periodic intensity variations on a time-scale of 1000 s. The XMM-Newton light curves are continuous while those of Suzaku have gaps due to shadowing of the source by the Earth. We performed a Fourier Transform of the summed XMM-Newton light curve using powspec tool of FTOOLS package. The resulting FFT power spectrum is plotted in Figure 2 (top panel). The highest power in the XMM-Newton data corresponds to a frequency of = 0.9490.011 mHz (1053.712.2 s, Sinusoid amplitude, As = 28.4 count s-1).
The error quoted here corresponds errors derived from full width at half the maximum (FWHM) of the peak. (FWHM 2.35 for normal distribution). To identify the significant peaks, we calculated the standard deviation of the power spectrum from 0.0-4 mHz. As a conservative approach, we included the power in all the peaks for calculating standard deviation () after removing the contribution of the highest peak in the spectrum. The different significance levels are shown as horizontal lines in Fig. 2. There are three more peaks above 5 level at frequencies 0.1040.027 mHz (9624.32498.6 s, As=23.7 count s-1), 0.3660.018 mHz (2732.2134.4 s, As=21.3 count s-1) and 0.8700.012 mHz (1149.415.8 s, As = 20.3 count s-1) respectively in the XMM-Newton data. A peak very close to 3 level at 0.67030.032 mHz (149229 s, As = 15.3 count s-1) is also seen. A similar periodogram of Suzaku XIS lightcurve was obtained and it also showed several peaks. However, that periodogram is strongly affected by aliasing due to gaps in the Suzaku data and is therefore not shown here. To remove the effects of the gaps in the light curve, we obtained a CLEAN periodogram (Roberts, Lehár & Dreher, 1987) of XIS data, and this is shown in Fig. 2 (bottom panel). Since the effects of the windowing of the data are removed, we assume the peaks seen in Fig. 2 as real. The amplitudes and the probable identification of all the significant peaks above 3 seen in Fig. 2 are listed in Table 2.
| Absolute power (count s-1)2 | |||||||||||
| XMM-Newton (MOS+pn) | Suzaku | ||||||||||
| Frequency‡ | Period | ID† | 0.3-10 | 0.3-1.0 | 1.0-3.0 | 3.0-10.0 | 0.3-10 | 0.3-1.0 | 1.0-3.0 | 3.0-10.0 | |
| (mHz) | (s) | (keV) | (keV) | (keV) | (keV) | (keV) | (keV) | (keV) | (keV) | ||
| 0.185 0.007 | 5405 193 | 2 | … | … | … | … | 163.9 | 18.8 | 230.5 | 177.1 | |
| 0.260 0.006 | 3845 89 | 3 | … | … | … | … | 501.2 | 34.3 | 239.5 | 272.8 | |
| 0.320 0.006 | 3125 59 | 4 | … | … | … | … | 278.4 | 36.7 | 139.1 | 174.9 | |
| 0.366 0.018 | 2732 134 | 5 | 455.1 | 156.9 | 315.1 | 132.5 | … | … | 150.4 | 108.0 | |
| 0.670 0.013 | 1492 29 | 9 | 235.0 | 80.4 | 106.6 | 55.9 | … | ||||
| 0.870 0.012 | 1149 16 | 411.9 | 180.6 | 267.5 | 56.6 | 145.0 | 65.2 | 56.2 | 65.0 | ||
| 0.949 0.011 | 1054 12 | 804.8 | 391.1 | 623.6 | 351.2 | 105.9 | 444.7 | 83.2 | |||
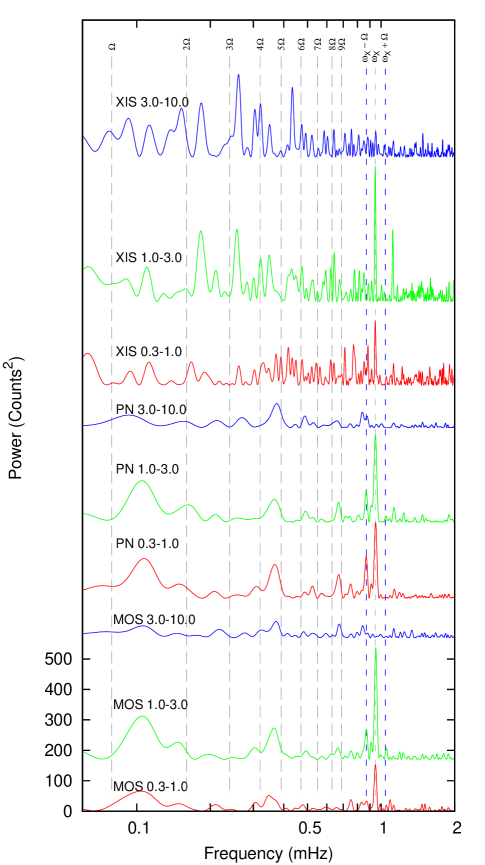
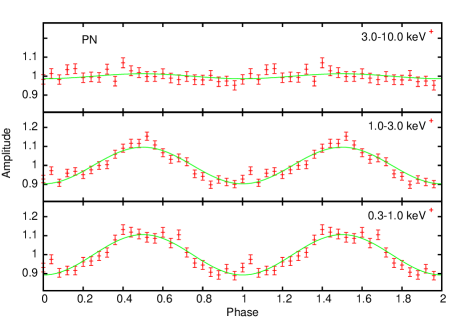
The energy spectra of IGR1719, discussed in a later section (§2.2), suggest a probable soft X-ray excess in the energy range of 0.3 to 1.0 keV. To look for a possible connection of the soft X-ray excess with the white dwarf itself, we extracted three light curves in the energy ranges of 0.3-1.0 keV, 1.0-3.0 keV and 3.0-10.0 keV respectively from the source and background regions in the XMM-Newton using the standard SAS tools and obtained the power spectra with the help of powspec. The power spectra of the pn and summed MOS data are plotted in Figure 3. Similarly the CLEAN periodogram obtained from the Suzaku data are also shown in Figure 3. From these figures, it is clearly seen that the variability is present in all the energy bands, though the amplitude is changing with energy.
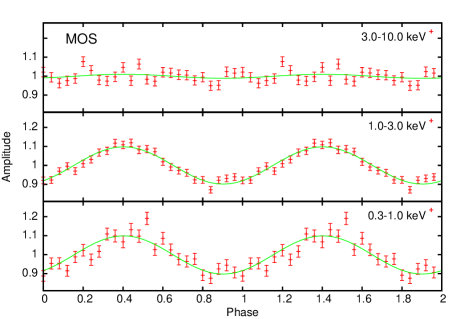
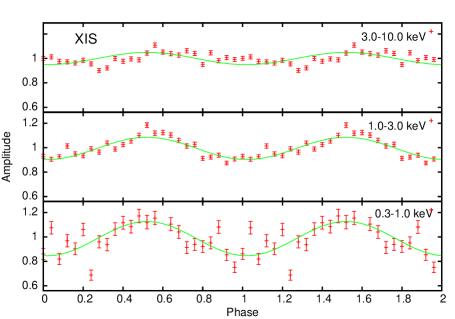
Light curves of the combined EPIC MOS1 and MOS2 data were folded at the most significant period of 1053.7 s (Fig. 3) at different energies, and the folded light curves are shown in Figure 4 top panel. Similarly, we did a period folding of the pn-data and XIS data and show it in the middle and the lower panel of Fig. 4 respectively. The solid lines in all the panels correspond to a simple sinusoid fit to the folded data. A sinusoid variability is clearly evident in the soft energy bands viz. 0.1-1.0 keV and 1.0-3.0 keV while it is barely seen in the hard X-ray band of 3.0-10.0 keV of IGR1719 .
Epoch Estimation: To estimate the ephemeris of the most prominent peak identified in the power spectra of IGR1719, we folded the combined XIS lightcurve at a period of 1053.7 s using efold with the integer part of Suzaku observation (2009:09:03) as the guess epoch. The folded lightcurve is fitted with a sine curve to obtain the initial phase. The initial guess value of the epoch is corrected for the phase difference and the exercise is repeated for the combined XMM-Newton lightcurve using the corrected epoch obtained from Suzaku data to estimate the quadrature co-efficient. Using this method we fix the ephemeris corresponding to the flux maxima of IGR1719 of the highest peak seen in Fig. 2 as
2.2 X-ray Spectral Analysis
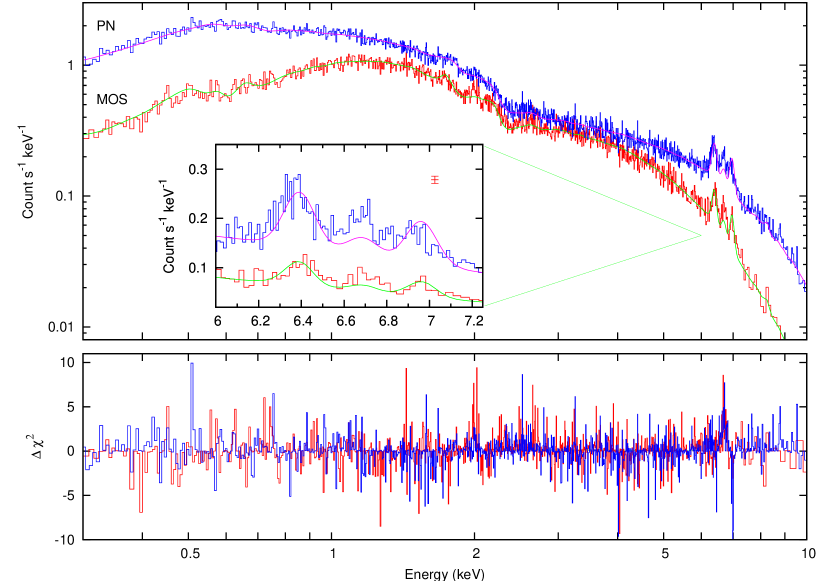
The background subtracted XMM-Newton spectra of IGR1719 are shown as histogram in Figure 5. Strong broad continuum extending to very hard X-rays along with some emission line features can be seen in the spectra at 6.4, 6.7 and 6.9 keV. Spectral fits were performed using XSPEC to fit the EPIC/pn and the combined MOS spectral data with various standard models given below. All the models include a common ISM absorption component (phabs). A constant multiplicative term is also used for the combined fits to correct for the relative normalization difference between the MOS and the pn data. The best fitting normalization for the pn data consistently required a factor of 1.11 to the normalization irrespective of the models used below. The hydrogen column density (NH,ISM) in the phabs model is left as a free parameter in all the fits.
Several spectral models were tried to obtain a fit to the observed spectral data. All the models used and their best fitting values are given in Table 3. A single component bremsstrahlung or black body temperature models produced unacceptable fits to the IGR1719 spectra with 3.0. A single component plasma emission model (apec ) also yielded an unacceptable of 2.4 (dof: 1882) with the temperature kTapec pegged at 64 keV. The apec plasma model however, predicts several emission lines due to collisional ionization in a hot thin plasma but is not able to account for the 6.4 keV line which is most likely due to fluorescence of cold iron. Hence, a Gaussian line centered at 6.4 keV and with a fixed width of 0.02 keV is added to the apec model resulting in an improved but still un-acceptable of 1.99 (dof: 1879). The apec temperature is still pegged at 64 keV. A partial covering absorption by neutral material seen in many mCVs (Yuasa et al., 2010) was then added to the apec + gauss model and it gives an improved of 1.20 (dof: 1877). The best fitting value of the partial absorber hydrogen column density is 7.41022 cm-2 with a covering fraction of 442 per cent and the apec temperature is 19.1 keV.
Though the apec + gauss models give a better fit and a realistic shock temperature, there is still an unexplained excess seen around 0.5 keV, in the form of several unresolved lines. Therefore, a low temperature apec component was found to be more suitable than a blackbody to improve the chi-square. Spectral fits with an additional blackbody component, usually present in some IPs, were also tried but yielded no improvement in the chi-square. To account for the excess emission around 0.5 keV, we tried two additional models: (a) a low energy apec, and (b) a narrow Gaussian, which gave values of 1.02 (dof: 1875) and 1.04 (dof: 1874) respectively (see, Table 3). The best fitting NH,ISM value converges to 1.120.021021 cm-2 for all the models.
| Model | pcf(apec) | pcf(apec) | pcf(apec) | pcf(apec) | pcf(mkcflow) | pcf(mkcflow) | pcf(mkcflow) |
|---|---|---|---|---|---|---|---|
| Parameter | +Fe line | +Fe line+ga | apec + Fe line | + Fe line | +Fe line+ga | +apec+Fe line | |
| (dof) | 1.35 (1879) | 1.20 (1877) | 1.04 (1874) | 1.02 (‘875) | 1.16(1876) | 1.00 (1874) | 0.97 (1875) |
| aNH,ISM | 80 2 | 80 2 | 98 4 | 112 2 | 76 2 | 883 | 112 2 |
| cm-2 | |||||||
| bNH,pcf | 8.4 | 7.4 | 8.4 | 8.7 | 6.2 | 6.8 | 7.3 |
| cm-2 | |||||||
| cpcffrac | 46 2 | 44 2 | 46 | 46 | 40 2 | 41 | 40 |
| % | |||||||
| Abundance | 0.51 | 0.56 | 0.52 | 0.52 | 0.92 | 0.85 | 0.84 |
| () | |||||||
| dkTapec/mkcf | 19.8 | 19.1 | 18.7 | 16.0 | 4.6 | 4.4 | 3.9 |
| (keV) | |||||||
| kTapec2 | … | … | … | 176.4 | … | … | 174.8 |
| (eV) | |||||||
| Eq Width | … | 134.6 | 132.4 | 126.5 | 128.6 | 126.5 | 138.7 |
| Fe K(eV) | |||||||
| Eq Width | … | … | 47 | … | … | 49 | … |
| 0.58 keV (eV) | |||||||
| eX-ray Flux | 3.16 | 3.12 | 3.11 | 3.09 | 3.19 | 3.15 | 3.12 |
| 0.3-10 keV | |||||||
| (10-11 erg cm-2 s-1) | |||||||
| fLX | 4.57 | 4.52 | 4.50 | 4.47 | 4.62 | 4.56 | 4.52 |
| 0.3-10 keV | |||||||
| (erg s-1) |
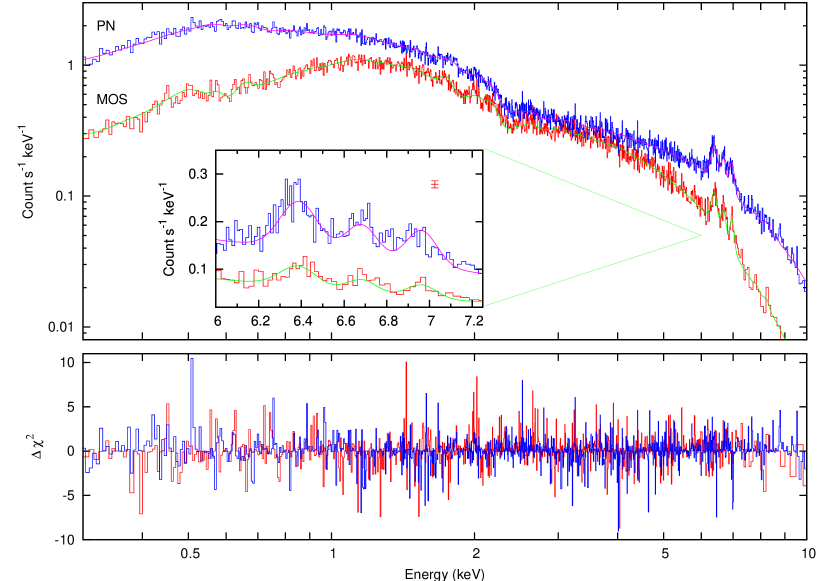
The best fitting was thus obtained for a model consisting of a partially absorbed apec component + a low energy apec component + a Gaussian at 6.4 keV. The best fitting values for the partial absorber were: column density NH 1.120.0210-21 cm-2 with a covering fraction of 46 per cent. The best fitting temperatures of the two apec components are 16.0 keV and 176.4 eV respectively for a common elemental abundance of 0.52. The error bars quoted here and everywhere in this paper are for a 90 per cent confidence limit for a single variable parameter. The best fitting apec model to the observed MOS and pn spectra and their contribution to chi-square of the fit are shown in Figure 5. Though this fit by two component apec models gave close to 1.0, it was unable to fit the plasma emission line at 6.7 keV presumably due to the very high or very low temperatures of the plasma that were fitted. This suggests that a multi-temperature plasma model may be more appropriate than a single temperature apec model to reproduce the IGR1719 spectra. Mukai et al. (2003) and Pandel et al. (2005) showed that the cooling flow model MKCFLOW available in XSPEC is very successful in reproducing the Chandra and XMM-Newton spectra of several mCVs. We, therefore, fitted a model consisting of partially absorbed MKCFLOW and a Gaussian line at 6.4 keV and obtained a of 1.16 for 1876 degrees of freedom. The addition of a second Gaussian at 0.52 keV or a low kT (175 eV) apec component further improved the fit to give a of 1.00 (dof: 1874) and 0.97 (dof: 1875) respectively. The best fitting value of the low temperature parameter in the MKCFLOW model is 3.9 keV while the high temperature value is not constrained but pegged at the maximum model temperature of 80 keV. The best fitting NH,ISM value at 1.121021 cm-2 is the same as in the earlier two temperature apec model fits. The best fitting values for the partial absorber column density at 7.31022 cm-2 and covering fraction of 40 per cent are consistent with the values obtained using two temperature apec models previously (see the first four models in Table 3). Similarly, the temperature of the additional apec component kTapec at 174.8 eV matches with the temperature derived with two temperature apec models. The best fitting MKCFLOW model fit is shown in Figure 6 and the spectral parameters of the model are listed in Table 3 (last 3 models). It is also to be noted that both the 6.7 and 7.0 keV plasma emission lines are now fitted (Fig. 6).
Assuming a distance of 110 pc for IGR1719 (Masetti et al., 2006), we estimate the X-ray luminosity from the flux in 0.3-10.0 keV energy band for all the models. The X-ray flux and estimated X-ray luminosity in the energy range of 0.3-10.0 keV are listed in Table 3.
We calculated the un-absorbed soft (Fs) and hard (Fh) X-ray flux in the energy band of 0.2-12.0 keV from the low kT apec model and MKCFLOW model respectively. The fluxes are Fs = 1.260.1210-13 erg cm-2 and Fh = 4.920.1110-12 erg cm-2 respectively. The softness ratio is then calculated using the relation F (Evans & Hellier, 2007) as 0.0064 (-2.190.03 in scale).
2.3 Phase Resolved Spectroscopy for the dominant period
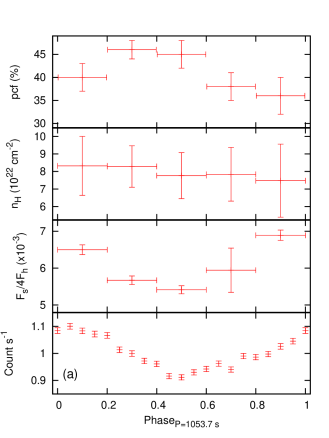
The spectral fits discussed in §2.2 show that a partial covering absorber can explain the XMM-Newton spectra of IGR1719, suggesting a varying absorption along the line of sight. For a better understanding of the spectral behaviour of IGR1719 as a function of the phase for the dominant period present in Fig. 2 & 3, we analyzed the spectra extracted for five equal phase intervals of 0.2. We extracted the XMM-Newton spectra at different phases of the most dominating period of 1053.7 seconds (see §2.1).
With the phacalc tool available in SAS analysis suite, the phases corresponding to the frequency (0.949 mHz) of all the events were calculated for the MOS1, MOS2 and pn detectors using MJD 55077.00663866 as the epoch. The tool adds a ‘PHASE’ column to the events file. The spectra corresponding to different phases with a uniform phase bin of 0.2 with = 0.0, 0.2, …were extracted using phase value as an additional criterion to the standard selection criteria used earlier (see, §2.2). The MOS1 and MOS2 spectra were combined together to improve the statistics. Since we are interested only in the partial absorber component, parameters of other models like the NH,ISM, temperature of the apec component were fixed at the values shown in Table 3 while varying only their normalization values.
The spectral fittings were performed on the combined MOS spectra with
apec+gauss+pcfabs(MKCFLOW) model. The partial covering absorber fraction,
the equivalent hydrogen density of the column as a function of spin phases
of IGR1719 are shown in Figure 7a along with the folded XMM-Newton 0.3-1.0 keV light curve profile for a comparison. We calculated the
un-absorbed flux in the soft (Fs) and hard (Fh) components in the
energy range 0.2-12.0 keV separately and obtained the softness ratio
Fs/4Fh. The softness ratio as a function of phase is shown in
Fig. 7a. An anti-correlation between the X-ray intensity and
the partial absorber fraction, and a correlation between the softness
ratio and the X-ray intensity can be seen in Fig. 7a. The NH
value of the partial absorber, however, appears to be constant within the
error bars.
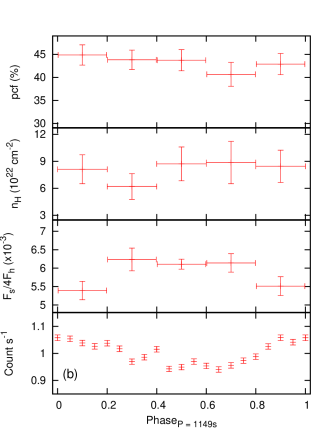
A similar study was performed with respect to the phases of the second dominant X-ray period at 1149.4 s also and plotted in Figure 7b. From the figure, it is evident that the softness ratio seems to show anti-correlated variation with the phase whereas the partial covering fraction remains constant. The behaviour of the softness ratio is not consistent with the X-ray intensity variations seen in Figure 4.
3 Discussion
The temporal analysis of XMM-Newton and Suzaku data of IGR1719 shows the presence of several power peaks at frequencies below 1 mHz. The continuous XMM-Newton data helps in identifying the periodic variability of the system un-ambiguously. The dominant frequency here corresponds to the period 1053.712.2 s (PX) in the soft energy bands viz. 0.3-1.0 keV and 1.0-3.0 keV. There is only a hint of this period in the hard X-rays, with a much reduced amplitude. Another peak at a period of 1149.415.8 s near the main frequency is also seen in both the MOS and pn power spectra. This period is close to the previously reported spin period of 1139.550.04 s by Pretorius (2009) based on high speed optical photometry and attributed to the spin of the white dwarf. Pretorius (2009) also reported an orbital period of 4.0050.006 h for IGR1719 in the time-resolved spectroscopy data and noted the presence of some power around the beat frequency between orbital and then assumed spin period. However, they also pointed out that, with the available optical data, they were unable to distinguish between the spin period and the beat period. It is likely, therefore, that the previously reported spin period might actually be the sideband period due to beating between the orbital and spin periods (orbital side-band). If we assume that the dominant peak seen here at 1053.712.2 s in the X-ray light curves actually corresponds to the spin frequency () of the white dwarf and 1149.415.8 s period is the orbital side band (), then this would imply an orbital period () of 3.52 h. This orbital period and its harmonics are marked as long dashed lines in Fig. 3, and the spin frequency and orbital beat frequencies of the spin frequency are marked as short dashed lines. Our estimation of Porb = 3.52 h based on the above assumption being in agreement with the orbital period of 4.0050.006 h reported by Pretorius (2009). Table 4 lists the observed optical and X-ray periods and their plausible identifications along with the estimated orbital periods. We also calculate the expected beat periods assuming the dominant X-ray period as the spin and the orbital period as obtained by Pretorius (2009) and list them in Table 4 for comparison.
| Spin Period | Beat Periods | Orbital Period | |
| Pspin | Pω-Ω | Pω+Ω | Porb |
| (s) | (s) | (s) | (h) |
| 1053.7 12.2 (X) | 1149.4 15.8 (X) | … | 3.52 |
| 1139.55 0.04 (o) | … | 1053.7 12.2 (X) | 3.89 |
| 1053.7 12.2 (X) | 1136.8 14.3a | 981.9 10.5a | 4.005 0.006b |
According to Wynn & King (1992), the power spectrum of an IP with a simple disc-less geometry is dominated by signals at spin frequency (), beat frequency () and second beat frequency (2) components with the condition that one of the latter should always be present, whereas the disc accreting systems show only the spin frequency component (). Therefore, the presence of a dominating power at spin period (=1053.7 s) and a significant power at the orbital sideband at 1149.4 s in the IGR1719 X-ray power spectra suggests a predominant contribution from the disc-less accretion component in IGR1719 making IGR1719 a member of the rare disc-less accreting IPs. X-ray pulsations at the orbital beat period are seen when the accreting material is directly coupled with the magnetic field lines. The power spectra of IGR1719 are similar to RX J1803 power spectra of XMM-Newton lightcurves though the modulation at the beat period is significantly less compared to the spin period modulation (Anzolin et al., 2008). Wynn & King (1992) also suggest that in a disc-less accretion system, the power in the spin period decreases with the energy, whereas the power in the beat period increases with energy. This is attributed to the absorption of low energy photons by the accretion column itself. In the intermediate polars, the highest energy X-rays are produced by shocks above the white dwarf surface and hence are less prone to absorption by the accretion column resulting in the decrease of modulation. The softer X-rays are emitted closer to the white dwarf surface than the harder X-rays are, and are thus more prone to absorption by the accretion column and hence, resulting in the increase of amplitude modulation. The IGR1719 power spectra obtained in different energy bands show that the amplitudes of modulation is decreasing with energy (Fig. 3). The near absence of any significant power near the spin period or the orbital side band in the hard X-ray power spectrum also suggests that the hard X-rays originate at a much higher altitude in the accretor. Combining this zero power at the spin period in the hard X-rays (keV), but a significant power in the beat period at 1149.4 s along with power in orbital period and its harmonics in the hard X-rays further supports the disc-less accretion (Wynn & King, 1992).
A partial absorber in front of a multi-temperature plasma in a cooling flow model best explains the XMM-Newton spectra of IGR1719. The multi-temperature plasma produced in the shock region just above the white dwarf is thus seen through two absorbers, an ISM component (NH = 1.121021 cm-2) and a thick partial covering absorber (NH = 7.31022 cm-2). The estimated value of the partial covering absorber fraction matches with the fraction obtained by Yuasa et al. (2010) for IGR1719 using Suzaku data. The spectra of IGR1719 indicate the presence of a very high temperature for which we could only obtain a lower limit. Yuasa et al. (2010) reported the mass of white dwarf to be 1.03 M⊙. We estimated the maximum shock temperature corresponding to this mass as 64.6 keV using the relation,
where the radius Rwd is calculated from the white dwarf mass-radius relation given by Nauenberg (1972) is 5.24108 cm. The calculated shock temperature of the IGR1719 explains the un-bound high temperature values obtained from the cooling flow spectral models. The Fe abundance in the multi temperature plasma is very close to solar abundance and reproduces the observed Fe lines at 6.7 and 7.0 keV completely.
The X-ray flux obtained from different spectral models are very similar in the value. For the best fitting apec+MKCFLOW model, the flux in 0.3-10.0 keV energy band is estimated to be 3.110-11 erg cm-2 s-1 which yields an X-ray luminosity of 4.51031 erg s-1. Using the relation L=GMṀ/2R and taking the mass of the white dwarf as 1.03 M⊙ (Yuasa et al., 2010) and a radius of 5.24108 cm calculated from the Nauenberg (1972) white dwarf mass-radius relation, we obtain a mass accretion rate of 5.510-12 M⊙ yr-1.
A growing number of IPs show a soft X-ray excess with blackbody temperatures less than 100 eV (Evans & Hellier 2007, Anzolin et al. 2008, Anzolin et al. 2009, de Martino et al. 2008). Though the XMM-Newton spectra of IGR1719 show a soft excess, the residuals showed several un-resolved lines around 0.5 keV energy, and the spectral fits with an additional blackbody component did not improve in the chi-square. Alternatively a low temp apec component with a kT of 175 eV did improve the chi-square, and was found to be more suitable. This is also consistent with the improvement seen using continuous temperature models like MKCFLOW. The kT175 eV is significantly higher than the typical blackbody temperatures (30-120 eV) of other soft IPs.
Evans & Hellier (2007) suggest that the main reason for some IPs to show soft excess is that the accretion curtains do not hide the accretion footprints. The soft X-ray excess in IGR1719 thus suggests a highly inclined magnetic axis in the system. We calculated a softness ratio of 0.0064 from the unabsorbed flux of IGR1719 which matches the softness ratio of V2400 Oph within one sigma error (Evans & Hellier, 2007). This is interesting, that although a soft X-ray component with a ratio similar to that in other IPs exists in IGR1719, but a simple black body model typically used for the soft excess is unable to explain the soft excess seen in IGR1719.
The multi-temperature plasma models do not reproduce the observed 6.4 keV Fe fluorescent line, thus requiring the addition of a Gaussian component. The observed fluorescent line is compatible with the emission from comparatively cold iron in the ionization states Fe I to Fe XVII (van Teeseling et al., 1996) and does not show any significant broadening. This line feature in the X-ray spectra is seen in several IPs and polars (Hellier & Mukai 2004, Landi et al. 2008) and usually understood as due to reflection from cold matter.
From the spin phase resolved spectroscopy (2.3), we found that the variation in the partial covering fraction (pcf) of the absorber is anti-correlated with the X-ray intensity whereas the softness ratio (F) varies in phase with the X-ray intensity. In an IP with an accretion curtain, self absorption can cause such a variation in the X-ray intensity. When the curtain is maximally in the line of sight, the X-ray intensity will be minimum due to the maximum absorption, and the light intensity will be the maximum when either the curtain moves away from the line of sight or when it thins down. Similarly, more of the soft X-ray photons assumed to be from the accretion footprint will be absorbed if the accretion curtain is in the line of sight resulting in the reduction of softness ratio, and the softness ratio will increase when the curtains do not hinder the accretion footprint. Hence, the soft excess appears to be related to the pcf only, indicating that the phase modulation in the soft x-rays is due to varying coverage by the accretion curtains towards the line of sight.
In our discussion, we have assumed that the X-ray period of 1053.7 s in the XMM-Newton data is the spin period of the white dwarf and the period at 1149.4 s is the orbital side-band. But, we cannot rule out the plausibility of 1149.4 s being the spin period and 1053.7 s being the side-band. Also, the 1149.4 s period almost matches with 1139.6 s period seen in the optical photometry data (Pretorius, 2009) of IGR1719 and is reported to be due to spin of the white dwarf. If true, spin at 1149.4 s and orbital side-band at 1053.7 s would imply a retrograde white dwarf rotation in IGR1719 similar to IGR J1817 and XSS J0056 (Bernardini et al., 2012).
Generally the spin modulation of an intermediate polar is attributed to a combination of varying photo electric absorption and self absorption between the observer and the X-ray emitting regions. Hence, we are expected to see an anti-correlation of partial covering fraction with the spin. A near constant partial covering fraction with the phase of 1149.4 s period and an anti-correlation with the phase of 1053.7 s period thus support our earlier assumption of 1053.7 s as the white dwarf spin and 1149.4 s as the orbital side-band.
4 Conclusions :
Our timing analysis of the archival XMM-Newton and Suzaku data of IGR1719 shows a dominant frequency at 0.9490.011 mHz corresponding to a period of 1053.712.2 s and another close period at 1149.4 s. We propose that the period at 1053.7 s is the spin period of the white dwarf, and the period at 1149.4 s is the orbital sideband, and thus we estimate the orbital period as 3.52 h. We also provide an ephemeris of this spin period. Though the results of the phase resolved spectroscopy performed at the two periods 1053.7 s and 1149.4 s favours the proposed period at 1053.7 s as the white dwarf spin period, polarimetric detection of the spin period of IGR1719 is needed to confirm the spin period. The power spectra obtained in different energy bands suggest that IGR1719 is a candidate for the rare group of disc-less IPs.
A partially and fully absorbed cooling flow model satisfactorily explains the observed spectra of IGR1719. The partial covering fraction varies between 0.34 at the spin minima to 0.46 at the spin maxima indicating a geometrical change in the absorber with spin phase. We also report a soft X-ray excess which can be modelled with a low kT apec model. We detect a 6.4 keV fluorescent line which can be attributed to the emission from cold iron in the ionization states up to Fe XVII from the white dwarf surface. From the observed flux in the 0.3-10.0 keV energy range, we estimate a mass accretion rate of 5.510 yr-1.
From the temporal and spectral analysis the image of IGR1719 that emerges is of a disc-less accreting system where the matter from the secondary is threaded along a magnetic pole as a stream resulting in modulations of X-rays at the orbital beat period. The shocks formed above the white dwarf surface give a multi temperature spectra with a shock temperature above 64 keV. The soft X-ray excess seen in IGR1719 may be emitted by the unhindered accretion footprint. The site for origin of the fluorescent line emission is not clear in the system.
Acknowledgements: This research has made use of data obtained from the High Energy Astrophysics Science Archive Research Center (HEASARC), provided by NASA’s Goddard Space Flight Center. We would like to thank the anonymous referee for the insightful remarks that improved the manuscript.
References
- Anzolin et al. (2008) Anzolin G., de Martino D., Bonnet-Bidaud J.-M., Mouchet M., Gänsicke B. T., Matt G., Mukai K., 2008, A&A, 489, 1243
- Anzolin et al. (2009) Anzolin G., de Martino D., Falanga M., Mukai K., Bonnet-Bidaud J.-M., Mouchet M., Terada Y., Ishida M., 2009, A&A, 501, 1047
- Arnaud, K.A. (1996) Arnaud K.A., 1996, Astronomical Data Analysis Software and Systems V, eds. Jacoby G. and Barnes J., ASP Conf. Series, 101, 17
- Barlow et al. (2006) Barlow E.J., Knigge C., Bird A.J., 2006, MNRAS, 372, 244
- Bernardini et al. (2012) Bernardini, F., de Martino, D., Falanga, M., et al., 2012, arXiv:1204.3758
- Bird et al. (2004) Bird A.J., et al. 2004, ApJ., 607, 33L
- Bird et al. (2007) Bird A.J., et al. 2007, ApJS., 170, 175
- Buckley et al. (1997) Buckley D. A. H., Sekiguchi K., Motch C., O’Donoghue D., Chen A., Schwarzenberg-Czerny A., Pietsch W., Harrop- Allin M. K., 1995, MNRAS, 275, 1028
- Butters et al. (2008) Butters O.W., Norton A.J., Hakala P., Mukai K., Barlow E. J., 2008, A&A, 487, 271
- Cropper (1990) Cropper M., 1990, Space Science Reviews, 54, 195.
- de Martino et al. (2008) de Martino D., Matt G., Mukai K., Bonnet-Bidaud J.-M., Falanga M., Gänsicke B. T., Haberl F., Marsh T. R., Mouchet M., a Littlefair S. P., Dhillon V., 2008, A&A, 481, 149
- Dorman & Arnaud (2001) Dorman Ben., Arnaud K. A., 2001, Astronomical Data Analysis Software and Systems X, ASP Conference Proceedings, Vol. 238. Ed: F. R. Harnden, Jr., Francis A. Primini, and Harry E. Payne, p415
- Evans & Hellier (2007) Evans P.A., & Hellier Coel., 2007, ApJ, 663, 1277
- Hellier (1996) Hellier C., 1996, in Astrophysics and Space Science Library, 208, IAU Colloq. 158: Cataclysmic Variables and related Objects, ed. A. Evans & J.H. Wood, 143.
- Hellier & Mukai (2004) Hellier C., Mukai K., 2004, MNRAS, 252, 1037
- Jansen et al. (2001) Jansen F., et al., 2001, A&A, 365, L1
- Koyama et al. (2007) Koyama K., et al., 2007, PASJ, 59, 23
- Landi et al. (2008) Landi R., Bassani L., Dean A.J., Bird A.J., Fiocchi M., Bazzano A., Nousek J.A., Osborne J.P., 2009, MNRAS, 392, 630
- Mitsuda et al. (2007) Mitsuda K., et al., 2007, PASJ, 59, 1
- Masetti et al. (2006) Masetti N., et al., 2006, A&A, 459, 21
- Mukai et al. (2003) Mukai K., Kinkhabwala A., Peterson J. R., Kahn S. M., Paerels F., 2003, ApJ, 586, L77
- Nauenberg (1972) Nauenberg M., 1972, ApJ, 175, 417
- Norton et al. (2004) Norton, A.J., Wynn, G.A., Somerscales, R.V., 2004, ApJ, 614, 349
- Pandel et al. (2005) Pandel D., Coŕdova F. A., Mason K. O., Priedhorsky W. C., 2005, ApJ, 626, 396
- Patterson (1994) Patterson J., 1994, PASP, 106, 209.
- Pretorius (2009) Pretorius M.L., 2009, MNRAS, 395, 386
- Roberts, Lehár & Dreher (1987) Roberts D.H., Lehár J., Dreher J.W., 1987, AJ, 93, 968
- Serlemitsos et al. (2007) Serlemitsos P. J., et al., 2007, PASJ, 59, 9
- Strüder et al. (2001) Strüder L., et al., 2001, A&A, 365, L18
- Takahashi et al. (2007) Takahashi T., et al., 2007, PASJ, 59, 35
- Turner et al. (2001) Turner, M.J.L., et al., A&A, 365, 27
- van Teeseling et al. (1996) van Teeseling A.V., Kaastra J.S., Heise J., 1996, A&A, 312, 186
- Warner (1995) Warner P., 1995, PASP, 116, 115
- Wynn & King (1992) Wynn G.A., King A. R., 1992, MNRAS, 255, 83
- Yuasa et al. (2010) Yuasa T., Nakazawa K., Makishima K., Saitou K., Ishida M., Ebisawa K., Mori H., Yamada, S., 2010, A&A, 520, A25