Imagery and long-slit spectroscopy of the Polar-Ring Galaxy AM 2020-504
Abstract
Interactions between galaxies are very common. There are special kinds of interactions that produce systems called Polar Ring Galaxies (PRGs), composed by a lenticular, elliptical, or spiral host galaxy, surrounded by a ring of stars and gas, orbiting in an approximately polar plane. The present work aims to study AM 2020-504, a PRG with an elliptical host galaxy, and a narrow and well defined ring, probably formed by accretion of material from a donor galaxy, collected by the host galaxy. Our observational study was based on BVRI broad band imagery as well as longslit spectroscopy in the wavelenght range 4100–8600Å, performed at the 1.6 m telescope at the Observatório do Pico dos Dias (OPD), Brazil. We estimated a redshift of z= 0.01683, corresponding a heliocentric radial velocity of 5045 23 km/s. The (B-R) color map shows that the ring is bluer than the host galaxy, indicating that the ring is a younger structure. Standard diagnostic diagrams were used to classify the main ionizing source of selected emission-line regions (nucleus, host galaxy and ring). It turns out that the ring regions are mainly ionized by massive stars while the nucleus presents AGN characteristics. Using two empirical methods, we found oxygen abundances for the H II regions located in the ring in the range 12+log(O/H)=8.3-8.8 dex, the presence of an oxygen gradient across the ring, and that AM 2020-504 follows the metallicity-luminosity relation of spiral galaxies. These results support the accretion scenario for this object and rules out cold accretion as source for the HI gas in the polar ring.
keywords:
galaxies: peculiar. galaxies: kinematics and dynamics. galaxies: polar-ring. galaxies: individual: AM 2020-504.1 Introduction
Galaxies have long been seen as islands distantly scattered and stable in the universe. We now know that galaxies are not randomly distributed in space. They are in groups that are subject to the expansion of the universe and mutual gravitational interaction. The interaction between galaxies has substantially modified the cosmic structures throughout the evolution of the Universe. These events are determined by the attractive character of gravity which in turn induces in larger systems, collisions, tidal forces and dynamical frictions (Rodrigues et al., 1999). The strong perturbations on the interacting systems are due to the tidal force. This can dismember large quantities of material to form bridges and tails, and thus injecting chemically processed interstellar material into the intergalactic space, contaminating distances up to 10 times larger than the diameter of the iterating galaxies (Dottori et al., 1997).
One of the many types of interactions occur when there is a ring of gas, dust and stars positioned perpendicularly with the galaxy’s main plane. These systems are known as polar ring galaxies (PRG), peculiar systems with early-type or elliptical host galaxies. The term Polar ring galaxies was first introduced by Schweizer et al. (1983) and used by Whitmore in the publication Whitmore et al. (1987). Whitmore et al. (1990) published his “Polar Ring Catalog” (PRC), with a total of 157 objects: 6 kinematically confirmed (rotation, detected in two orthogonal planes), 27 galaxies as ”good candidates”, 73 as “Possible candidates”, and 51 galaxies as ”related objects”. Bekki (1998) discuss the origin of the fundamental observational properties of polar ring galaxies. Faúndez-Abans & de Oliveira-Abans (1998) make a more comprehensive classification of all collisional ring galaxies, which includes the PRGs. Within our neighboring Universe, 20 PRGs have recently been confirmed in the catalog by Gnedin (2009), as well as Moiseev et al. (2011) display a new catalogue with candidates to polar-ring galaxies selected from the SDSS.
The Bournaud & Combes (2003) reviewed the two scenario for the formation of PRGs: (1) the fusion that occurs in a frontal collision between two spiral galaxies whose discs are orthogonal, (2) the accretion scenario, in which during the interaction between two galaxies the host collects material from another galaxy to form the ring. Both scenarios require a specific geometric configuration for the formation of a polar ring.
Also, Macciò et al. (2006) proposed the (3) cold accretion scenario for the formation of isolated PRG’s. Based on a large cosmological hydrodynamical simulation, they showed that their formation can occur naturally in a hierarchical universe where most low-mass galaxies are assembled through the accretion of cold gas infalling along megaparsecscale filamentary structures.
Here we report the results of a study of the PRG AM 2020-504, based on broad band images and long-slit spectroscopy obtained at the Observatório Pico dos Dias, Brazil. The main goal of this paper is to investigate the scenario of formation by determinations of the oxygen abundance in the star-forming regions located in the ring and infering the dust and gas content of the system. This was done through broadband images and spectroscopic data, from which we study the kinematics, surface and aperture photometry. In Section 2 we present a review of AM 2020-504. Observation and data reductions are presented in Section 3. The results and discution are presented in Section 4, while the conclusions are given in Section 5.
2 AM 2020-504 review
AM 2020-504 is composed by a narrow ring surrounding a very bright host galaxy. This object appears in many PRG catalogs (e.g. Whitmore et al., 1990; Bournaud & Combes, 2003; Reshetnikov et al., 2002; Faúndez-Abans & de Oliveira-Abans, 1998; Casasola et al., 2004). Based on photometric and spectroscopic observations, Arnaboldi et al. (1993b) concluded that the material of the ring has been likely accreted, as indicated by the kinematical decoupling of the inner core of the host galaxy, the different color of the material in the ring and in the galaxy, and the large amount of HI, quite unusual for an E galaxy. They modeled the surface brightness of the galaxy, assuming that the central component is seen edge-on, to determine the geometry of the system. They found that the luminosity profile of the host galaxy is well described by an oblate Jaffe model with axis ratio for R, where and are the minor and major axis of the galaxy, and is the galactic radius. The intrinsic inclination of the ring plane derived using the (B-R) and H images is consistent with the ring being very nearly polar. The ring is warped and tilted 18∘ from edge on, passing with the NE side in front of the elliptical galaxy. Arnaboldi et al. (1993a) reproduced the UV SED by a model consisting of an elliptical galaxy with a star burst, which give a lower limit for the age of the polar ring of yr, consistent with the structure being quite young.
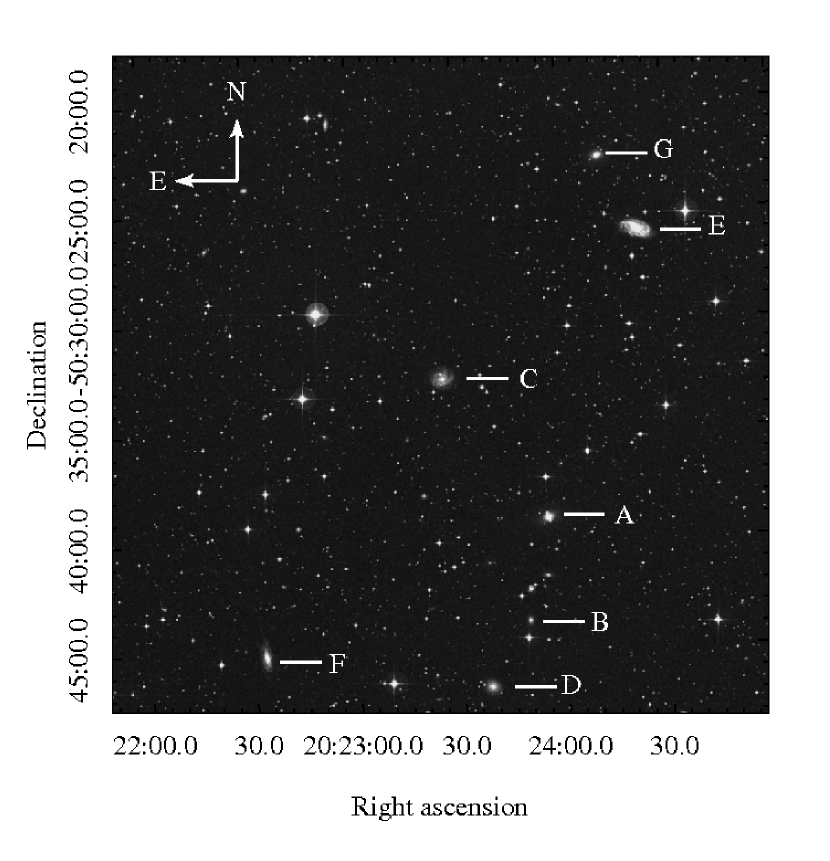
The field near AM 2020-504 is shown in Figure 1, where it is labeled A. AM 2020-504 has no detected leftover materials or bridges connecting it with another structure or surounding galaxy. We found six other objects belonging to the group in a search field of 30′ around AM 2020-504. These galaxies cover a velocity range of 730 km/s. Closer to AM 2020-504, at a projected distance of , is 2MASXJ2023488-5043492 (label B), whose velocity difference is 330 km/s. Objects C (ESO 234-G016) and D (ESO 234-G017) have very similar radial velocities (190 km/s and 5 km/s, respectively), forming a sort of plane in the radial velocity space (see Table1). The coordinates of the objects, as their radial velocities were obtained from NED111NASA/IPAC Extragalactic Database (NED) is operated by the Jet Propulsion Laboratory, California Institute of Technology, under contract with the National Aeronautics and Space Administration.
| Name | Label | Velocity | Relative | Distance |
|---|---|---|---|---|
| (km/s) | Velocity | (arcmin) | ||
| A | AM 2020-504 | 500643 | 0 | 0 |
| B | 2MASXJ2023488-5043492 | 467645 | -330 | 4.7 |
| C | ESO 234-G016 | 519627 | 190 | 7.9 |
| D | ESO 234-G017 | 5011 | 5 | 8.3 |
| E | NGC 6899 | 573110 | 724 | 13.8 |
| F | ESO 234-G013 | 4786 | -220 | 14.3 |
| G | 2MASXJ20241155-5022394 | 5648 | 642 | 16.7 |
3 Observations and data reduction
3.1 Broadband optical imagery
Photometric observations were performed with the 1.6-m telescope at Observatório Pico dos Dias (OPD), Brazil on July 2008. The telescope was equipped with direct imaging Camera 1, with the CCD 106, a back-illuminated 1024 x 1024 detector.
The data were acquired with standard Johnson B, V, R and I filters. Calibration was accomplished using repeated observations of standard stars from Landolt (1992) selected fields Mark-A and PG13223-086. The log of observations is given in Table 2.
Data reductions were performed in the standard manner using the IRAF111Image Reduction and Analysis Facility is developed and maintained by the National Optical Astronomy Observatories (NOAO) package. This included dark and bias subtraction, and flat-field correction (we have used a mean of several dome flats taken in the appropriate filter). The cosmic rays were removed manually by masking them with the median of adjacent pixels.
| Date | Band-pass | Exp. (s) |
|---|---|---|
| 2008 Jul 07-08 | B | 6 x 300 |
| 2008 Jul 07-08 | V | 6 x 300 |
| 2008 Jul 07-08 | R | 6 x 300 |
| 2008 Jul 07-08 | I | 6 x 240 |
3.2 Spectroscopic observations
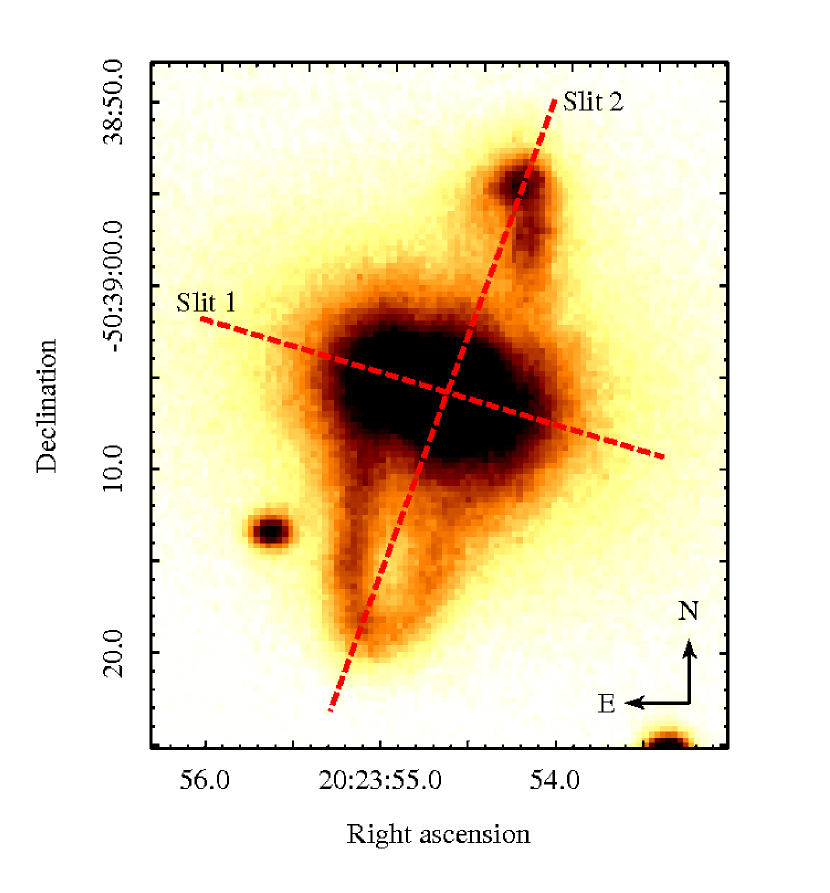
The spectroscopic observations were performed with the 1.6-m telescope at OPD equipped with a Cassegrain spectrograph and CCD105, a back-illuminated 2048 x 2048 detector on June 2008 and September 2008. Difraction gratings of 300 lines/mm and 600 lines/mm were used. The aim of the 300 lines/mm grating was to have a larger spectral coverage (4100–8600Å), while the 600 lines/mm was used to obtain higher resolution in the main lines H, [O III]5007, H, [N II]6584 and [S II]6716,6731.
For the observations we used two slit positions, one along the major axis of the host galaxy (slit-1) and another along the major axis of the ring (slit-2). Slit-1 has an inclination of NE and slit-2 has an inclination of N-W, as shown in Figure 2. Spectrophotometric standard stars were observed each night to perform flux calibration. Those are tertiary standards from Baldwin et al. (1981), as revised by Hamuy et al. (1992), see also Hamuy et al. (1994). Arc lamps were taken before and after each exposure in order to provide accurate wavelength calibration. A log of the spectral observations is given in Table 3. The spectra processing and data analysis were done using standard procedures employing IRAF and RVSAO packages. This includes bias substraction, flat field correction, cosmic ray removal, sky substraction, wavelength and flux calibration (IMAGES/IMFIT, IMUTIL, STSDAS/IMGTOOLS, TWODSPEC and ONEDSPEC tasks, respectively). The wavelength calibration errors were Å and Å for slits 1 and 2, respectively. The standard extraction aperture was set for the emission region. The spectra were reduced using the measurements of the standard stars observed at similar airmasses. The line fluxes were obtained using the IRAF/SPLOT task. This task was also used to obtain the center of the emission lines in order to later calculate the radial velocities of the measured lines. As a double check of these results, the RVSAO/IRAF external package was used to calculate the apparent radial velocities from the observed spectral shifts. The EMSAO task finds emission lines in a spectrum and computes the observed centers, yielding individual shifts and errors for each line as well as a single velocity by combining all of the lines (Mink & Wyatt, 1995).
| Slit 1 | Slit 2 | |
|---|---|---|
| Date | 2008-Sep-29 | 2008-Jul-04 |
| Grating (lines/ mm) | 600 | 300 |
| Spectral Range (Å) | 4600-6730 | 4100-8600 |
| Angle | N-E | N-W |
| Exposure Time (s) | 1800 | 1200 |
| Slit Width (′′ ) | 3 | 3 |
4 Results and Discussion
4.1 Rotation Curves
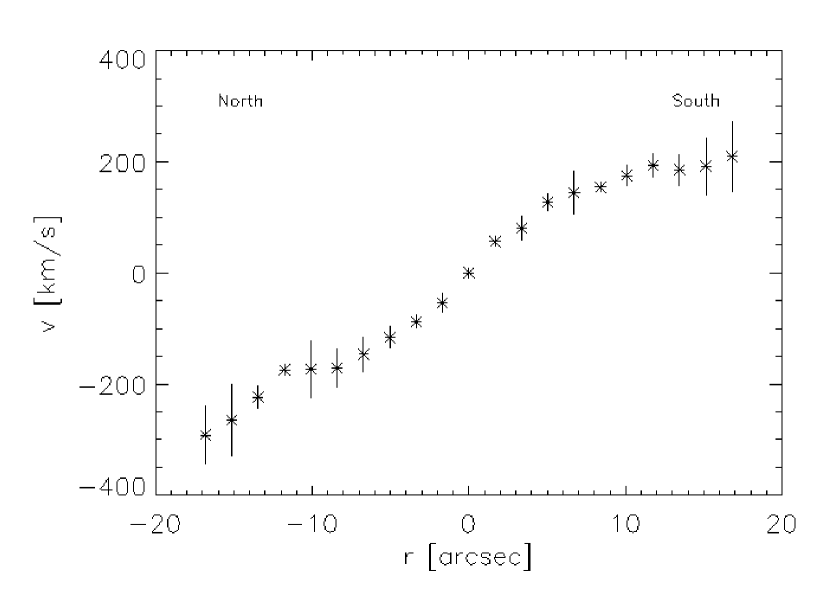
The radial velocities along the slits were calculated based on the Doppler shift of spectral lines. To construct the rotation curve of this system, the strongest emission lines were used, namely: H, [O III]5007 and H. In both slit positions, extractions of one-dimensional spectra were performed in order to obtain the rotation curves, as well as information on specific regions.
The radial velocity of the galaxy, calculated by averaging the central positions of the Slit 1, is km/s. The value is similar to that found by Whitmore et al. (1987) and Arnaboldi et al. (1993b).
The rotation profile along the ring major axis is shown in Figure 3. The northern portion of the ring is approaching and the southern portion is receding from us. This rotation curve is symmetrical and well behaved. The last three points each side of the rotation curve suggest that the northern and southern portions of the ring have a difference in rotation velocity of about 60 km/s, but this difference is under the error bars. To a certain degree, asymmetries could be explained if the ring was warped. In fact, Arnaboldi et al. (1993b) suggested that the ring is warped, and generated models that adjust fairly well the morphology and the rotation velocity curves in some directions for which they had long slit spectra, showing those asymmetries.
4.2 Spectral analysis
To analyse the emission from the gaseous component, we constructed four diagnostic diagrams proposed by Baldwin et al. (1981) and Coziol et al. (1999), using Slit 2 spectra. These diagrams are used to distinguish objects ionized only by massive stars from those containing active nuclei (AGN) and/or shock excited gas. The used diagrams were [O III]/H versus [O I]/H, [N II]/H, and [S II]/H; and [N II]/H versus [S II]/H. The emission-line intensities were measured using the IRAF SPLOT routine considering a Gaussian line profile fitting. In Table LABEL:tablen are presented the distance to the galactic center (assuming 344 pc/arcsec), the emission line intensity measurements normalized to the flux of H=100, the nebular reddening coefficient C(H), calculated by comparing the Balmer decrement H/H to the theoretical value 2.86 given by Osterbrock (1989) for an electron temperature of 10 000 K and considering the interstellar law of Whitford (1958), and the observed H flux for each aperture.
The error associated with the line fluxes were estimated following the same procedure than Oliveira et al. (2008), is given by , where is the error due to the continuum noise, calculated to be , is the number of pixels covered by the emission line, is the dispersion of the spectrum (units of wavelength per pixel), and is the root mean square of the continuum flux density (flux per unit wavelength); and is the Poisson error of the emission line.
We have compared the values of the reddening coefficient C(H) in the ring of AM 2020-504 with the ones in other PRGs and in isolated galaxies. We found an averaged C(H) of 0.8, which is similar to that () in the ring galaxy SDSSJ075234.33+292049.8 (Brosch et al., 2010), and larger than the ones in disks of spiral galaxies, for sample, in M 33 is (Bresolin, 2011) and in M 101 is (Kennicutt & Garnett, 1996).
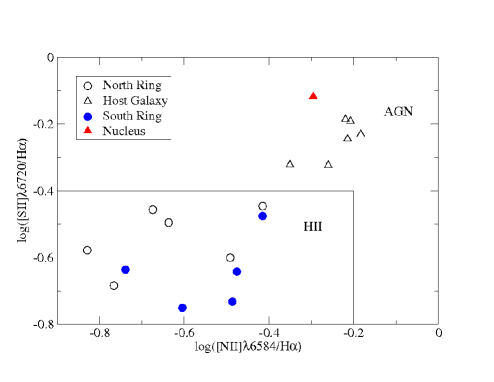
In Figures 4 and 5 the diagrams are shown, where different symbols are used to represent the ring and the nuclear regions. Figure 4 shows the diagnostics diagram proposed by Coziol et al. (1999), where we plot the values of the [NII]/H against [SII]/H ratios. These two line ratios are significantly higher in LINERs and Seyfert2s than in H II regions and Starbursts. The distinction between the two AGN types (e.g. Seyferts and LINERs) is not possible in this diagram, but regions undergoing photoionization by O and B stars are clearly separated from AGN ionizing sources. The Coziol et al. (1999) criteria established two regions in this diagram, separated by the continuous lines in Figure 4, where the gas is excited by the two different mechanisms, e.g. AGN and photoionization by stars, which is consistent with the lower limits for the presence of diffuse ionized gas in the halos of edge-on Starbursts as proposed by Lehnert & Heckman (1996). The points corresponding to the ring (circles) are broken down between the northern part of the ring (open) and South of the ring (closed), the host galaxy is represented by open triangles and the nucleus by closed triangle.
The lines in the diagrams of Figure 5 were used to separate objects with distinct ionization sources, following Kewley et al. (2006) criteria. These authors combined both photoionization model results with stellar population synthesis models, built by Kewley et al. (2001), in order to analyse the host properties of about 80 000 emission-line galaxies selected from the Sloan Digital Sky Survey. They showed that Seyferts and low-ionization narrow emission-line regions (LINERs) form clearly separated branches on the standard optical diagnostic diagrams, such as the ones used in this paper. We can see that the nuclear points occupy the AGN’s site in four diagrams (see Figures 4 and 5), in two of them, these points are at the LINERs site, while the ring points are in the region occupied for H II-like objects.
A fundamental subjects in galaxy formation studies is our understanding on the metallicity. In particular, chemical abundances of H II regions in polar ring galaxies have deep implications for the evolutionary scenario of these objects and yield hints on the mechanisms at work during their formation. Three main formation processes have been proposed (for a more detailed discussion see Spavone et al. 2011 and reference therein):
-
•
Cold accretion of pristine gas — In this scenario, a polar structure may be formed by cold gas accretion and it is expected a gas phase with very low metallicity . The metallicity of the galaxy would then be lower than that of spiral disks of the same luminosity, and any metallicity gradient along the polar ring would not be present (Macciò et al. 2006, Agertz et al. 2009).
-
•
Major dissipative merger — The PRG is formed from a merger of two disk galaxies unequal mass (e.g. Bekki 1997).
-
•
Tidal accretion of material — The polar ring may be formed by the disruption of a dwarf companion galaxy or tidal accretion of gas stripping from a disk galaxy.
In both, major merger and tidal accretion, a somewhat high metallicity would be found. To test which of these scenarios represent the formation of AM 2020-504, the oxygen abundance have been estimated in the polar disk regions. Unfortunately, accurate chemical abundances can only be derived by measuring temperature sensitive line ratios, such as [O III], which are unobservable in the spectra of the H II regions in the ring of AM 2020-504. In these cases, empirical calibrations between abundances and more easily measured emission-line ratios have to be used to estimate metal abundances (see Dors et al. 2011 and reference therein). Therefore, we estimate the oxygen abundance O/H (used as tracer of the metallicity) using the calibration of O/H with the parameters proposed by Pérez-Montero & Contini (2009)
| (1) |
| (2) |
and given by
| (3) |
| (4) |
In Table LABEL:tablen the values of these parameters and the derived oxygen abundance for each region classified in the diagnostic diagrams as H II regions are presented. We found that and parameters indicate the ring H II regions have oxygen abundances [12+log(O/H)] from 8.3 to 8.8 dex, with an average oxygen value of dex. This value is about the the solar oxygen abundance, i.e. 8.66 dex (Asplund et al. 2004), and near to the maximum oxygen abundance value derived for central parts of spiral galaxies, i.e. 8.87 dex (Pilyugin et al. 2007). In Figure 6 the oxygen abundance via the two parameters presented above as a function of the galactocentric distance of AM 2020-504 is shown. We can see that both parameters indicate an oxygen gradient across the ring. A linear regression in the oxygen estimates via and yields gradients of ) dex/kpc and ) dex/kpc, respectively. These values are similar to the ones found in spiral galaxies (see Dors & Copetti 2005, Pilyugin et al. 2004).
We also tested whether AM 2020-504 follows the metallicity-luminosity relation of spiral galaxies. Pilyugin et al. (2004) found that characteristic oxygen abundance in spiral galaxies as a function of absolute blue magnitude follows the relation
| (5) |
We computed the absolute magnitude of AM 2020-504, evaluated considering the central spheroid and the polar ring for a distance of 71 Mpc (H0=71, Mould et al. 2000), being =-18.24. Using this value, we obtained from the relation above 12+log(O/H)=8.37 dex, about the same average oxygen value found in the polar ring.
Since the averaged metallicity in AM 2020-504 is high (), there is a clear oxygen gradient across the polar ring, and this galaxy follows the metallicity-luminosity relation of normal spiral galaxies, our results support the formation scenarios of accretion or major merger for this object and rule out the cold accretion of pristine gas.
Some other works have determined the oxygen abundance in PRGs in order to test possible formation scenarios for these objects. For example, Shalyapina et al. (2002), using a O/H- calibration found the oxygen abundance of 12+log(O/H) dex for the PRG UGC 5600. Brosch et al. (2010), using a calibration between the electron temperature and strong oxygen emission-lines, found that oxygen abundance in different regions of the apparent ring galaxy SDSSJ075234.33+292049.8 is 12+log(O/H)=8.490.08 dex. Spavone et al. (2010) derive the oxygen abundance in the polar disk of NGC4650A by using both the empirical methods and direct electron temperature detections and found 12+log(O/H)=. Recently Spavone et al. (2011), using the -method (Pilyugin, 2001), reported averaged oxygen abundance values of and for H II regions located in the ring of the galaxies PRG UGC 7576 and UGC 9796. Despite of these results are in consonance with our estimations, for the majority of the galaxies above the absence of any metallicity gradient along the polar disk have been found. Since different methods or different calibrations of the same oxygen indicator provide different oxygen values, with discrepancies of up to 1.0 dex (e.g. Kewley & Ellison 2008), and few PRGs have been observed, additional analysis is needed to confirm the (dis)aggrement found above.

| r | log((H)) | C(H) | [O III]5007 | H | [N II]6584 | [S II]6716 | [S II]6731 | O3N2 | N2 | 12+log(O/H) | 12+log(O/H) |
|---|---|---|---|---|---|---|---|---|---|---|---|
| (kpc) | O3N2 | N2 | |||||||||
| 5.83 | -15.01 | 1.11 | 162 | 263 | 45 | 46 | 51 | 0.97 | 0.76 | 8.41 | 8.46 |
| 5.10 | -14.58 | 0.88 | 192 | 268 | 39 | 29 | 68 | 1.12 | 0.83 | 8.37 | 8.40 |
| 4.37 | -14.81 | 0.35 | 153 | 279 | 61 | — | — | 0.84 | 0.66 | 8.45 | 8.54 |
| 3.65 | -15.07 | 1.31 | 183 | 260 | 59 | 39 | 78 | 0.90 | 0.64 | 8.43 | 8.56 |
| 2.91 | -14.95 | 0.80 | 150 | 270 | 57 | 57 | 90 | 0.85 | 0.67 | 8.45 | 8.53 |
| 2.20 | -15.22 | 0.68 | 141 | 272 | 65 | — | — | 0.77 | 0.62 | 8.48 | 8.57 |
| 1.45 | -15.17 | 0.78 | 135 | 270 | 87 | 135 | 65 | — | — | — | — |
| 0.73 | -15.25 | 1.05 | 169 | 265 | 101 | 142 | 90 | — | — | — | — |
| 0.38 | -15.38 | 1.47 | 204 | 256 | 114 | 136 | 114 | — | — | — | — |
| 0.0 | -15.39 | 1.97 | 313 | 247 | 153 | 143 | 145 | — | — | —- | — |
| 0.38 | -15.39 | 1.71 | 262 | 252 | 154 | 124 | 132 | — | — | — | — |
| 0.73 | -15.21 | 1.03 | 207 | 265 | 174 | 113 | 148 | — | — | — | — |
| 1.45 | -15.35 | 1.68 | 352 | 253 | 152 | 109 | 152 | — | — | — | — |
| 2.20 | -15.02 | 0.47 | 192 | 276 | 106 | 117 | 90 | 0.69 | 0.41 | 8.50 | 8.74 |
| 2.91 | -15.11 | 0.63 | 169 | 273 | 67 | — | — | 0.83 | 0.61 | 8.46 | 8.58 |
| 3.65 | -15.27 | 0.86 | 209 | 268 | 66 | 105 | 45 | 0.92 | 0.60 | 8.43 | 8.58 |
| 4.37 | -15.27 | 1.44 | 137 | 257 | 47 | 69 | 55 | 0.87 | 0.73 | 8.45 | 8.48 |
| 5.10 | -15.03 | 0.53 | 124 | 275 | 55 | 79 | 16 | 0.79 | 0.69 | 8.47 | 8.51 |

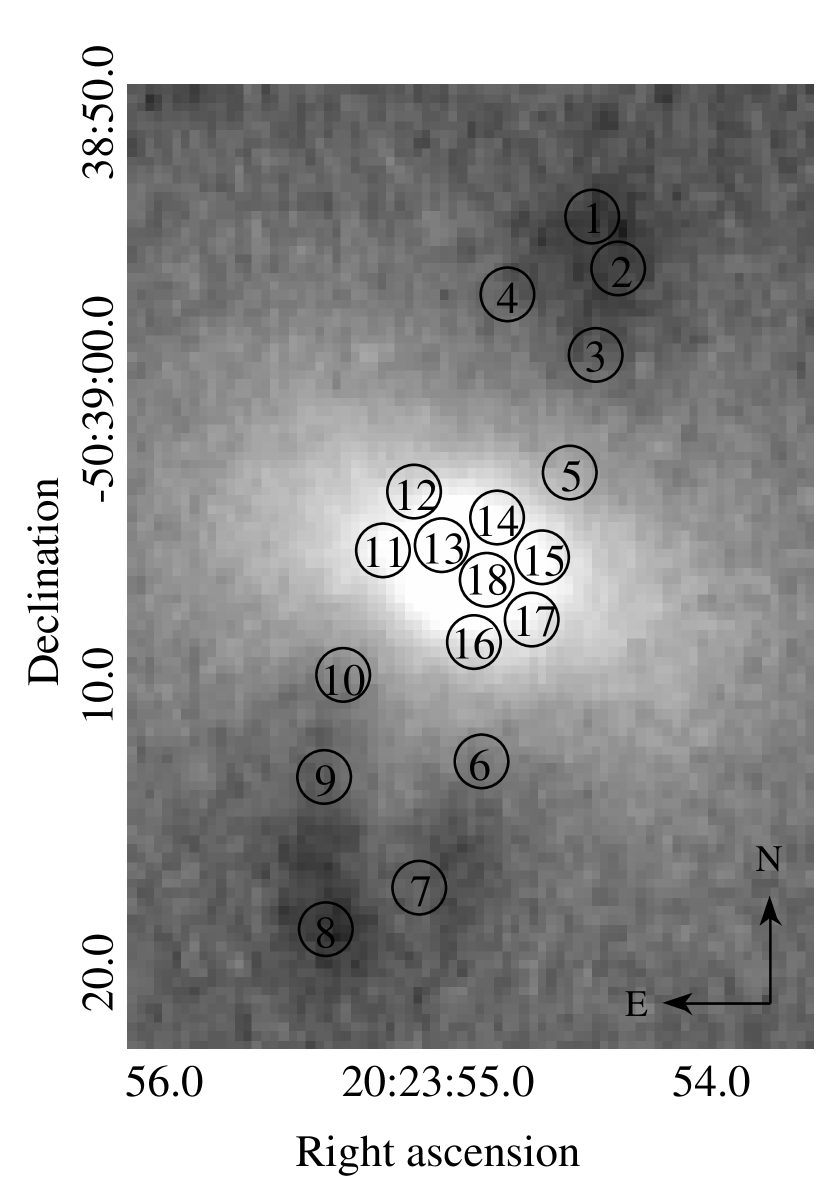
4.3 Apperture Photometry
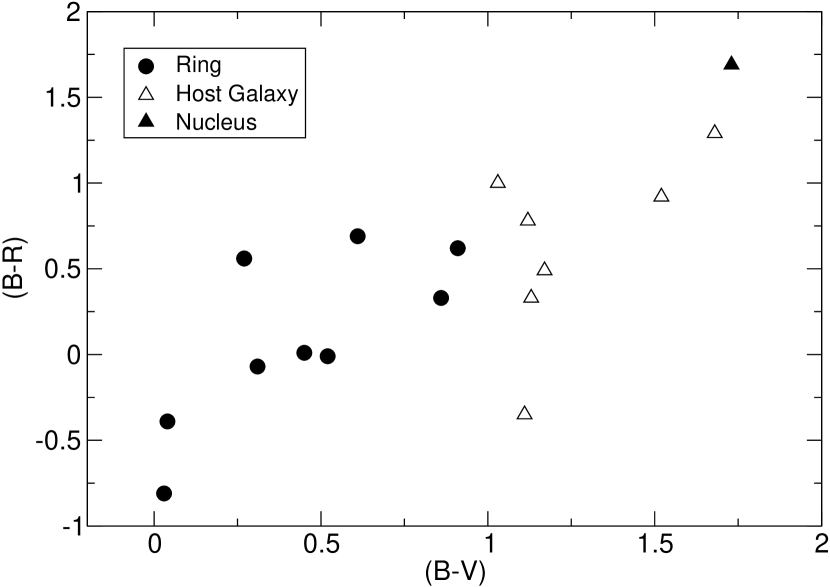
We carried out circular apperture photometry at selected positions of the system, covering the ring, the host galaxy and its nucleus. Based in the diagrams displayed in Figure 7, in Table 5 we present the measured magnitudes in B, (B-V), (B-R), (V-R) and (V-I) for the labeled regions. The ring apertures have a mean (B-V) value of 0.43 mag, while the host galaxy is 1.25 mag. The low (B-V) values on the ring, indicate that it is a structure very different from the central galaxy: the ring is younger and of distinct origin. In the (B-V) (B-R) diagram, shown in Figure 8, the ring, host galaxy and nucleus are very well separated. Again, the host galaxy tends to be redder and the ring bluer. These values are consistent with those found in other ring galaxies, as described in the case of HRG2302 (Myrrha et al., 1999). A ring bluer than the host galaxy is expected in PRGs, because their rings are the result of recent interactions, and they are made of material that comes from donnor galaxies, which are probably spiral, and in this case, the material comes from its outer, less bound, parts. These colors suggest a contribution of old stellar population in the host galaxy, and the contribution of young stars in the ring may be due to localized star formation (see also Myrrha et al. 1999).
Colormaps: The (B-R) color map is shown in Figure 7. In this greyscale map, darker regions represent bluer colors, while lighter regions represent redder colors. Clearly the ring is bluer than the host galaxy. This is also seen in other colormaps, like (B-I) and (B-V).
| Region | Label | B | (B-V) | (B-R) | (V-R) | (V-I) |
|---|---|---|---|---|---|---|
| 1 | 18.65 | 0.86 | 0.33 | -0.53 | 0.14 | |
| 2 | 17.26 | 0.61 | 0.69 | 0.08 | 0.03 | |
| 3 | 17.10 | 0.45 | 0.01 | -0.44 | 0.42 | |
| 4 | 18.58 | 0.31 | -0.07 | -0.38 | 0.44 | |
| Ring | 5 | 18.42 | 0.52 | -0.01 | -0.40 | 0.40 |
| 6 | 18.70 | 0.27 | 0.56 | 0.29 | 0.0 | |
| 7 | 18.69 | 0.03 | -0.81 | -0.84 | 0.06 | |
| 8 | 18.55 | 0.04 | -0.39 | -0.43 | 0.19 | |
| 9 | 18.70 | 0.27 | 0.56 | 0.29 | 0.07 | |
| 10 | 18.12 | 0.91 | 0.62 | -0.29 | 0.72 | |
| 11 | 17.14 | 1.03 | 1.00 | 0.11 | 0.88 | |
| 12 | 17.15 | 1.12 | 0.78 | -0.34 | 0.93 | |
| 13 | 17.23 | 1.52 | 0.92 | -0.60 | 0.74 | |
| Host | 14 | 17.17 | 1.13 | 0.33 | -0.80 | 0.8 |
| Galaxy | 15 | 19.62 | 1.17 | 0.49 | -0.68 | 0.0 |
| 16 | 17.65 | 1.11 | -0.35 | -1.46 | 0.34 | |
| 17 | 17.69 | 1.68 | 1.29 | -0.39 | 0.72 | |
| Nucleus | 18 | 19.70 | 1.73 | 1.69 | -0.04 | 0.05 |
5 Conclusion
This work presents a study of AM 2020-504, a galaxy with a well defined polar ring surrounding an elliptical host galaxy (Whitmore et al. 1987, Arnaboldi et al. 1993b and Iodice et al. 2002). The ring was probably formed by accretion of material from a donnor galaxy during an interaction event. In the field around the galaxy, we did not find any nearby object that might have given material for the formation of the ring, but there is a group of nearby galaxies with similar radial velocities.
We estimated a redshift of z= 0.01683, corresponding to a heliocentric radial velocity of 504523 km/s, confirming the values found by Whitmore et al. (1987) and Arnaboldi et al. (1993b). The rotation curve of the ring is symmetrical and well behaved. The last two points each side of the rotation curve suggest that the northern and southern portions of the ring have a difference in rotation velocity of about 60 km/s, but this difference is under the error bars. To a certain degree, asymmetries could be explained if the ring was warped.
We found the (B-R) color index averaged 0.35 and 1.73 for the ring and core of the host galaxy respectively. Thus the ring is bluer than the host galaxy (bulge + nucleus), and that is what we expectif the ring is the result of a recent interaction.
The B-band brightness profile along the minor axis of the galaxy is asymmetric due to the ring. The NW peak is higher and corresponds to the bright spots seen in the images. This morphological feature, as the general S–shaped appearence of the ring are in good agreement with the warped model of the polar ring done by Arnaboldi et al. (1993b). The light profile along the host galaxy major axis also looks asymmetric on both sides close to the center. This seems to be due to the presence of dust where the ring passes in front of the galaxy, an indication that the near side of the ring is to the NE of the galaxy.
This system is a harbours an AGN as indicated by some diagnostic diagrams. Using two empirical methods based on the emission-lines easily observable, we found: (i) oxygen abundances for the H II regions located at the ring in the range 12+log(O/H)=8.3-8.8 dex with an average value of dex and (ii) the presence of an oxygen gradient across the ring of about dex/kpc. We also found that AM 2020-504 follows the metallicity-luminosity relation of typical spiral galaxies. These results support the accretion scenario for this object and rule out cold accretion.
6 Acknowledgements
This work was partially supported by Universidade do Vale do Paraíba - UNIVAP and the Ministério da Ciência, Tecnologia e Inovação (MCTI), Laboratório Nacional de Astrofísica. P. Freitas-Lemes thanks FAPESP for the scholarship granted under process 2010/17136-4. O.L.Dors is greateful to the FAPESP for support under grant 2009/14787-7. We thank the anonymous referee for helping us make this manuscript a better paper.
References
- Agertz et al. (2009) Agertz O., Teyssier R., Moore B., 2009, MNRAS, 397, L64
- Arnaboldi et al. (1993a) Arnaboldi M., Capaccioli M., Barbaro G., Buson L., Longo G., 1993a, A&A, 268, 103
- Arnaboldi et al. (1993b) Arnaboldi M., Capaccioli M., Cappellaro E., Held E. V., Sparke L., 1993b, A&A, 267, 21
- Asplund et al. (2004) Asplund M., Grevesse N., Sauval A. J., Allende Prieto C., Kiselman D., 2004, A&A, 417, 751
- Baldwin et al. (1981) Baldwin J. A., Phillips M. M., Terlevich R., 1981, PASP, 93, 5
- Bekki (1997) Bekki K., 1997, ApJ, 483, 608
- Bekki (1998) Bekki K., 1998, ApJ, 499, 635
- Bournaud & Combes (2003) Bournaud F., Combes F., 2003, A&A, 401, 817
- Bresolin (2011) Bresolin F., 2011, ApJ, 729, 56
- Brosch et al. (2010) Brosch N., Kniazev A. Y., Moiseev A., Pustilnik S. A., 2010, MNRAS, 401, 2067
- Casasola et al. (2004) Casasola V., Bettoni D., Galletta G., 2004, A&A, 422, 941
- Coziol et al. (1999) Coziol R., Reyes R. E. C., Considère S., Davoust E., Contini T., 1999, A&A, 345, 733
- Dors & Copetti (2005) Dors J. O. L., Copetti M. V. F., 2005, A&A, 437, 837
- Dors et al. (2011) Dors J. O. L., Krabbe A., Hägele G. F., Pérez-Montero E., 2011, MNRAS, 415, 3616
- Dottori et al. (1997) Dottori H., Mirabel F., Rodrigues I., 1997, in S. M. Viegas, R. Gruenwald, & R. R. de Carvalho ed., Young Galaxies and QSO Absorption-Line Systems Vol. 114 of Astronomical Society of the Pacific Conference Series, Formation of Dwarf Galaxies in Tidal Tails and the Contamination of the Intergalactic Medium. pp 71–+
- Faúndez-Abans & de Oliveira-Abans (1998) Faúndez-Abans M., de Oliveira-Abans M., 1998, A&AS, 129, 357
- Gnedin (2009) Gnedin N. Y., 2009, Nature, 461, 43
- Hamuy et al. (1994) Hamuy M., Suntzeff N. B., Heathcote S. R., Walker A. R., Gigoux P., Phillips M. M., 1994, PASP, 106, 566
- Hamuy et al. (1992) Hamuy M., Walker A. R., Suntzeff N. B., Gigoux P., Heathcote S. R., Phillips M. M., 1992, PASP, 104, 533
- Iodice et al. (2002) Iodice E., Arnaboldi M., Sparke L. S., Gallagher J. S., Freeman K. C., 2002, A&A, 391, 103
- Kennicutt & Garnett (1996) Kennicutt J. R. C., Garnett D. R., 1996, ApJ, 456, 504
- Kewley et al. (2001) Kewley L. J., Dopita M. A., Sutherland R. S., Heisler C. A., Trevena J., 2001, ApJ, 556, 121
- Kewley & Ellison (2008) Kewley L. J., Ellison S. L., 2008, ApJ, 681, 1183
- Kewley et al. (2006) Kewley L. J., Groves B., Kauffmann G., Heckman T., 2006, MNRAS, 372, 961
- Landolt (1992) Landolt A. U., 1992, AJ, 104, 340
- Lehnert & Heckman (1996) Lehnert M. D., Heckman T. M., 1996, ApJ, 462, 651
- Macciò et al. (2006) Macciò A. V., Moore B., Stadel J., 2006, ApJ, 636, L25
- Mink & Wyatt (1995) Mink D. J., Wyatt W. F., 1995, in Shaw R. A., Payne H. E., Hayes J. J. E., eds, Astronomical Data Analysis Software and Systems IV Vol. 77 of Astronomical Society of the Pacific Conference Series, EMSAO: Radial Velocities from Emission Lines in Spectra. p. 496
- Moiseev et al. (2011) Moiseev A. V., Smirnova K. I., Smirnova A. A., Reshetnikov V. P., 2011, MNRAS, 418, 244
- Mould et al. (2000) Mould J. R., Huchra J. P., Freedman W. L., Kennicutt J. R. C., Ferrarese L., Ford H. C., Gibson B. K., Graham J. A., Hughes S. M. G., Illingworth G. D., Kelson D. D., Macri L. M., Madore B. F., Sakai S., Sebo K. M., Silbermann N. A., Stetson P. B., 2000, ApJ, 529, 786
- Myrrha et al. (1999) Myrrha M. L. M., Vaz L. P. R., Faúndez-Abans M., de Oliveira-Abans M., Soares D. S. L., 1999, A&A, 351, 860
- Oliveira et al. (2008) Oliveira V. A., Copetti M. V. F., Krabbe A. C., 2008, A&A, 492, 463
- Osterbrock (1989) Osterbrock D. E., 1989, Astrophysics of gaseous nebulae and active galactic nuclei
- Pérez-Montero & Contini (2009) Pérez-Montero E., Contini T., 2009, MNRAS, 398, 949
- Pilyugin (2001) Pilyugin L. S., 2001, A&A, 369, 594
- Pilyugin et al. (2007) Pilyugin L. S., Thuan T. X., Vílchez J. M., 2007, Monthly Notices of the Royal Astronomical Society, 376, 353
- Pilyugin et al. (2004) Pilyugin L. S., Vílchez J. M., Contini T., 2004, A&A, 425, 849
- Reshetnikov et al. (2002) Reshetnikov V. P., Faúndez-Abans M., de Oliveira-Abans M., 2002, A&A, 383, 390
- Rodrigues et al. (1999) Rodrigues I., Dottori H., Brinks E., Mirabel I. F., 1999, AJ, 117, 2695
- Schweizer et al. (1983) Schweizer F., Whitmore B. C., Rubin V. C., 1983, AJ, 88, 909
- Shalyapina et al. (2002) Shalyapina L. V., Moiseev A. V., Yakovleva V. A., 2002, Astronomy Letters, 28, 443
- Spavone et al. (2010) Spavone M., Iodice E., Arnaboldi M., Gerhard O., Saglia R., Longo G., 2010, ApJ, 714, 1081
- Spavone et al. (2011) Spavone M., Iodice E., Arnaboldi M., Longo G., Gerhard O., 2011, A&A, 531, A21
- Whitford (1958) Whitford A. E., 1958, AJ, 63, 201
- Whitmore et al. (1987) Whitmore B., McElroy D., Schweizer F., 1987, in P. T. de Zeeuw ed., Structure and Dynamics of Elliptical Galaxies Vol. 127 of IAU Symposium, AM:2020-5050 - an Elliptical Galaxy with an Outer Ring. pp 413–+
- Whitmore et al. (1990) Whitmore B. C., Lucas R. A., McElroy D. B., Steiman-Cameron T. Y., Sackett P. D., Olling R. P., 1990, AJ, 100, 1489
- Whitmore et al. (1987) Whitmore B. C., McElroy D. B., Schweizer F., 1987, ApJ, 314, 439