First Spectroscopic Evidence for High Ionization State and
Low Oxygen Abundance in Ly Emitters
††affiliation: Some of the data presented herein were obtained at the W.M. Keck Observatory,
which is operated as a scientific partnership among the California Institute
of Technology, the University of California and the National Aeronautics and
Space Administration. The Observatory was made possible by the generous
financial support of the W.M. Keck Foundation.
‡‡affiliation: Based in part on data collected at Subaru Telescope,
which is operated by the National Astronomical Observatory of Japan.
Abstract
We present results from Keck/NIRSPEC and Magellan/MMIRS follow-up spectroscopy of Ly emitters (LAEs) at identified in our Subaru narrowband survey. We successfully detect H emission from seven LAEs, and perform a detailed analysis of six LAEs free from AGN activity, two out of which, CDFS-3865 and COSMOS-30679, have [O ii] and [O iii] line detections. They are the first [O ii]-detected LAEs at high-, and their [O iii]/[O ii] ratios and -indices provide the first simultaneous determinations of ionization parameter and oxygen abundance for LAEs. CDFS-3865 has a very high ionization parameter ( cm s-1) and a low oxygen abundance () in contrast with moderate values of other high- galaxies such as Lyman-break galaxies (LBGs). COSMOS-30679 also possesses a relatively high ionization parameter ( cm s-1) and a low oxygen abundance (). Both LAEs appear to fall below the mass-metallicity relation of LBGs. Similarly, a low metallicity of is independently indicated for typical LAEs from a composite spectrum and the [N ii]/H index. Such high ionization parameters and low oxygen abundances can be found in local star-forming galaxies, but this extreme local population occupies only % of the SDSS spectroscopic galaxy sample with a number density times smaller than that of LAEs. With their high ionization parameters and low oxygen abundances, LAEs would represent an early stage of galaxy formation dominated by massive stars in compact star-forming regions. High- galaxies like LAEs would produce ionizing photons efficiently with a high escape fraction achieved by density-bounded Hii regions, which would significantly contribute to cosmic reionization at .
Subject headings:
galaxies: evolution1. INTRODUCTION
Ly emitters (LAEs), galaxies commonly observed at high redshifts with strong Ly emission, are considered to be low-mass, young galaxies as suggested from their small sizes, faint continua, and low masses inferred from spectral energy distribution (SED) fitting (e.g., Venemans et al. 2005; Gawiser et al. 2006; Pirzkal et al. 2007; Overzier et al. 2008; Malhotra et al. 2012). LAEs are therefore likely to represent galaxies in the early stages of galaxy evolution. More directly, Cowie et al. (2011) investigate rest-frame optical nebular lines of LAEs at low redshifts (). The authors find that a large portion of LAEs ( %) have equivalent width (EW) of H Å, and that LAEs on average have lower metallicities and younger ages than the UV-continuum sample. These findings are consistent with the idea that LAEs are galaxies in early stages of galaxy formation. At higher redshifts, LAEs are efficiently detected thanks to narrowband imaging techniques which have enriched our knowledge about the younger universe (e.g., Cowie & Hu 1998; Malhotra & Rhoads 2002; Ouchi et al. 2003; Gawiser et al. 2006; Shimasaku et al. 2006; Gawiser et al. 2007; Gronwall et al. 2007; Ouchi et al. 2008; Nilsson et al. 2009; Guaita et al. 2010; Finkelstein et al. 2011; Nakajima et al. 2012). However, more direct evidence supporting the idea that high redshift LAEs are in an early evolutionary phase of formation is still needed.
The gas-phase metallicity is a key property of galaxies, since it is a record of their star-formation histories. This physical quantity is relatively easily constrained with line ratios of nebular lines at rest-frame optical wavelengths (e.g., Pagel et al. 1979; Kewley & Dopita 2002, and references therein). Another key quantity is the ionization parameter, defined as the ratio of the mean ionizing photon flux to the mean hydrogen atom density. Since the excitation of the Hii region is sensitive to the age distribution of the exciting stars, the ionization parameter provides a rough estimate of age of a galaxy (e.g., Dopita et al. 2006). A large ionization parameter is observed from a galaxy dominated with massive stars, which is a sign that the galaxy is in an early stage of galaxy formation. In addition, the ionization parameter depends on the optical depth in an Hii region (e.g., Brinchmann et al. 2008); a large ionization parameter may be instead due to a low optical depth and a high escape fraction of ionizing photons. Therefore, constraining ionization parameters for LAEs may provide an independent clue to whether or not LAEs, commonly observed star-forming galaxies at high redshift, significantly contribute to the cosmic reionization in the early universe. Determining the ionization parameter requires two emission lines of different ionization stages of a same element, such as [O ii] and [O iii] (e.g., Kewley & Dopita 2002).
However, well-defined samples of LAEs are generally located at very high redshifts (), where rest-frame optical nebular lines are redshifted into infrared wavelengths. Recently, Finkelstein et al. (2011) and Nakajima et al. (2012) instead take advantage of LAEs at moderately high redshifts (), where the nebular lines up to H are observable from the ground in the near-infrared (NIR) windows.
These studies extend the metallicity censuses to galaxies with strong Ly emission. Finkelstein et al. (2011) obtain NIR spectra for two LAEs, and find that at least one LAE appears to be less chemically enriched than continuum-selected galaxies at similar stellar masses (Erb et al. 2006a). Nakajima et al. (2012) estimate average line fluxes for [O ii] and H+[N ii] for LAEs by stacking and m narrowband images for more than LAEs, and place a firm lower-limit for the average metallicity of this population. Interestingly, the lower-limit is higher than expected for its stellar mass at the redshift.
In contrast to the gas-phase metallicities, the ionization parameters of LAEs are unknown. Such measurements have only been obtained for bright galaxies such as Lyman-break galaxies (LBGs) or strongly lensed galaxies at high- (e.g., Pettini et al. 2001; Hainline et al. 2009; Richard et al. 2011). Although the current number of measurements is small, ionization parameters of such high- galaxies are likely to be higher on average than those of local galaxies. A comparison of ionization parameters for LBGs and LAEs will enable us to discuss whether or not LAEs are young galaxies at high redshifts.
In order to obtain reliable measurements of properties including metallicity and ionization parameter of LAEs at high redshifts, we have carried out a large survey for LAEs, using our custom narrowband filter NB387 with Subaru/Suprime-Cam. At , important nebular lines such as [O ii], H, [O iii], H, [N ii], are observable from the ground. Initial results were based on using three narrowbands to detect Ly, [O ii], and H over the same volumes (Nakajima et al. 2012; see also Lee et al. 2012 and Ly et al. 2011 for the two NIR narrowbands and the NewH Survey).
In this paper, we present results from NIR spectroscopy. We used Keck/NIRSPEC and Magellan/MMIRS spectrographs, and successfully detected H emission from seven LAEs. The number is double the previous number of high- LAEs with NIR spectra (two from Finkelstein et al. 2011 and two from McLinden et al. 2011), and allows us to begin to examine statistical variation of rest-frame optical spectroscopic properties of LAEs at . Our first NIR spectroscopic result discusses the kinematics of LAEs and is presented in Hashimoto et al. (2013). As a companion study, this paper presents the ionization and chemical properties of LAEs based on multiple nebular lines. Remarkably, we detected [O ii] and [O iii] lines from two LAEs , which provide ionization parameter estimates for LAEs for the first time. In addition, the oxygen lines allow us to determine oxygen abundances that compliment the previous spectroscopic constraints on metallicity of LAEs from the [N ii]/H index.
We also investigate Ly and H hydrogen lines for LAEs. A comparison of observed Ly/H ratios with the Case B recombination value (Ly/H ; Brocklehurst 1971) provides important insights into the physical mechanisms causing the strong Ly emission in LAEs. Furthermore, we study Ly and H equivalent widths which probe star-formation history, stellar age, and metallicity.
This paper is organized as follows. We describe the data in §2. The detection and measurement of emission lines in the NIR spectroscopy is summarized in §3. In §4, we derive properties of LAEs including estimates of ionization parameter, metallicity, and SFR from the rest-frame optical nebular lines. We also check for the presence of active galactic nuclei (AGN) in the LAEs. In §5, we compare LAEs with other galaxies in terms of their ionization state, metallicity, and SFR. We then discuss the implications. We also discuss the physical properties inferred from Ly and H emission. We conclude the paper in §6 with a summary. Throughout this paper, magnitudes are given in the AB system (Oke 1974), and we assume a standard CDM cosmology with .
2. NIR spectroscopic data
2.1. Sample Construction
| Object | R.A. | Decl. | NB387 | NB387 | NB387 | EW(Ly) | (Ly) | EXPTIME(6)(6)footnotemark: | Instr. | ||
|---|---|---|---|---|---|---|---|---|---|---|---|
| (1) | (1) | (2) | (3) | (3) | (4) | (5) | () | () | () | (7) | |
| COSMOS-08501 | 10:01:16.80 | 02:05:36.26 | N | ||||||||
| COSMOS-13636 | 09:59:59.38 | 02:08:38.36 | N | ||||||||
| COSMOS-30679 | 10:00:29.81 | 02:18:49.00 | N | ||||||||
| COSMOS-30679(†)(†)footnotemark: | |||||||||||
| COSMOS-43982 | 09:59:54.39 | 02:26:29.96 | N | ||||||||
| HHDFN-18325 | 12:36:23.36 | 62:06:05.10 | N | ||||||||
| HHDFN-18431 | 12:36:25.62 | 62:05:37.43 | N | ||||||||
| CDFS-3865 | 03:32:32.31 | 28:00:52.20 | 10800 | N/M | |||||||
| CDFS-6482 | 03:32:49.34 | 27:59:52.35 | 10800 | M | |||||||
| SSA22-8043 | 22:17:47.33 | 00:08:28.36 | 10800 | M | |||||||
Note. — (1) Coordinates are in J2000. (2) NB387 aperture magnitude. The diameter of the aperture is , and the typical error is mag. (3) NB387 and NB387 colors and their errors calculated from aperture magnitudes. (4) Rest-frame EW of Ly emission line in units of Å calculated from NB387 color and redshift of H. For HHDFN objects whose H are not detected, we assume , which corresponds to the wavelength of the peak of the NB387 transmission curve. (5) Flux of Ly emission line in units of erg s-1 cm-2 calculated from EW(Ly) and band total magnitude. (6) Exposure time with NIRSPEC , , and bands in units of second. For the CDFS and SSA22 objects, their and bands spectra were taken with MMIRS using the grism. (7) Instrument used for the spectroscopy. “N” stands for NIRSPEC, and “M” for MMIRS. For CDFS-3865, its band spectrum was obtained with NIRSPEC, and and bands spectra with MMIRS. (†) Values obtained after removing the contribution from an adjacent object (§4.2).
We carried out NB387 ( Å and FWHM Å) imaging observation with Subaru/Suprime-Cam (Miyazaki et al. 2002) on 2009 December 14-16 and 19-20 to search for LAEs. A total of square degrees are covered, with pointings in the following five fields: the Subaru/XMM-Newton Deep Survey (SXDS) field (Furusawa et al. 2008), the COSMOS field (Scoville et al. 2007), the Chandra Deep field South (CDFS; Giacconi et al. 2001), the Hawaii Hubble Deep Field North (HHDFN; Capak et al. 2004), and the SSA22 field (e.g., Steidel et al. 2000). The first results of the NB387 survey in the SXDS field have been presented in Nakajima et al. (2012). For the other fields, we select LAE candidates in the same manner as presented in Nakajima et al. (2012), and a summary of the full square degrees survey will be presented elsewhere (K. Nakajima et al. in preparation). Briefly, objects which are bright in NB387 compared to the and bands are selected as LAE candidates. The color criterion for SXDS, COSMOS, and SSA22 is , while for CDFS and for HHDFN. These criteria results in selecting objects with emission line possessing EW Å. The photometric errors in NB387 (or NB387) are additionally used as the minimum excess for an object to enter the sample. Note that this narrowband excess criterion is only significant for CDFS, where broadband data are shallow with respect to the NB387 data. Although a much deeper U-band data exist in CDFS (Nonino et al. 2009), we use the shallower U-band since it has a wider coverage111 In addition, CDFS-3865 is located near the edge of the deeper image. . Since the U-band data is not directly used when deriving physical properties, the shallowness is not significant in this paper. Interlopers such as [O ii] emitters, Civ emitters, or active galactic nuclei (AGNs) are removed from the catalog by using UV, X-ray and/or radio data.
Seven candidates were selected for NIRSPEC follow-up. We selected COSMOS-13636, COSMOS-30679, and COSMOS-43982, since their Ly spectra had been obtained with Magellan/MagE (M. Rauch et al. in preparation). COSMOS-08501, HHDFN-18325, and HHDFN-18431 were selected because of their large Ly equivalent widths and fluxes measured from the NB387 imaging data. CDFS-3865, whose rest-frame optical spectrum has in part already been taken with MMIRS, was also observed with NIRSPEC for its [O ii] detection. Table 1 summarizes the details of the sample.
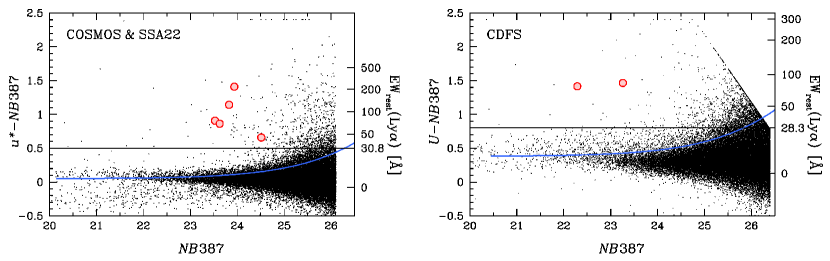
For the MMIRS observation, we observed CDFS and SSA22 fields with one mask each. Details of the observation and data reduction procedures are presented in Hashimoto et al. (2013). Briefly, we found three LAEs in which we identified H emission. In this paper, we make use of the spectra of the three LAEs; CDFS-3865, CDFS-6482, and SSA22-8043 (Table 1). Figure 1 shows the distributions of the LAEs presented in this paper on the NB387 versus NB387 color magnitude diagram.
2.2. NIRSPEC Observation
The observations were carried out on 9–10 February 2011. Both nights were photometric. We observed in low-resolution mode, with a slit width of and a slit length of 222 The effective slit length is , since we did not place objects in from the edges of the slit. . We observed all six candidate with Nirspec-6 filter (hereafter referred to as band). In addition, we observed COSMOS-30679 with Nirspec-5 ( band) and Nirspec-3 ( band), and CDFS-3865 with band. The wavelength ranges of , , and bands are –m, –m, and –m, respectively for our configurations. The resolution in the band is . Exposure times for each object are given in Table 1.
| Object | [O ii] | H | [O iii] | [O iii] | H | [N ii] |
|---|---|---|---|---|---|---|
| COSMOS-08501 | ||||||
| COSMOS-13636 | ||||||
| COSMOS-30679 | (†)(†)footnotemark: | (†)(†)footnotemark: | ||||
| COSMOS-43982 | ||||||
| Composite($\star$)($\star$)footnotemark: | ||||||
| CDFS-3865 | ||||||
| CDFS-6482 | ||||||
| SSA22-8043 |
Note. — Fluxes and their errors are given in unit of erg s-1 cm-2. For lines with less than the detection level, we list their upper-limits. () Composite spectrum of the four objects (§4.1). (†) These lines suffer badly from OH-lines subtraction errors.
Our science targets were acquired using the invisible object acquisition procedures. In this mode, an alignment star brighter than was placed in the slit simultaneously with a science target. We first acquired the star at the center of the slit, then we nodded the telescope so that both the science target and the star were on the slit with the same distance from the slit center. For CDFS-3865 and HHDFN-18431, since we could not find any stars to place on the slit along with them, we first acquired the nearest star to the target (at distances of for CDFS-3865 and for HHDFN-18431), then nodded the telescope with an offset, which was calculated from the WCS difference between the star and the science target. For HHDFN-18325, although a star was found at a distance of , which is smaller than the slit length, half of the observation was done without the star in order to avoid the persistence caused by the previous target alignment star. During an exposure, we manually guided the slit using the slit-viewing camera; if the star started to drift out of the slit, we manually moved the slit so that the star (and thus the invisible science target) stayed in the slit throughout each exposure.
Standard stars, which were selected from the Hipparcos catalog to have A0V spectral type and similar airmass to the science targets, were observed at the beginnings and the ends of the nights. The calibration data were taken in an ABBA position pattern, while the science data in AB position pattern.
2.3. NIRSPEC Data Reduction
We used the Keck IRAF-based WMKONSPEC package333 http://www2.keck.hawaii.edu/inst/nirspec/wmkonspec.html to reduce the data. We also used IRAF scripts that were originally written for reducing near-infrared multi-object spectroscopic data from Subaru/MOIRCS (MCSMDP; Yoshikawa et al. 2010).
The data reduction process included bias subtraction, flat fielding, distortion correction, wavelength calibration, cosmic ray rejection, (A-B) sky subtraction, residual background subtraction, image shifting, and stacking. We used the bias and flat data that were obtained in the same night as the science data. We performed wavelength calibration using OH-lines by comparing them with an OH-line list (Rousselot et al. 2000). For cosmic ray rejection, we used LA.COSMIC (van Dokkum 2001). The sky and OH-lines of an A-position image were roughly removed by subtracting an average B-position image created from the previous and following images. We then removed the residual sky by subtracting a -th order polynomial fit in the spatial direction after masking columns of positive and negative parts caused by the alignment star and the object. Individual images were shifted in spatial direction so that the object is in the same position both in A-position and B-position images. The offset values were derived from the position differences of the alignment stars. When no star was observed simultaneously, we defined the offset values as the nod separation size. Finally, we stacked the position-matched individual images to create the two-dimensional (2D) spectra.
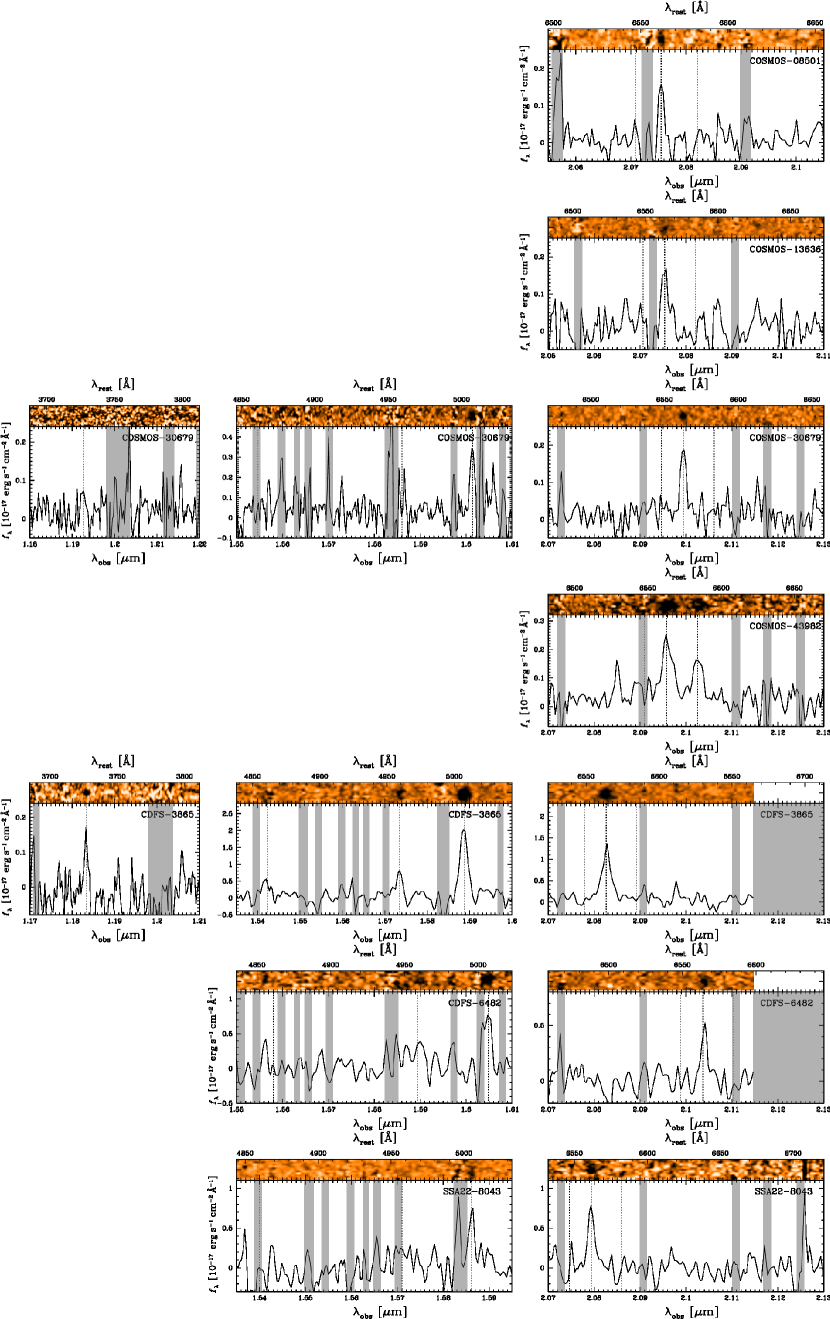
We obtained flux solutions by comparing spectra of the A0V standard stars and a model, which was created by a stellar spectral synthesis program (SPECTRUM; Gray & Corbally 1994) based on the Kurucz (1993)’s atmosphere models. The model spectra were then normalized so that their , , and band magnitudes matched with those of standard stars, whose photometry was obtained from the Two Micron All Sky Survey (2MASS) All-Sky Point Source Catalog. The one-dimensional (1D) spectra were extracted by summing up – pixels in the spatial direction. The lengths of columns were determined based on the seeing conditions; about two times the seeing size was used. We also confirmed that the sizes were large enough to detect most of the signal, and maximize the signal-to-noise (S/N) ratio. The 1D and 2D spectra are shown in Figure 2. We note in addition that the science targets and the standard stars used for the flux calibrations were observed and reduced with almost the same conditions, thus effects of slit losses were also corrected in the procedures, since the standard spectra extracted in the procedure were normalized to have the total magnitude of that star. LAEs typically have half-light radii kpc ( at ; Bond et al. 2009), which is much smaller than the seeing size. Therefore, we cannot resolve LAEs with our observations, and assuming the PSF profile for the LAEs is reasonable.
Emission line fluxes were measured by fitting a Gaussian profile to each
line with the IRAF task splot. The sky noise level was estimated
in the following manner; we prepared an aperture box, which had
approximately twice the seeing size in spatial direction and twice the
FWHM of the best fit Gaussian to the emission line in wavelength direction.
We spread more than aperture boxes around the emission line after
masking pixels heavily contaminated by OH-lines, and measured their
photon counts. We then fit the histogram of the counts with a Gaussian,
and regarded its as the fluctuation for the aperture
used to measure the emission line.
The line flues and their errors are summarized in Table
2.
3. Emission Line Detections
3.1. H detection
We detect significant H emission in band 2D spectra for COSMOS-08501, COSMOS-13636, COSMOS-30679, COSMOS-43982, CDFS-3865, CDFS-6482, and SSA22-8043, but we do not identify any emission lines for the other two LAEs, HHDFN-18325 and HHDFN-18431. Both LAEs are expected to have strong Ly, hence strong H. A possible reason why we do not detect lines for HHDFN-18431 is that no alignment star was observed simultaneously, and the object may have drifted significantly out of the slit. The same issue may explain the non-detection of H for HHDFN-18325, since half of the observation was done without an alignment star (§2.2). Since we have not yet obtained Ly spectra for the two objects, the non-detections may be alternatively due to the mis-selection of LAEs. Future optical spectroscopy is needed to resolve this issue. In the following sections, we use the seven LAEs with reliable H detection.
3.2. Other emission line detections
| COSMOS sample(1)(1) data are obtained from Subaru/Suprime-Cam, data from UKIRT/WFCAM, data from CFHT/WIRCAM, and data from Spitzer/IRAC. All data are collected from the COSMOS Archive. | ||||||||||||
|---|---|---|---|---|---|---|---|---|---|---|---|---|
| COSMOS-08501 | ||||||||||||
| COSMOS-13636 | ||||||||||||
| COSMOS-30679 | ||||||||||||
| COSMOS-30679(†)(†)footnotemark: | ||||||||||||
| COSMOS-43982 | ||||||||||||
| (limitmag) | ||||||||||||
| (limitmag)(†)(†)footnotemark: | ||||||||||||
| CDFS sample(2)(2) data are obtained from MPG/ESO 2.2m/WFI, data from CTIO/MOSAIC II, data from CTIO/ISPI, data from NTT/SOFI, and data from Spitzer/IRAC. Optical and NIR data are collected from the MUSYC Public Data Release (Gawiser et al. 2006), and Spitzer data from the SIMPLE Legacy II project. | ||||||||||||
| CDFS-3865 | ||||||||||||
| CDFS-6482 | ||||||||||||
| (limitmag) | ||||||||||||
| SSA22 sample(3)(3) data are obtained from Subaru/Suprime-Cam, data from KPNO/NEWFIRM, data from UKIRT/WFCAM, and data from Spitzer/IRAC. Optical data are provided by T. Hayashino (see also Hayashino et al. 2004), data are obtained from the NewH survey (Ly et al. 2011; Lee et al. 2012). data are collected from the WFCAM data access page, and Spitzer data from the Spitzer Heritage Archive. | ||||||||||||
| SSA22-8043 | ||||||||||||
| (limitmag) |
Note. — Broadband photometry of the LAEs. All magnitudes are total magnitudes. 99.99 mag means no signal detected. Magnitudes in parentheses are uncertainties adopted in SED fitting.
For CDFS-3865, we additionally obtain [O ii], H, and [O iii] emission lines. Combined with the H-detection, a full suite of prominent rest-frame optical nebular lines are thus obtained for this object. We note that the [O ii] flux may be underestimated due to the possible flux loss caused by the guiding drift issue known to NIRSPEC. Since CDFS-3865 was observed with NIRSPEC without any alignment star simultaneously, the maximum flux loss caused by the guiding drift ( per hour; private communication with NIRSPEC support scientists) could be comparable to the observed value. However, we do not know the drift direction, and the true flux loss cannot be estimated. Therefore, we do not correct for any flux loss for [O ii]. We emphasize that the possible factor uncertainties in [O ii] flux do not change our main results (§4.3). For COSMOS-30679, we obtain [O ii] and [O iii] emission lines, while we do not identify H and [O iii], because they fall in a dense OH-line wavelength range. We thus cannot place meaningful upper limits on their fluxes. When fluxes for these lines are required for inferring physical properties, we assume a value of for the [O iii] ratio (e.g., Richard et al. 2011) and calculate the H flux based on the observed H flux, the intrinsic H/H ratio assuming Case B recombination (2.86; Osterbrock 1989), and the dust extinction estimated from SED fitting. We have checked for CDFS-3865 that the H flux estimated in this way is consistent with the really observed H flux (see also §4.2). We emphasize that the two LAEs, CDFS-3865 and COSMOS-30679, are the first [O ii]-detected LAEs individually at high-. The [O ii]+[O iii] lines provide the simultaneous determinations of ionization state and oxygen abundance (§4.3).
For CDFS-6482 and SSA22-8043, we detect [O iii] while we do not identify H and [O iii], probably due to the contamination by OH-lines and the limited sensitivity of the instrument (More detailed descriptions about the MMIRS objects are provided by Hashimoto et al. 2013). For COSMOS-43982, we clearly detect [N ii] emission line, which is not identified for the other LAEs. The [N ii]-detection suggests a non-negligible contribution of AGN to the emission lines for the object. Further investigations of AGN contamination are discussed in §4.1.
4. Physical Properties of LAEs
4.1. Removal of objects with AGN
AGN, as well as star-formation, can produce large amounts of ionizing photons, and show strong Ly. Since our interest is star-forming LAEs, we need to remove LAEs with AGN activity from the sample.
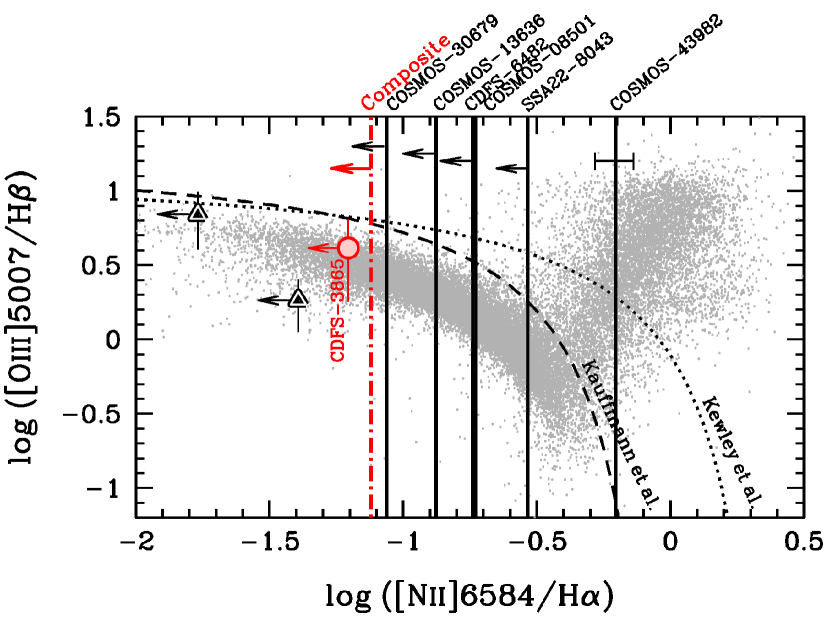
During the LAE sample selection, bright LAEs with AGN signature have been removed (see Nakajima et al. 2012). Obvious AGNs are therefore excluded from the sample. However, the procedure is not always perfect, and can miss objects with relatively weak AGN activity. In order to assess possible contamination of AGN in our LAE sample, we plot our LAEs on a BPT diagram (Figure 3; Baldwin et al. 1981) which is widely used to separate star forming galaxies from AGN. In Figure 3, the underlying small gray points denote the spectroscopic objects from the Sloan Digital Sky Survey (SDSS; York et al. 2000)444 We use a part of the spectroscopic data taken from the MPA-JHU DR7 release of spectrum measurements: http://www.mpa-garching.mpg.de/SDSS/DR7/ . The two curves shown in Figure 3 are the empirical demarcations (Kewley et al. 2001; Kauffmann et al. 2003). Since only one LAE, CDFS-3865, has both [O iii] and H, all the other LAEs are shown with vertical lines. Due to the non-detection of [N ii], the vertical lines show upper-limits of [N ii]/H except for COSMOS-43982, which has an individual [N ii] detection. Based on its relatively high [N ii]/H ratio, COSMOS-43982 may be contaminated by an AGN, though there remains a possibility that this LAE may be a star-formation dominated galaxy with a very small [O iii]/H ratio. For this analysis, we choose to be conservative and regard the object as a candidate possessing AGN activity. The properties of COSMOS-43982 are considered and interpreted carefully in the following sections.
| Object | |||||
|---|---|---|---|---|---|
| () | (mag) | (yr) | () | ||
| COSMOS-08501 | |||||
| COSMOS-13636 | |||||
| COSMOS-30679 | |||||
| COSMOS-30679(†)(†)footnotemark: | |||||
| COSMOS-43982 | |||||
| CDFS-3865 | |||||
| CDFS-6482 | |||||
| SSA22-8043 |
Note. — Physical properties and their errors of LAEs from SED fitting. Stellar metallicity is fixed to . Escape fraction of ionizing photons is fixed to . (†) Values obtained after removing the contribution from an adjacent object (§4.2).
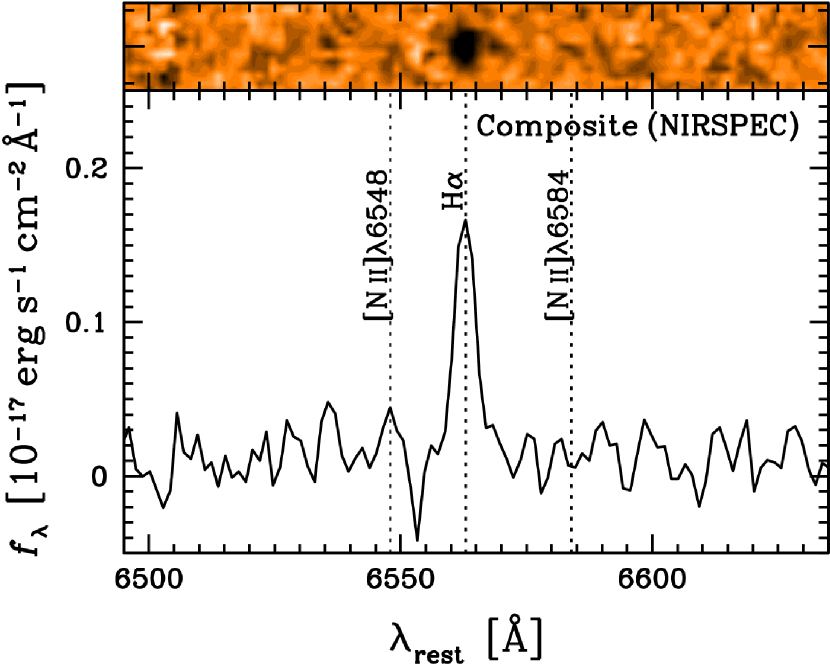
For CDFS-3865, thanks to its relatively strong constraint on [N ii]/H, we can see that the object is along the star forming sequence and has negligible AGN activity, similar to two other LAEs with spectroscopic follow-up at similar redshifts (Finkelstein et al. 2011). Although the other LAEs have no constraint on their -axis values, AGN contributions to them are assumed to be minimal, since there are few AGNs in the range ([N ii]/H) , as suggested from the underlying SDSS galaxies. In order to check the assumption, we stack the band spectra of the four NIRSPEC-detected LAEs555 We do not use the MMIRS spectra due to their worse sensitivity and spectral resolution. with inverse-variance weights. The composite spectrum is shown in Figure 4, and provides an average, deeper constraint on [N ii]/H ratio for the LAEs. The red dot-dashed line in Figure 3 shows the upper-limit of [N ii]/H ratio constrained by the composite spectrum. The line is further away from the area occupied with AGNs. Therefore, AGN activity is on average negligible for the LAEs. In the following sections, we regard all the LAEs except for COSMOS-43982 as galaxies dominated by star-formation.
4.2. Stellar Mass and E(B-V) from SED fitting
We perform SED fitting to broadband photometry to infer properties of the
stellar populations. The majority of images are collected from publicly
available databases (see notes in Table 3). The
optical and NIR photometry is done with a diameter aperture
using the double-image mode of SExtractor (Bertin & Arnouts 1996). The aperture
magnitudes are then converted into total magnitudes using aperture
correction values, which are estimated from differences between aperture
magnitudes and MAG_AUTO values for point sources. For the IRAC
imaging, we use a diameter aperture and Yan et al. (2005)’s
aperture correction values. Table 3 summarizes the
results.
| Object | SFR | SFRcor | EW(H) | (H) | EW(Ly) | (Ly) | AGN | |||
|---|---|---|---|---|---|---|---|---|---|---|
| ( cm s-1) | () | () | (Å) | ( erg s-1) | (Å) | ( erg s-1) | (10) | |||
| (1) | (2) | (3) | (4) | (5) | (6) | (7) | (8) | (9) | ||
| COSMOS-08501 | ||||||||||
| COSMOS-13636 | ||||||||||
| COSMOS-30679(†)(†)footnotemark: | ||||||||||
| COSMOS-43982 | ||||||||||
| CDFS-3865 | ||||||||||
| CDFS-6482 | ||||||||||
| SSA22-8043 | ||||||||||
Note. — (1) Oxygen abundance derived from -index (§4.3). If [N ii] is undetected, upper-limit is given. (2) Oxygen abundance derived from -index (§4.3). Ionization parameter is derived at the same time. (3) Ionization parameter ( cm s-1) estimated from the [O iii]/[O ii] ratio and (§4.3). (4) Star formation rate () derived from uncorrected H luminosity (§4.4). (5) Star formation rate () derived from H luminosity after correcting for extinction derived from SED fitting (§4.4). (6) Rest-frame equivalent width of H (Å; §4.5). (7) Observed luminosity of H ( erg s-1). (8) Rest-frame equivalent width of Ly (Å; see Table §1). (9) Observed luminosity of Ly ( erg s-1). (10) Flag of AGN (§4.1): AGN candidates are flagged with ””. (†) Values obtained after removing the contribution from an adjacent object (§4.2).
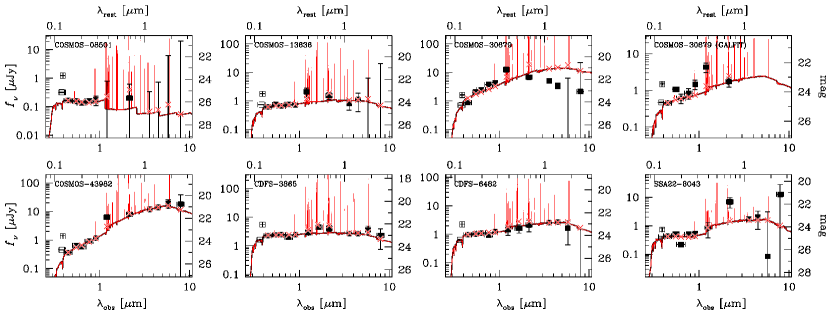
The procedure of the SED fitting is the same as that of Ono et al. (2010a), except for fixed redshifts, which are derived from H. Briefly, we use the stellar population synthesis model GALAXEV (Bruzual & Charlot 2003) for stellar SEDs, and include nebular emission (Schaerer & de Barros 2009). We set the escape fraction of ionizing photons () as . Such low has been suggested for LBGs (e.g., Shapley et al. 2006; see also Iwata et al. 2009). Recently, Nestor et al. (2013) suggest that faint LAEs may have a higher (–) in contrast with bright LBGs. We have checked that even if we assume , the derived quantities do not change significantly. We adopt a Salpeter initial mass function (IMF; Salpeter 1955) with lower and upper mass cut-offs of and . We choose constant star-formation history and the stellar metallicity . For dust extinction, we use Calzetti’s extinction law (Calzetti et al. 2000) on the assumption of as proposed by Erb et al. (2006b), although this assumption is still debatable for high- galaxies (e.g., Förster Schreiber et al. 2009; Ly et al. 2012)666 Adopting (Calzetti et al. 2000) decreases ionization parameters (§4.3) by a factor of , but the changes are smaller than their errors. Changes in metallicities are also small compared with the errors. . Intergalactic medium (IGM) attenuation is calculated using the prescription given by Madau (1995). These assumptions are usually used for SED fitting for high- LAEs. E.g., Guaita et al. (2011) test three different star-formation histories when performing SED fitting to stacked LAEs, and find equally good fits to the data. The authors also note that SED fitting can relatively well constrain stellar mass and dust extinction among the free parameters. The derived properties are given in Table 4, and the best-fit SEDs are shown in Figure 5.
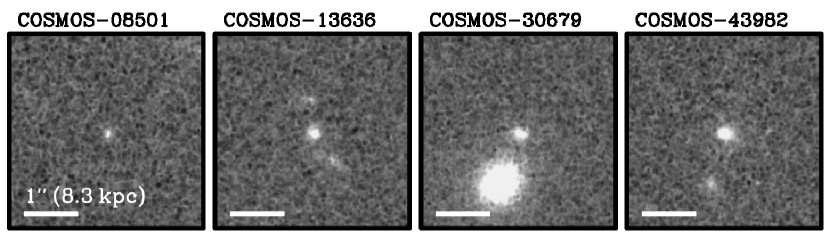
One problem is that COSMOS-30679 was found to be blended with another brighter adjacent object via examination of the COSMOS HST/ACS F814W imaging data (Figure 6). In order to deblend this object, we use the galaxy profile fitting software GALFIT (v3.0; Peng et al. 2010). We first run GALFIT in the band and fit both objects simultaneously. Then, we perform fittings in other bands by fixing parameters (except for brightnesses) to those derived in the band fitting and derive the deblended photometry, which is listed in Table 4. We confirm that the band brightness estimated from the deblended object is consistent with the photometry in the HST/ACS F814W high-resolution image within their errors. We add residuals after subtracting the fitted profiles into the photometric errors in quadrature, so that those errors are used in the SED fitting. Since the adjacent object appears dominant at longer wavelengths and deblending gets less reliable, we do not perform the deblending for the IRAC images. We therefore fit the SED of COSMOS-30679 after deblending without the IRAC data. The best fit SEDs of COSMOS-30679 after and before deblending are shown in upper right two panels in Figure 5. Although the bumpy shape of the SED after the deblending suggests additional contamination from the adjacent object, the fitting is acceptable (relatively small value) compared with that obtained before deblending. In the following sections, we use the quantities after deblending.
We obtain from our sample stellar masses ranging from to and dust extinction to (except for the AGN LAE). These results are consistent with the previously recognized trend that LAEs at are diverse, unlike higher redshift counterparts (e.g., Nilsson et al. 2011). We also find that dust extinctions estimated from the H/H ratio and SED fitting are consistent with each other for CDFS-3865 (Hashimoto et al. 2013). This supports our assumption that the dust extinction from SED fitting under the assumption of can be reasonably applied for the extinction correction of nebular lines.
4.3. Ionization Parameter and Metallicity
The ionization state in an Hii region is often characterized by the ionization parameter, 777 We use the subscript “” for the ionization parameter to distinguish it from the -parameter which stands for the effect of dust on Ly compared with UV-continuum (§5.2.1). , which is the ratio of the mean ionizing photon flux to the mean hydrogen atom density. Larger means the Hii region is more highly ionized, probably achieved by a harder ionizing spectrum. Consequently, emission lines with higher ionization potentials are expected to be observed more strongly with increasing . In this sense, the ionization parameter is well determined using ratios of emission lines of different ionization stages of the same element, such as the [O iii]/[O ii] ratio (e.g., Kewley & Dopita 2002). However, the [O iii]/[O ii] ratio depends not only on ionization state but also on gas metallicity (Fig. of Kewley & Dopita 2002). Since the gas temperature decreases as gas metallicity increases, the far infrared fine-structure cooling by doubly ionized species (i.e., O2+) becomes efficient when the gas metallicity is high (e.g., Charlot & Longhetti 2001; Dopita et al. 2000), resulting in a decrease of [O iii] line in optical. Conversely, metallicity estimates using -index (Pagel et al. 1979):
| (1) |
are affected by the ionization parameter to some extent (e.g., Kewley & Dopita 2002; Nagao et al. 2006). Therefore, we combine the [O iii]/[O ii] ratio and -index (both corrected for dust extinction estimated from SED fitting) to estimate its ionization parameter and metallicity at the same time iteratively. We assume in this section for simplicity. The possible effect of non-zero escape fractions will be discussed in §5.1.1.
We describe the procedure for CDFS-3865 as an example. As an initial guess of metallicity, we use the empirical indicator determined by local galaxies (Maiolino et al. 2008). We obtain two solutions and . We then use another alternative indicator, -index defined as [N ii]/H (Maiolino et al. 2008). The upper-limit of [N ii]/H provides an upper-limit of metallicity (), which removes the high-metallicity solution by -index at the level. Therefore, the empirical relation yields the metallicity . As the second step, we use this metallicity and the [O iii]/[O ii] ratio to estimate its ionization parameter. Kewley & Dopita (2002) calculate the relations between [O iii]/[O ii] ratio and ionization parameter with discrete values of metallicity. Among them, our initial guess of metallicity corresponds to their lowest metallicity (; Allende Prieto et al. 2001). By using the relation, we find that the high [O iii]/[O ii] ratio can only be reproduced with ionization parameters as high as several times cm s-1. As the third step, we recalculate its metallicity from the Kewley & Dopita (2002)’s relation (-index) for the ionization parameter cm s-1, and obtain 888 Using the cm s-1 relation does not change the metallicity estimate significantly ( dex lower). . Finally, we recalculate its ionization parameter based on the metallicity and Eq. (12) of Kewley & Dopita (2002)999 Although the original relations are suspended at cm s-1, we extend their polynomials toward higher values. , and obtain cm s-1. This is consistent with the assumed ionization parameter in the third step ( cm s-1). We check that further iterations do not change our final solutions. To summarize, CDFS-3865 has the ionization parameter cm s-1 and the metallicity .
In the same manner, we estimate COSMOS-30679’s ionization parameter and metallicity to be cm s-1 and , respectively. Since COSMOS-30679 does not have H, its strength is inferred from H assuming the Case B and the dust extinction. In addition, its broadband SED is fitted after being deblended with the adjacent object (§4.2). Therefore, the object may possess larger uncertainties.
For the LAEs without [O ii], we estimate their metallicities by using the empirical -index relation, and no constraint on ionization parameters is provided for them. The metallicities and the ionization parameters are summarized in Table 5.
4.4. SFR
The H luminosity is thought to be the most reliable SFR indicator relative to those based on the rest-frame UV and optical spectral features. Indeed, it is proportional to the birth rate of massive stars as well as being relatively insensitive to dust extinction as compared with UV-continuum. We measure the SFR of the LAEs from the H luminosity using the relation (Kennicutt 1998):
| (2) |
In Table 5, we summarize the derived SFRs.
4.5. H Equivalent Width
We calculate the H equivalent width of an object from the H flux divided by its continuum flux density derived from band photometry. To estimate the proper continuum, however, we have to remove the contribution of the H emission on the band photometry. We follow the prescription given in the appendix of Guaita et al. (2010) (see also Finkelstein et al. 2011):
| (3) |
where is the amount of flux that H line contributes to the band photometry, is the observed H flux, is the ratio between the filter transmission at and the maximum of the band transmission function, and is the band filter transmission at a given wavelength. The flux estimated from the calculation is subtracted from the band photometry. The corrections span from (COSMOS-43982) to as much as mag (CDFS-3865). Since COSMOS-08501 is not detected in the band, we use the lower-limit of the band photometry. We thus obtain an upper-limit of the continuum (correction mag), hence a lower-limit of the EW(H) for COSMOS-08501. The derived EWs(H) are listed in Table 5.
5. Discussion
In this section, we discuss the physical properties of LAEs determined by this study in conjunction with Finkelstein et al. (2011) and Nakajima et al. (2012). In the first subsection, we make comparisons in terms of ionization parameter, metallicity, and SFR of LAEs at as well as lower-redshifts, and other galaxies at similar redshifts such as LBGs. We then examine the implications. In the second subsection, we show the properties of LAEs newly found by spectroscopy based on Ly and H hydrogen recombination lines. We extend the discussion to understanding the origins of the strong Ly emission observed in LAEs.
5.1. Comparisons between LAEs and other galaxies
5.1.1 Ionization State
We find high ionization parameters for the LAEs. In this section, we examine this point further by comparison to other galaxies, and discuss its implications.
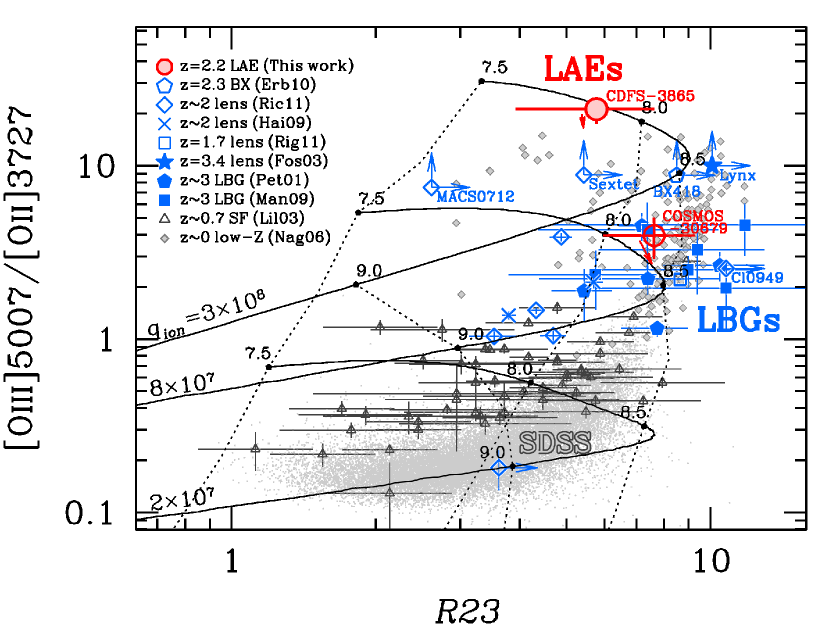
The situation is most clearly seen in Figure 7, which shows the [O iii]/[O ii] ratio versus -index. We plot CDFS-3865 and COSMOS-30679 (red circles), and other galaxies such as LBGs at – (blue symbols). The black grid represents model predictions of [O iii]/[O ii] ratio and -index at a given metallicity and (discrete) ionization parameter (Kewley & Dopita 2002). According to the calculation, CDFS-3865 is close to the cm s-1 curve. This confirms its high ionization parameter and low oxygen abundance. The high ionization parameter is suggestive of CDFS-3865 showing a very hard ionizing spectrum. Therefore, one of the most straightforward interpretations is that CDFS-3865 is a young galaxy dominated by massive stars in possibly small star-forming regions (expected for young Hii regions). Its low metallicity () and large EW(H) ( Å) also support this idea (see also §5.1.2). The idea of LAEs being less-evolved galaxies is consistent with previous photometric results, such as low stellar masses (e.g., Pirzkal et al. 2007; Ono et al. 2010b) and small sizes (e.g., Bond et al. 2009; Malhotra et al. 2012).
Compared to CDFS-3865, most other – galaxies appear to have lower ionization parameters. Notable exceptions are objects found by Fosbury et al. (2003), Erb et al. (2010), and (partly) Richard et al. (2011). Fosbury et al. (2003) and Erb et al. (2010) reveal from their multi-emission lines analysis that their galaxies possess high ionization parameters ( cm s-1), low metallicities ( or less), being roughly comparable to (or more or less extreme than) those found in CDFS-3865. Interestingly, both galaxies turn out to exhibit strong Ly emission. This supports our suggestion that strong Ly galaxies are in part represented by young galaxies. Richard et al. (2011) also find two lensed galaxies (blue diamonds with upward arrow) possibly have high ionization parameters ( cm s-1) judged from their metallicities determined empirically ( and , for Sextet and MACS0712, respectively). Unfortunately, Ly measurements are not given in Richard et al. (2011).
However, as indicated by COSMOS-30679, LAEs’ ionization parameters are unlikely to be always very high. The ionization parameter for COSMOS-30679 is estimated to be cm s-1, relatively high but comparable to those found in other high- galaxies (e.g., Hainline et al. 2009) or LBGs (e.g., Mannucci et al. 2009), although the error is very large. COSMOS-30679 is thus considered to be more evolved than CDFS-3865, suggested from its relatively higher metallicity, smaller EW(H), older age estimated from SED fitting, and smaller ionization parameter.
Next, we compare our LAEs with galaxies seen in the local universe. In Figure 7, the gray dots indicate SDSS galaxies with (Tremonti et al. 2004; Kewley & Dopita 2002) whose metallicities are derived by applying photoionization models to the most prominent optical emission lines ([O ii], H, [O iii], H, [N ii], [S ii]). They thus represent typical local galaxies. According to Dopita et al. (2006), the SDSS galaxies have ionization parameters cm s-1 on average. Galaxies at – including the LAEs appear to have systematically higher ionization parameters than the SDSS galaxies. Galaxies at intermediate redshift (; Lilly et al. 2003) are also plotted in Figure 7. They appear to fall between galaxies and the SDSS galaxies in Figure 7, showing systematically higher [O iii]/[O ii] ratios than the SDSS galaxies. Since their metallicities are comparable to those of the SDSS galaxies (Lilly et al. 2003; Tremonti et al. 2004), the higher [O iii]/[O ii] ratios are likely due to their somewhat higher ionization parameters. Combined with the findings of much higher [O iii]/[O ii] ratios in – galaxies, higher- galaxies tend to have higher ionization parameters.
Another interesting comparison is with the low-metallicity galaxies in the local universe. The gray diamonds in Figure 7 show local low-metallicity galaxies with (Nagao et al. 2006) whose metallicities are measured with the direct Te method (e.g., Izotov et al. 2006). Unlike typical SDSS galaxies, they appear in almost the same parameter space occupied by high- galaxies on Figure 7. Since their low-metallicities are determined by the direct Te method and thus reliable, the high [O iii]/[O ii] ratios can be interpreted as due to high ionization parameters. Indeed, from the comparison between [O iii]/[O ii] ratios and photo-ionization models given in Nagao et al. (2006), it is inferred that local low-metallicity galaxies typically have higher ionization parameters ( cm s-1, or higher) than more metal-rich galaxies seen in the SDSS sample. Therefore, these low-metallicity galaxies in the local universe appear to have similar metallicities and ionization parameters as high- star-forming galaxies including LBGs, and particularly those with extreme quantities are likely analogs of high- LAEs such as CDFS-3865 in terms of their high ionization parameters and low metallicities.
One such extreme population is star-forming luminous compact galaxies (LCGs), or popularly referred to as “green pea” galaxies (GPs; Cardamone et al. 2009). The GPs are found in the SDSS spectroscopic sample101010 Hence some of the GPs overlap with the local low-metallicity galaxies plotted with the gray diamond on Figure 7. to have green colors in the SDSS composite images, caused by the very strong [O iii] emission lines with EWs of Å falling into the band. They show low metallicities (; Amorín et al. 2010) and high ionization parameters ( cm s-1) inferred from their high [O iii]/[O ii] ratios (Jaskot & Oey 2013), analogous to those observed in the LAEs. Their SFRs are also comparable to those for LAEs (Izotov et al. 2011), in contrast with more modest SFRs seen in typical local low-metallicity galaxies (e.g., Lee et al. 2004). A similar discussion is also provided by Xia et al. (2012).
In the SDSS Date Release 7 (DR7) spectroscopic galaxy sample, GPs are found (Cardamone et al. 2009). Searching the entire SDSS DR7 spectroscopic sample yields objects which fall in the GPs redshift range (–; Cardamone et al. 2009) and are classified as GALAXY. Therefore, the GPs occupy only % of the SDSS galaxy sample. Based on the luminosity function determined for the SDSS galaxies (Blanton et al. 2003), the number density is Mpc-3 above a detection limit , which corresponds to . The limit is calculated from the apparent magnitude limit (; Tremonti et al. 2004) for the spectroscopic sample and the redshift threshold (; Nagao et al. 2006). The number density of the GPs is thus approximately Mpc-3, which is almost consistent with the number density found by Cardamone et al. (2009) ( GPs per deg2). On the other hand, the number density of LAEs at is Mpc-3 calculated by integrating the luminosity function provided by Hayes et al. (2010)111111 The detection limit is erg s-1 (). above . The number density of the GPs is thus almost two order of magnitude smaller than that of LAEs. Therefore, if the GPs alone represent galaxies with high ionization parameter in the local universe, although it is still uncertain, the large difference of abundances between LAEs and the GPs suggests that such galaxies appear to be much more abundant at high- while rarely seen in the local universe.
The final noteworthy implication of the high ionization parameters found in high- LAEs is that such galaxies may provide additional photons that cause hydrogen reionization of the IGM in the early universe. Previous censuses of early galaxies have revealed a possible shortage of ionizing photons for the cosmic reionization (e.g., Ouchi et al. 2009; Robertson et al. 2010). Ouchi et al. (2009) find that the universe could not be totally ionized by only galaxies at if there is no evolution of properties (e.g., escape fraction of ionizing photons (), metallicity, dust extinction) from to . One approach to resolve the problem is to adopt larger , which may be the case for galaxies with higher ionization parameter. Since lower ionization species such as [O ii] dominate in the outer regions of an usual, ionization-bounded Hii region (e.g., Shields 1990; Oey & Kennicutt 1997), a density-bounded Hii region will show a larger [O iii]/[O ii] ratio. Therefore, an ionization parameter depends not only on the hardness of the ionization radiation field but on the optical depth in an Hii region (e.g., Brinchmann et al. 2008; Giammanco et al. 2005); higher ionization parameters are expected to be observed from optically thin, density-bounded Hii regions. E.g., Giammanco et al. (2005) calculate that in the condition of density bounding, an Hii region with = shows the same ionization parameter as a region with greater ionizing flux without any photon escape. Consequently, the high ionization parameters found in the LAEs may be due to a low optical depth and a high , probably achieved by density-bounded Hii regions.
Although exact geometries of Hii regions in LAEs are sill uncertain, the LAE’s optically thin property has been suggested by recent studies. E.g., Hashimoto et al. (2013) investigate the kinematics of the galaxy scale outflows for LAEs using both Ly emission and strong metal absorption lines, finding a tendency that LAEs have smaller values of neutral hydrogen column density in contrast with LBGs. Theoretically, Yajima & Li (2012) also suggest a completely ionized, optically thin phase can exist for LAEs. Therefore, the high ionization parameters may suggest LAEs can possess higher , in contrast with LBGs showing modest fractions of photon escape. This trend is roughly consistent with the findings by Iwata et al. (2009) that LAEs tend to show smaller observed ratios of non-ionizing UV to Lyman continuum flux density than LBGs, as well as with the latest measurements of s for both populations (Nestor et al. 2013). Similar suggestions of high escape fractions are also offered for LCGs, likely local analogs of high- emission line galaxies (Jaskot & Oey 2013; Shim & Chary 2012). Since the fraction of LAEs among star-forming galaxies is known to increase with redshift (e.g., Ouchi et al. 2008; Stark et al. 2010), LAEs and similar low-mass galaxies could produce ionizing photons efficiently and play a key role in supplying ionizing photons for the cosmic reionization at .
We note in conclusion that if the photon escapes are non-zero, LAEs’ ionizing fluxes need not necessarily to be as hard as we expect for zero escape fraction. A hard ionizing photon flux (young population), a high escape fraction of ionizing photons, or a combination of both conditions likely cause the high ionization parameters found in the LAEs.
5.1.2 Metallicity
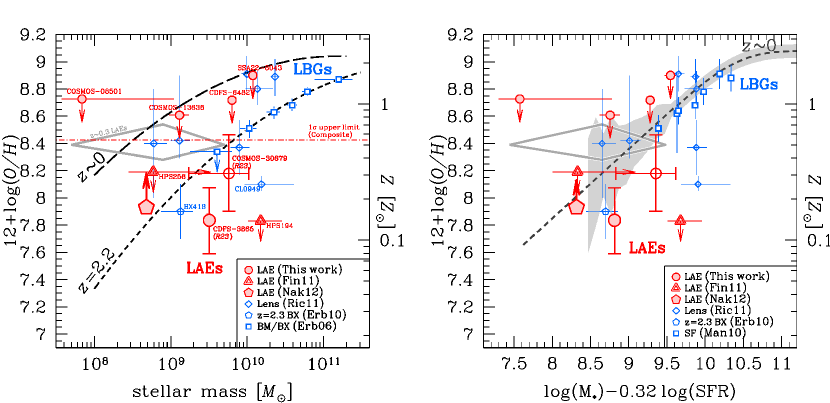
Figure 8 (left) shows the observed mass-metallicity (M-Z) relation. The red symbols represent LAEs at , while the blue symbols show the other galaxies such as LBGs at the similar redshifts. Although some of our LAEs have just weak upper-limits of metallicity due to the lack of [N ii]-detection (§4.3), for CDFS-3865 and COSMOS-30679, we obtain the metallicity estimates from -index with the oxygen lines. We plot these metallicity estimates with larger circles in Figure 8. Albeit with its relatively large error in metallicity, CDFS-3865 falls below the conventional M-Z relation of LBGs. At least one LAE (HPS194) found by Finkelstein et al. (2011) also looks less chemically-enriched for its mass. Although the offsets of these LAEs from the M-Z relation can be due to the intrinsic scatter of the relation seen in the local universe (e.g., Tremonti et al. 2004), it may also indicate that they are less chemically evolved for their stellar masses. The idea is consistent with the suggestion of CDFS-3865’s high ionization parameters. Since galaxies with high ionization parameters (e.g., BX418) tend to fall below the M-Z relation as well121212 Galaxies with high ionization parameter (Fosbury et al. 2003; Richard et al. 2011) are omitted due to their high redshifts (). Since the M-Z relation is known to evolve with redshift, a direct comparison with the LAEs is not appropriate., young galaxies with high ionization parameters may not follow the M-Z relation defined by more evolved galaxies. Unfortunately, no constraint on ionization parameter is given for HPS194. Alternatively, differences in star-formation activity may cause the scatter. We discuss this point later.
By contrast, the comparison with COSMOS-30679 is more unclear. Its large errors both in stellar mass and metallicity prevent us from telling if it is below/on the LBGs’ relation. Since its ionization parameter is comparable to those for LBGs (§5.1.1), COSMOS-30679 may be an LBG-like galaxy.
We also constrain an average metallicity from the band composite spectrum (Figure 4) by using the empirical [N ii]-index. The () upper-limit of metallicity is (), which corresponds to . On the other hand, we independently obtain an average lower-limit of metallicity for LAEs to be (), or at the () level, based on the [O ii]/(H+[N ii]) ratio whose fluxes are obtained by stacking and m narrowband images for more than LAEs (Nakajima et al. 2012). LAEs thus typically have a metallicity – (–) at the () level. The range is robust in the sense that the upper-limit is constrained by bright, massive LAEs while the lower-limit by faint, low-mass LAEs. More spectroscopic data are needed, however, to conclude that there are no exceptional LAEs that have nearly zero or super-solar metallicities. The metallicity range also suggests that LAEs at are rather less chemically enriched than those at ( 131313 We recalculate the metallicity by using the Maiolino et al. (2008) indicator. The original estimate is dex lower. ; Cowie et al. 2011).
Nakajima et al. (2012) find that LAEs fall typically above the M-Z relation below the stellar mass . In contrast, the current study finds less chemically enriched LAEs for their masses. This apparent inconsistency may be due to the sampling of a large variety of evolutionary phases within the LAE population. Such variation has been indeed reported by other studies (e.g., Nilsson et al. 2011; Oteo et al. 2012). Alternatively, differences in star-formation activity may cause the inconsistency. To check the possibility, we plot the LAEs on the fundamental metallicity relation (FMR; Mannucci et al. 2010), the relation between stellar mass, metallicity, and SFR. In Figure 8 (right), most of the galaxies at – including the average LAE (Nakajima et al. 2012) appear to be consistent with the same FMR determined by the SDSS galaxies within their errors. However, some LAEs such as HPS194, and possibly CDFS-3865 and COSMOS-30679, still appear to fall below the relation. The inconsistency for HPS194 is remarkable ( level). Their low metallicities are not just likely due to their relatively high SFRs. We can speculate that the FMR is not universal and may fail to reproduce the properties of galaxies with e.g., high ionization parameter. Clearly however, much more data is needed to test the idea statistically.
5.1.3 Star-Formation Activity
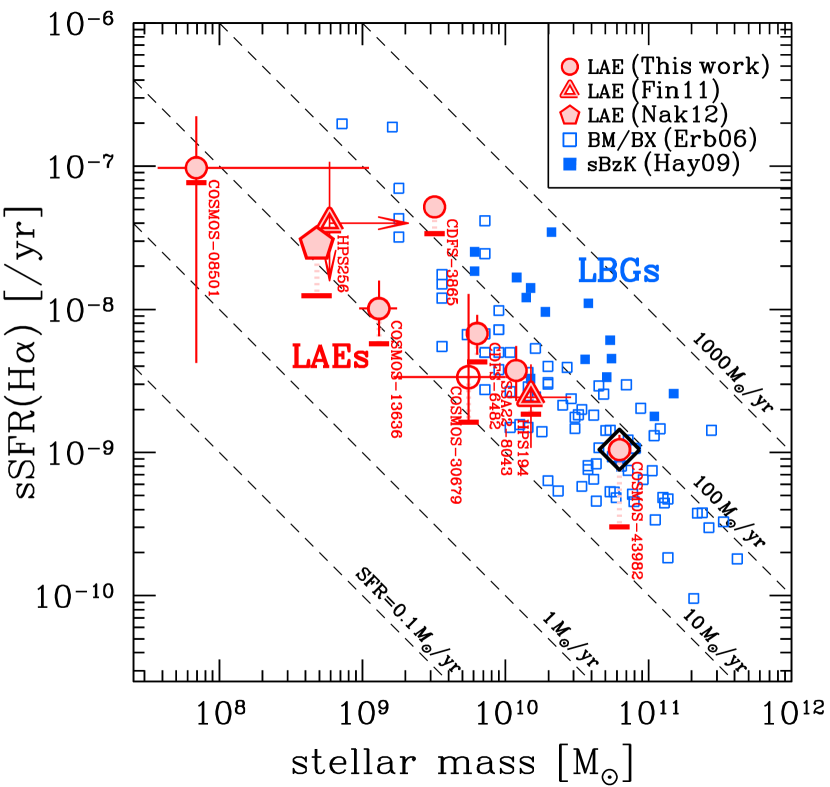
In order to examine the star-formation activity of LAEs, we plot the LAEs on the sSFR versus stellar mass plane in Figure 9. We also plot BX/BM galaxies (Erb et al. 2006b) and sBzK galaxies (Hayashi et al. 2009). We note that this plot should be interpreted with cares since the spectroscopic data introduce limits in the sensitivity to low SFRs.
BX/BM and sBzK galaxies follow a simple scaling relation between sSFR and the stellar mass, whose tight relation is referred to as the star formation main sequence (e.g., Daddi et al. 2007). Note that BX/BM and sBzK galaxies appear to have slightly different sequences; BX/BMs show lower sSFRs at a given mass. Compared to them, LAEs appear to follow the BX/BMs’ main sequence almost over the full mass range. CDFS-3865 and COSMOS-30679, which exhibit high ionization parameters and low metallicities, are not outliers on this diagram. This trend indicates that star-formation activities are well determined by their stellar mass, irrespective of the presence of Ly emission. Interestingly, Rhoads et al. (2013) recently find that LAEs tend to have higher SFR surface densities for their gas mass surface densities than “normal” star-forming galaxies including BzK galaxies.
5.2. Physical Properties inferred from Ly and H emission
5.2.1 Correlation between EW(Ly) and EW(H)
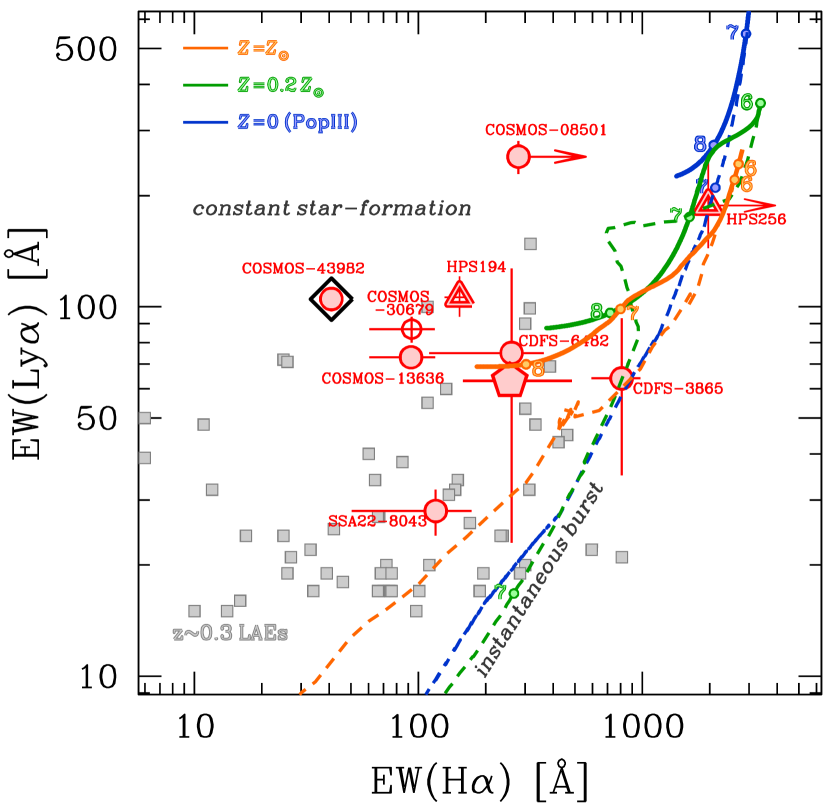
Figure 10 shows equivalent widths of Ly and H for LAEs (hereafter referred to as the “EWs diagram”). This plot may be useful to understand star-formation histories of LAEs, because the EWs’ continuum fluxes evolve in different ways when different star-formation histories are assumed. Another advantage of using the EWs is that both are pure observables and to zeroth order independent of dust extinction (the effect of dust will be discussed at the end of this section).
The superposed curves on Figure 10 illustrate evolutions of the EWs for the two extreme star-formation histories, instantaneous burst (dashed) and constant star-formation (solid) at several metallicities (Schaerer 2003)141414 The models are collected from the Strasbourg astronomical Data Center (CDS). We present here the three metallicity cases assuming Salpeter IMF (Salpeter 1955) with upper (lower) mass cut-off to be ( ). Case B recombination is assumed for an electron temperature of K at zero metallicity and K otherwise, and an electron density of cm-3.. For the instantaneous burst, since very massive stars () complete their evolution within Myr, both EWs decline rapidly. As a result, their curves evolve quickly to lower-left on the EWs diagram. For the constant star-formation, on the other hand, the EW(Ly) stops declining around Myr, because massive stars that are responsible for both Ly emission and UV-continuum reach a steady mode. Since the EW(H) keeps declining as the older stars build up in the galaxy, their slopes of the evolutionary tracks become less steep on the EWs diagram. Although Schaerer’s calculations stop at Myr for constant star-formation, the EW(Ly) varies little after Myr (Charlot & Fall 1993). Therefore, the tracks must extend to the left almost horizontally after the terminal points, reaching EW(H) Å for the solar-metallicity case when an age of Gyr (e.g., Leitherer et al. 1999)151515 Although Leitherer et al. (1999) show the EW(H) evolution with age until Gyr, we extend the evolution toward older age smoothly to obtain EW(H) Å at Gyr. We have confirmed the validity of the smooth extrapolation for constant star-formation by running GALAXEV (Bruzual & Charlot 2003). .
Compared with the model tracks, some LAEs with EW(H) Å, CDFS-3865, HPS256 (Finkelstein et al. 2011), and possibly COSMOS-08501, can be explained by the instantaneous burst models with very young ages (a few Myr). The other LAEs whose EW(H) is modest appear to prefer the constant star-formation models with Myr. Although the sample is small, we find more than half of the LAEs appear to need a continuous star-formation history rather than an instantaneous burst.
Note, however, that since the EWs are sensitive to recent starbursts, LAEs on instantaneous tracks are not necessarily very young, but can be experiencing a burst after a continuous star-formation. Such a combination of burst plus continuous star-formation is indeed needed to explain the EWs of H and optical colors observed in local dwarf galaxies (Lee 2006). An LAE with such a combined star-formation history will be on a track of instantaneous burst during starburst phases and on a track of constant star-formation for the remaining time.
Similarly, most of LAEs appear to prefer continuous star-formation on the EWs diagram. Interestingly, LAEs appear to have systematically higher EW(Ly) and EW(H) than lower- LAEs. Although our spectroscopic sample may be biased toward larger EW(Ly), the difference may be a sign that higher- LAEs are younger. This idea is supported by the inference of lower metallicities at higher- (§5.1.2; see also e.g., Finkelstein et al. 2009; Cowie et al. 2010, 2011).
However, one worry on the use of the EWs diagram is the effect of dust on Ly. If the degree of dust extinction is different for Ly and UV-continuum, EW(Ly) is no longer independent of dust extinction. In order to examine this effect, we introduce a parameter following Finkelstein et al. (2008). The parameter is defined as , where and are optical depth for Ly and UV-continuum at Å, respectively. Small values () mean Ly photons suffer less attenuation by dust than UV-continuum photons, while large values mean Ly photons are more heavily attenuated. In the former (latter) case data points go down (up) on the EWs diagram after the corrections. From previous works, LAEs at have modest values; e.g., from the values given in Hayes et al. (2010) we calculate – for LAEs whose Ly and H luminosities are estimated from two narrowbands. Similarly, Nakajima et al. (2012) obtain . Blanc et al. (2011) obtain for – LAEs whose intrinsic Ly luminosities are inferred from UV-continuum. Therefore, LAEs are on average likely to show , and whose observed EWs(Ly) to be approximately intrinsic. However, we find a non-negligible scatter in -values around unity (especially toward smaller values) for the individual LAEs with H measurement (§5.2.2; Figure 11 right). The LAEs with go down on the EWs diagram and approach the instantaneous burst tracks. Unfortunately, with the current large errors in -values, we cannot clearly tell which star-formation histories are likely for LAEs. Future radiative transfer calculations as well as higher S/N ratio spectra of Ly and H (and probably H) will enable full use of the EWs diagram.
5.2.2 super Case B objects?
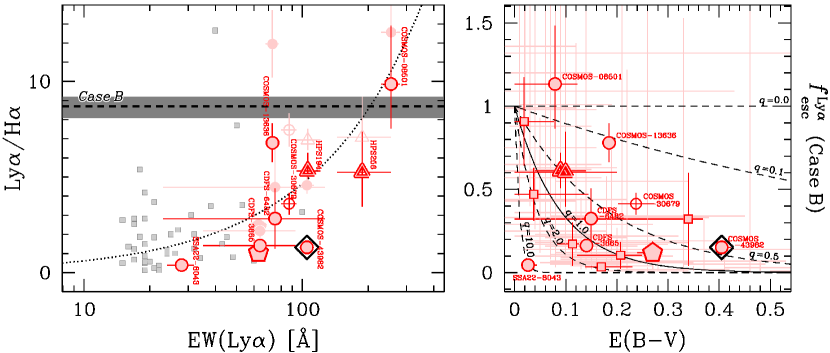
Figure 11 (left) shows the Ly/H ratio against EW(Ly) for LAEs. The dark red symbols indicate the observed Ly luminosity divided by the intrinsic H luminosity corrected using the attenuation inferred from the SED fitting (i.e., showing lower-limits on the -axis), while the light red symbols show the observed Ly/H ratios. A trend that LAEs with larger EW(Ly) have larger Ly/H ratio appears to be present. This trend itself is not so surprising, but interestingly some LAEs, COSMOS-08501, and possibly COSMOS-13636 and one LAE at , may have Ly/H ratios exceeding the Case B recombination value (; Brocklehurst 1971), which we call “super Case B”. Super Case B Ly/H ratios have also been reported for some strong LAEs in the local universe (Hayes et al. 2007, Atek et al. 2008, Otí-Floranes et al. 2012, and references therein). The variation of the intrinsic Ly/H ratio (the gray shaded area) does not seem to be a significant issue. Although it is not obvious that super Case B objects are really included in our sample due to their large errors, it is worth discussing possible physical origins of them in case they really exist.
We consider the possible effect of geometry, and the kinematics of dust and gas in the ISM. Neufeld (1991) propose a clumpy, multi-phase ISM where gas and dust are gathered in clouds within a low-density medium. With such circumstances, Ly photons can be scattered at the surfaces of the clouds due to the resonant nature, while continuum photons would penetrate the clouds deeply. Since dust is contained in the clouds, Ly photons would have a much smaller chance of encountering dust than other photons. In this scenario, a large EW(Ly) and Ly/H ratio can be observed. Alternatively, an outflow of the ISM can be a cause of strong Ly emission (e.g., Kunth et al. 1998). However, Hashimoto et al. (2013) find an anti-correlation between EW(Ly) and Ly velocity offset for LAEs, the latter is considered to be positively correlated with outflow velocity. This anti-correlation is also supported by the observations of LBGs (Adelberger et al. 2003; see also Shapley et al. 2003; Pettini et al. 2001). In addition, the authors measure the LAEs’ outflow velocity directly from metal absorption lines, finding that outflow velocities for LAEs and LBGs are comparable. Therefore, outflows do not appear to be a major mechanism for producing large EW(Ly) and Ly/H ratio, though the sample size of LAEs is still small and much more data as well as theoretical works to interpret the properties are needed.
In order to clarify the effects of a potentially clumpy geometry of ISM on Ly/H ratios, we plot in Figure 11 (right) the relation between and the escape fraction of Ly photons () under the Case B recombination assumption. We estimate as
| (4) |
where subscripts ‘int’ and ‘obs’ refer to the intrinsic and observed quantities, respectively. The intrinsic H luminosities are derived from the observed H fluxes, corrected for dust extinctions. The superposed lines show the relations at a given parameter (§5.2.1);
| (5) |
where is an extinction coefficient at Å (11.98; Calzetti et al. 2000). The clumpy geometry of ISM (or outflow) is favored by objects with –. From Figure 11 (right), most of the LAEs presented here are located in the range –; e.g., COSMOS-13636 and COSMOS-30679 have large in spite of their moderate amounts of dust. SSA22-8043 has a large parameter of , and can be an exception if its Ly is heavily resonant-scatted by neutral hydrogen gas.
A notable object is COSMOS-08501. It appears to fall above the line, where the clumpy ISM model does not work assuming Case B recombination, although the errors are relatively large. Moreover, since it is inferred to possess relatively small amount of dust, the large EW(Ly) owing to the clumpy ISM is unlikely. In case the object is really super Case B, the only remaining explanation is the Ly enhancement caused by collisional excitations. Due to the decreasing collisional strengths with increasing principle quantum number, collisional excitations can lead to Ly/H ratios over the Case B value (see also Osterbrock 1989). Shocks caused by interactions with other sources, AGN activity, supernova explosions, strong outflows or infall are possible candidates for the collisional excitations.
Based on the HST images (Figure 6), COSMOS-08501, a super Case B candidate, looks very compact and shows no sign of interactions. COSMOS-13636, which has a very small parameter, shows two faint sources nearby within kpc (projected) from the object. Its strong Ly emission can be (partly) due to shocks caused by interactions. Indeed, some fractions of LAEs are turned out to exhibit morphologies suggestive of mergers at higher redshift (e.g., Pirzkal et al. 2007; Bond et al. 2009) as well as lower redshift (Cowie et al. 2010). Theoretically, Tilvi et al. (2011) demonstrate that mergers play an important role in mass assembly and star-formation in majority of the LAEs especially at higher redshift. Unfortunately, the shock-induced Ly emission due to mergings has not yet been taken into account in these theoretical works (see also Tilvi et al. 2009). Alternatively, as discussed by Mori et al. (2004), supernova explosions can cause strong shocks, resulting in strong Ly emission. Although the authors intend to explain extended Ly blobs ( kpc) with high Ly luminosities (erg s-1), their basic ideas can be applied to normal LAEs. AGN activity and outflows seem unlikely (see §4.1 and Hashimoto et al. 2013).
When shocks (even partly) contribute to emission lines of LAEs, estimates of physical quantities such as ionization parameter (from [O iii]/[O ii] ratio), metallicity (from -index), SFR (from H), and dust extinction (from Balmer decrement) become less accurate. In particular, the intrinsic H/H value becomes larger when shocks are present, resulting in an overestimate of the abundance of dust. This effect may also help explain the presence of super Case B objects (e.g., Otí-Floranes et al. 2012). Thus, the results presented in this paper may require some corrections for the presence of shocks. We plan to address this in future work, through the simultaneous application of photo-ionization and shock models, with deeper spectroscopy which will detect the weaker lines not fully detected in the observations presented here (e.g., Balmer lines, [O ii], [O iii], [N ii], [S ii]).
A final remark is that from our discussions so far it is evident that Ly is not a robust indicator of SFR for LAEs. The observed data (–) in Figure 11 (left) are relatively well represented by a single power-law fit
| (6) | |||||
which is shown by the dotted curve in Figure 11 (left). According to this simple relation, SFRs of LAEs with EW(Ly) Å (a typical threshold in narrowband searches) can be underestimated by a factor of about . Thus, SFRs estimated from Ly may involve a factor of uncertainties intrinsically.
6. Summary
We have presented NIRSPEC and MMIRS rest-frame optical spectra of seven Ly emitters (LAEs) at , which are selected from our Subaru/Suprime-Cam NB387 survey in COSMOS, Chandra Deep Field South, and SSA22. Our first NIR spectroscopic result discusses the kinematics of LAEs and is presented in Hashimoto et al. (2013). As a companion study, this paper presents mainly the ionization and chemical properties of LAEs based on multiple nebular lines. Our sample includes one possibly AGN-dominated galaxy, and six star-forming galaxies. H is detected in all six star-forming LAEs, while [N ii] is only detected in the galaxy with signs of AGN activity. Among the six star-forming galaxies, one (CDFS-3865) also has detections of [O ii], H, and [O iii], and another (COSMOS-30679) has detections of [O ii] and [O iii]. Our deep band spectroscopic observations provide the first [O ii]-detections for two individual LAEs at high-. Our main results are summarized as follows.
-
•
The [O iii]/[O ii] ratio vs. -index diagram reveals that CDFS-3865 has a very high ionization parameter ( cm s-1) and a low oxygen abundance (metallicity; ) in contrast with moderate values of other high- galaxies such as LBGs. COSMOS-30679 also has a relatively high ionization parameter ( cm s-1) and a low metallicity ( ). LAEs would therefore 1) represent an early stage of galaxy formation dominated by massive stars in compact star-forming regions, and/or 2) have a higher escape fraction of ionizing photons probably achieved by density-bounded Hii regions. High- galaxies like LAEs would thus play a key role in supplying ionizing photons for cosmic reionization in the early universe.
-
•
Local low-metallicity galaxies ( ) show similar ionization parameters and metallicities to high- star-forming galaxies, and those with extreme quantities are likely analogs of high- LAEs. One such population is “green pea” galaxies (GPs; Cardamone et al. 2009), in terms of their low-metallicity, high [O iii]/[O ii] ratios, and relatively high SFRs. A notable difference between the GPs and LAEs are their abundances; the GPs occupy only % of the SDSS galaxy sample, and its number density is almost two order of magnitude smaller than that of LAEs at .
-
•
CDFS-3865 falls below the mass-metallicity relation of LBGs at similar redshifts. Its low metallicity seems not to be explained by its star formation rate being taken into account, albeit with its relatively large error. COSMOS-30679 appears to exhibit the same trend, although its large error in metallicity complicates the interpretation. Interestingly, galaxies with high ionization parameters tend to fall below the relation. Such galaxies may not follow the relation determined by more evolved galaxies.
-
•
The composite spectrum independently provides an upper-limit on the metallicity of () at the () level. Combined with an lower-limit of metallicity (Nakajima et al. 2012), LAEs typically have metallicities – (–) at the () level.
-
•
In contrast to the large differences in ionization parameters and metallicity between LAEs and LBGs, we find LAEs have similar specific star formation rates as BX/BM galaxies at a given stellar mass.
-
•
The EW(Ly) vs. EW(H) diagram interestingly suggests that more than half of the LAEs appear to need an extended star-formation such as a burst superimposed upon a continuous star-formation rather than the instantaneous burst alone. However, since EW(Ly) may suffer from effects of dust and we do find a non-negligible scatter in -values around unity (especially toward smaller values), we need to carefully interpret the result.
-
•
LAEs with low -values (–) can be explained by the clumpy geometry of ISM. Interestingly, our sample may include objects with further enhanced Ly, which we call super Case B. If they really exist, the only possible explanation is the collisional excitations of Ly. Interactions with other sources and/or supernova explosions are possible key events that may cause shock-induced collisional excitation. If such shocks play a role in enhancement of the Ly flux, physical quantities such as ionization parameter, metallicity, SFR, and dust extinction should be re-computed using a combination of photo-ionization and shock-excitation models. We plan to investigate the role of shocks further in future works.
References
- Adelberger et al. (2003) Adelberger, K., Steidel, C. C., Shapley, A. E., & Pettini, M. 2003, ApJ, 584, 45
- Allende Prieto et al. (2001) Allende Prieto, C., Lambert, D. L., & Asplund, M. 2001, ApJ, 556, L63
- Amorín et al. (2010) Amorín, R. O., Pérez-Montero, E., & Vílchez, J. M. 2010, ApJ, 715, L128
- Atek et al. (2008) Atek, H., Kunth, D., Hayes, M., Östlin, G., & Mas-Hesse, L. M. 2008, A&A, 488, 491
- Baldwin et al. (1981) Baldwin, J. A., Phillips, M. M., & Terlevich, R. 1981, PASP, 93, 5
- Bertin & Arnouts (1996) Bertin, E., & Arnouts, S. 1996, A&AS, 117, 393
- Blanc et al. (2011) Blanc, G. A., et al. 2011, ApJ, 736, 31
- Blanton et al. (2003) Blanton, M. R., et al. 2003, ApJ, 592, 819
- Bond et al. (2009) Bond, N. A., Gawiser, E., Gronwall, C., Ciardullo, R., Altmann, M., & Schawinski, K. 2009, ApJ, 705, 639
- Brinchmann et al. (2008) Brinchmann, J., Pettini, M., & Charlot, S. 2008, MNRAS, 385, 769
- Brocklehurst (1971) Brocklehurst, M. 1971, MNRAS, 153, 471
- Bruzual & Charlot (2003) Bruzual, G., & Charlot, S. 2003, MNRAS, 344, 1000
- Capak et al. (2004) Capak, P., et al. 2004, AJ, 127, 180
- Cardamone et al. (2009) Cardamone, C., et al. 2009, MNRAS, 399, 1199
- Calzetti et al. (2000) Calzetti, D., Armus, L., Bohlin, R. C., Kinney, A. L., Koornneef, J., & Storchi-Bergmann, T. 2000, ApJ, 533, 682
- Charlot & Fall (1993) Charlot, S., & Fall, S. M. 1993, ApJ, 415, 580
- Charlot & Longhetti (2001) Charlot, S., & Longhetti, M. 2001, MNRAS, 323, 887
- Cowie & Hu (1998) Cowie, L. L., & Hu, E. M. 1998, AJ, 115, 1319
- Cowie et al. (2010) Cowie, L. L., Barger, A. J., & Hu, E. M. 2010, ApJ, 711, 928
- Cowie et al. (2011) Cowie, L. L., Barger, A. J., & Hu, E. M. 2011, ApJ, 738, 136
- Daddi et al. (2007) Daddi, E., et al. 2007, ApJ, 670, 156
- Dopita et al. (2000) Dopita, M. A., Kewley, L. J., Heisler, C. A., & Sutherland, R. S. 2000, ApJ, 542,224
- Dopita et al. (2006) Dopita, M. A., et al. 2006, ApJ, 647, 244
- Erb et al. (2006a) Erb, D. K., Shapley, A. E., Pettini, M., Steidel, C. C., Reddy, N. A., & Adelberger, K. L. 2006a, ApJ, 644, 813
- Erb et al. (2006b) Erb, D. K., Steidel, C. C., Shapley, A. E., Pettini, M., Reddy, N. A., & Adelberger, K. L. 2006b, ApJ, 647, 128
- Erb et al. (2010) Erb, D. K., Pettini, M., Shapley, A. E., Steidel, C. C., Law, D. R., & Reddy, N. A. 2010, ApJ, 719, 1168
- Finkelstein et al. (2008) Finkelstein, S. L., Rhoads, J. E., Malhotra, S., Grogin, N., & Wang, J. 2008, ApJ, 678, 655
- Finkelstein et al. (2009) Finkelstein, S. L., Cohen, S. H., Malhotra, S., & Rhoads, J. E. 2009, ApJ, 700, 276
- Finkelstein et al. (2011) Finkelstein, S. L., et al. 2011, ApJ, 729, 140
- Förster Schreiber et al. (2009) Förster Schreiber, N. M., et al. 2009, ApJ, 706, 1364
- Fosbury et al. (2003) Fosbury, R. A. E., et al. 2003, ApJ, 506, 797
- Furusawa et al. (2008) Furusawa, H., et al. 2008, ApJS, 176, 1
- Gawiser et al. (2006) Gawiser, E., et al. 2006, ApJ, 642, L13
- Gawiser et al. (2007) Gawiser, E., et al. 2007, ApJ, 671, 278
- Giacconi et al. (2001) Giacconi, R., Rosati, P., Tozzi, P., et al. 2001, ApJ, 551, 624
- Giammanco et al. (2005) Giammanco, C., Beckman, J. E., & Cedrés, B. 2005, A&A, 438, 599
- Gray & Corbally (1994) Gray, R. O., & Corbally, C. J. 1994, AJ, 107, 742
- Gronwall et al. (2007) Gronwall, C., et al. 2007, ApJ, 667, 79
- Guaita et al. (2010) Guaita, L., et al. 2010, ApJ, 714, 255
- Guaita et al. (2011) Guaita, L., et al. 2011, ApJ, 733, 114
- Hainline et al. (2009) Hainline, K. N., Sharpley, A. E., Kornei, K. A., Pettini, M., Buckley-Geer, E., Allam, S. S., & Tucker, D. L. 2009, ApJ, 701, 52
- Hashimoto et al. (2013) Hashimoto, T., et al. 2013, ApJ, 765, 70
- Hayashi et al. (2009) Hayashi, M., et al. 2009, ApJ, 691, 140
- Hayashino et al. (2004) Hayashino, T., et al. 2004, AJ, 128, 2073
- Hayes et al. (2007) Hayes, M., et al. 2007, MNRAS, 382, 1465
- Hayes et al. (2010) Hayes, M., et al. 2010, Nature, 464, 562
- Hummer & Storey (1987) Hummer, D. G., & Storey, P. J. 1987, MNRAS, 224, 801
- Iwata et al. (2009) Iwata, I., et al. 2009, ApJ, 692, 1287
- Izotov et al. (2006) Izotov, Y. I., Stasińska, G., Meynet, G., Guseva, N. G., & Thuan, T. X. 2006, A&A, 448, 955
- Izotov et al. (2011) Izotov, Y. I., Guseva, N. G., & Thuan, T. X. 2011, ApJ, 728, 161
- Jaskot & Oey (2013) Jaskot, A. E., & Oey, M. S. 2013, arXiv:1301.0530
- Kauffmann et al. (2003) Kauffmann, G., et al. 2003, MNRAS, 346, 1055
- Kennicutt (1998) Kennicutt, R. C., Jr. 1998, ARA&A, 36, 189
- Kewley et al. (2001) Kewley, L. J., Dopita, M. A., Sutherland, R. S., Heisler, C. A., & Trevena, J. 2001, ApJ, 556, 121
- Kewley & Dopita (2002) Kewley, L. J., & Dopita, M. A. 2002, ApJS, 142, 35
- Kunth et al. (1998) Kunth, D., Mas-Hesse, J. M., Terlevich, E., Terlevich, R., Lequeux, J., & Fall, S. M. 1998, A&A, 334, 11
- Kurucz (1993) Kurucz, R. 1993, Kurucz CD-ROM 13 (Cambridge, MA: SAO)
- Lee et al. (2004) Lee, J. C., Salzer, J. J., & Melbourne, J. 2004, ApJ, 616, 752
- Lee (2006) Lee, J. C. 2006, PhD thesis, Univ. Arizona
- Lee et al. (2012) Lee, J. C., et al. 2012, arXiv:1205.0017
- Leitherer et al. (1999) Leitherer, C., et al. 1999, ApJS, 123, 3
- Lilly et al. (2003) Lilly, S. J., Carollo, C. M., & Stockton, A. N. 2003, ApJ, 597, 730
- Ly et al. (2011) Ly, C., et al. 2011, ApJ, 726, 109
- Ly et al. (2012) Ly, C., Malkan, M. A., Kashikawa, N., Ota, K., Shimasaku, K., Iya, M., & Currie, T. 2012, ApJ, 747, L16
- Madau (1995) Madau, P. 1995, ApJ, 441, 18
- Maiolino et al. (2008) Maiolino, R., et al. 2008, A&A, 488, 463
- Malhotra & Rhoads (2002) Malhotra, S., & Rhoads, J. E. 2002, ApJ, 565, 71
- Malhotra et al. (2012) Malhotra, S., Rhoads, J. E., Finkelstein, S. L., Hathi, N., Nilsson, K., McLinden, E., & Pirzkal, N. 2012, ApJ, 750, L36
- Mannucci et al. (2009) Mannucci, F., et al. 2009, MNRAS, 398, 1915
- Mannucci et al. (2010) Mannucci, F., Cresci, G., Maiolino, R., Marconi, A., & Gnerucci, A. 2010, MNRAS, 408, 2115
- Mannucci et al. (2011) Mannucci, F., Salvaterra, R., & Campisi, M.A. 2011, MNRAS, 414, 1263
- McLinden et al. (2011) McLinden, E. M., et al. 2011, ApJ, 730, 136
- Miyazaki et al. (2002) Miyazaki, S., et al. 2002, PASJ, 54, 833
- Mori et al. (2004) Mori, M., Umemura, M., & Ferrara, A. 2004, ApJ, 613, L97
- Nagao et al. (2006) Nagao, T., Maiolino, R., & Marconi, A. 2006, A&A, 459, 85
- Nakajima et al. (2012) Nakajima, K., et al. 2012, ApJ, 745, 12
- Nestor et al. (2013) Nestor, D. B., Shapley, A. E., Kornei, K. A., Steidel, C. C., & Siana, B. 2013, ApJ, 765, 47
- Neufeld (1991) Neufeld, D. A. 1991, ApJ, 370, L85
- Nilsson et al. (2009) Nilsson, K. K., et al. 2009, A&A, 498, 13
- Nilsson et al. (2011) Nilsson, K. K., Östlin, G., Møller, P.,Möller-Nilsson, O., Tapken, C., Freudling, W., & Fynbo, J. P. U. 2011, A&A, 529, 9
- Nonino et al. (2009) Nonino, M., et al. 2009, ApJS, 183, 244
- Oey & Kennicutt (1997) Oey, M. S., & Kennicutt, R. C., Jr. 1997, MNRAS, 291, 827
- Oke (1974) Oke, J. B. 1974, ApJS, 27, 21
- Ono et al. (2010a) Ono, Y., Ouchi, M., Shimasaku, K., Dunlop, J., Farrah, D., McLure, R., & Okamura, S. 2010a, ApJ, 724, 1524
- Ono et al. (2010b) Ono, Y., et al. 2010b, MNRAS, 402, 1580
- Osterbrock (1989) Osterbrock, D. E. 1989, Astrophysics of Gaseous Nebulae and Active Galactic Nuclei. University Science Books, Suasalito, CA
- Oteo et al. (2012) Oteo, I., et al. 2012, arXiv:1202.0997
- Otí-Floranes et al. (2012) Otí-Floranes, H., et al. 2012, arXiv:1207.7303
- Ouchi et al. (2003) Ouchi, M., et al. 2003, ApJ, 582, 60
- Ouchi et al. (2008) Ouchi, M., et al. 2008, ApJS, 176, 301
- Ouchi et al. (2009) Ouchi, M., et al. 2009, ApJS, 706, 1136
- Overzier et al. (2008) Overzier, R. A., et al. 2008, ApJ, 673, 143
- Pagel et al. (1979) Pagel, B. E. J., Edmunds, M. G., Blackwell, D. E., Chun, M. S., & Smith, G. 1979, MNRAS, 189, 95
- Peng et al. (2010) Peng, C. Y., Ho, L. C., Impey, C. D., & Rix, H. 2010, AJ, 139, 2097
- Pettini et al. (2001) Pettini, M., et al. 2001, ApJ, 554, 981
- Pirzkal et al. (2007) Pirzkal, N., Malhotra, S., Rhoads, J. E., & Xu, C. 2007, ApJ, 667, 49
- Rhoads et al. (2013) Rhoads, J. E., Malhotra, S., Finkelstein, S. L., Fynbo, J. P. U., McLinden, E. M., Richardson, M. L. A., & Tilvi, V., S. 2013, arXiv:1301.3140
- Richard et al. (2011) Richard, J., Jones, T., Ellis, R., Stark, D. P., Livermore, R., & Swinbank, M. 2011, MNRAS, 413, 643
- Rigby et al. (2011) Rigby, J. R., Wuyts, E., Gladders, M. D., Sharon, K., & Becker, G. D. 2011, ApJ, 732, 59
- Rousselot et al. (2000) Rousselot, P., Lidman, C., Cuby, J. G., Moreels, G., & Monnet, G. 2000, A&A, 354, 1134
- Robertson et al. (2010) Robertson, B. E., Ellis, R. S., Dunlop, J. S., McLure, R. J., & Stark, D. P. 2010, Nature, 468, 49
- Salpeter (1955) Salpeter, E. E. 1955, ApJ, 121, 161
- Schaerer (2003) Schaerer, D. 2003, A&A, 397, 527
- Schaerer & de Barros (2009) Schaerer, D. & de Barros, S. 2009, A&A, 502, 423
- Scoville et al. (2007) Scoville, N., et al. 2007, ApJS, 172, 1
- Shapley et al. (2003) Shapley, A. E., Steidel, C. C., Pettini, M., & Adelberger, K. L. 2003, ApJ, 588, 65
- Shapley et al. (2006) Shapley, A. E., Steidel, C. C., Pettini, M., Adelberger, K. L., & Erb, D. K. 2006, ApJ, 651, 688
- Shields (1990) Shields, G. A. 1990, ARA&A, 28, 525
- Shim & Chary (2012) Shim, H., & Chary, R. R. 2012, arXiv:1205.0949
- Shimasaku et al. (2006) Shimasaku, K., et al. 2006, PASJ, 58, 313
- Stark et al. (2010) Stark, D. P., Ellis, R. S., Chio, K., Ouchi, M., & Bunker, A. 2010, MNRAS, 408, 1628
- Steidel et al. (2000) Steidel, C. C., Adelberger, K. L., Kurt L., Shapley, A. E., Pettini, M., Dickinson, M. & Giavalisco, M. 2000, ApJ, 532, 170
- Tilvi et al. (2009) Tilvi, V., Malhotra, S., Rhoads, J. E., Scannapieco, E., Thacker, R. J., Ilev, I. T., & Mellema, G. 2009, ApJ, 704, 724
- Tilvi et al. (2011) Tilvi, V., Scannapieco, E., Malhotra, S., & Rhoads, J. E. 2011, MNRAS, 418, 2196
- Tremonti et al. (2004) Tremonti, C. A., Heckman, T. M., Kauffmann, G., et al. 2004, ApJ, 613, 898
- van Dokkum (2001) van Dokkum, P. G. 2001, PASP, 113, 1420
- Venemans et al. (2005) Venemans, B. P., et al. 2005, A&A, 431, 793
- Xia et al. (2012) Xia, L., et al. 2012, AJ, 144, 28
- Yajima & Li (2012) Yajima, H., & Li, Y. 2012, arXiv:1211.0088
- Yan et al. (2005) Yan, H., et al. 2005, ApJ, 634, 109
- York et al. (2000) York, D. G., et al. 2000, AJ, 120, 1579
- Yoshikawa et al. (2010) Yoshikawa, T., et al. 2010, ApJ, 718, 112