Investigation of Dual Active Nuclei, Outflows, Shock-Heated Gas, and
Young Star Clusters in Markarian 266
Abstract
Results of observations with the Spitzer, Hubble, GALEX, Chandra,
and XMM-Newton space telescopes are presented for the
Luminous Infrared Galaxy (LIRG) merger Markarian 266.
The SW (Seyfert 2) and NE (LINER) nuclei reside in galaxies with
Hubble types SBb (pec) and S0/a (pec), respectively.
Both companions are more luminous than galaxies and they are
inferred to each contain a black hole.
Although the nuclei have an observed hard X-ray flux ratio of ,
Mrk 266 SW is likely the primary source of a bright Fe K line detected from
the system, consistent with the reflection-dominated
X-ray spectrum of a heavily obscured AGN. Optical knots embedded in an arc with
aligned radio continuum radiation, combined with luminous line emission, provide
evidence for a radiative bow shock in an AGN-driven outflow surrounding the NE nucleus.
A soft X-ray emission feature modeled as shock-heated plasma with K
is co-spatial with radio continuum emission between the galaxies.
Mid-infrared diagnostics provide mixed results, but overall suggest
a composite system with roughly equal contributions of AGN and
starburst radiation powering the bolometric luminosity.
Approximately 120 star clusters have been detected, with most having
estimated ages less than 50 Myr.
Detection of 24 µm emission aligned with soft X-rays, radio continuum and
ionized gas emission extending 34″ (20 kpc) north of the galaxies
is interpreted as of dust entrained in an outflowing superwind.
At optical wavelengths this Northern Loop region is resolved into a fragmented morphology
indicative of Rayleigh-Taylor instabilities in an expanding shell of ionized gas.
Mrk 266 demonstrates that the dust “blow-out” phase can begin in a LIRG well
before the galaxies fully coalesce during a subsequent ULIRG phase,
and rapid gas consumption in luminous dual AGNs with kpc-scale separations
early in the merger process may explain the paucity of detected binary QSOs
(with pc-scale orbital separations) in spectroscopic surveys.
An evolutionary sequence is proposed representing a progression from dual
to binary AGNs, accompanied by an increase in observed
ratios by over four orders of magnitude.
Subject headings:
galaxies: interactions — galaxies: nuclei — galaxies: active — galaxies: Seyfert — galaxies: starburst — galaxies: star clusters: general1. Introduction
1.1. LIRGs, ULIRGs and GOALS
Luminous Infrared Galaxies (LIRGs; ) and Ultraluminous Infrared Galaxies (ULIRGs; ) are intriguing objects with widespread implications for galaxy evolution. They contain the highest known rates of star formation, they exhibit a high frequency of active galactic nuclei (AGNs) and large-scale outflows (superwinds), and mounting evidence indicates that the majority of local (U)LIRGs represent an evolutionary process involving the transformation of major mergers between dusty, gas-rich disk galaxies into elliptical galaxies hosting classical UV-excess QSOs or powerful radio galaxies (e.g., Sanders & Mirabel, 1996; Veilleux, 2006). At redshifts of , LIRGs have a higher space density than ULIRGs and dominate the total star-formation density at that epoch (Le Floc’h et al., 2005). At the contributions of LIRGs and ULIRGs to the total IR luminosity density are about equal (e.g., Caputi et al., 2007). Since LIRGs and ULIRGs were much more common in the early universe, these populations are fundamental in understanding both star formation and galaxy evolution.
The Great Observatories All-Sky LIRG Survey (GOALS)111http://goals.ipac.caltech.edu/ is utilizing imaging and spectroscopic data from NASA’s Spitzer, Hubble, Chandra and GALEX space observatories, in combination with ground-based observations, in a comprehensive study of more than 200 of the most luminous infrared galaxies in the local universe (Armus et al., 2009). The sample consists of 181 LIRGs and 23 ULIRGs that form a statistically complete subset of the flux-limited IRAS Revised Bright Galaxy Sample (RBGS), which itself is comprised of 629 extragalactic objects with 60 µm flux densities above 5.24 Jy and Galactic latitudes (Sanders et al., 2003).
1.2. Dual AGNs in Major Mergers
A key scientific driver for GOALS is the investigation of the relative time-scales and energetics of active star formation and AGN phenomena during different phases of the merger sequence. It is now widely accepted that all massive galaxies likely have a supermassive black hole (SMBH) in their centers (e.g., Ferrarese & Ford, 2005), with a SMBH mass proportional to the mass of the stellar bulge (%; Marconi & Hunt, 2003). However, many uncertainties remain regarding the fueling of paired SMBHs during major mergers. While the nuclei are still separated by kpc scales, how common is it for both SMBHs to have accretion rates high enough to produce energetically significant dual AGNs, as opposed to one or both nuclei being powered predominantly by a burst of star formation? How do AGN characteristics depend on properties of the host galaxies and dynamics of the encounter? Are the fuel supplies and accretion rates sufficient to sustain two luminous AGNs well into a true binary stage (e.g., binary QSOs), when the SMBHs are closely bound () in Keplerian orbits inside a dynamically relaxed (elliptical) merger remnant (e.g., Colpi & Dotti, 2009)? Is there something special about the physical conditions in systems that host dual AGNs, or is their lack of detection in some (U)LIRGs merely a matter of observing them during the right stage prior to merging (i.e., an evolutionary timing coincidence), or accounting for differences in nuclear dust obscuration? What is the relative importance of AGNs and star formation in the energetics of the “superwind” phenomena that appears to be ubiquitous in (U)LIRGs (e.g., see the review by Veilleux, 2006)?
Although (U)LIRGs are predominantly systems involving major mergers, extensive observations utilizing optical and infrared spectroscopy have so far turned up surprisingly few systems containing confirmed dual AGNs. This has a number of possible explanations. First, (U)LIRGs contain large quantities of centrally concentrated dust that can effectively obscure one or both AGNs at optical, near-infrared, and even mid-infrared wavelengths (e.g. Laurent et al., 2000; Spoon et al., 2004). Therefore, circumnuclear star formation can dominate the observed spectra while in reality a powerful AGN may be buried inside. Second, about 30% of observed LIRGs (e.g., Veilleux et al., 1995), and 40% of ULIRGs (e.g., Veilleux et al., 1999) are classified as LINERs based on optical spectroscopy. It has proven difficult to distinguish between low-luminosity AGNs (photoionization from radiation due to accretion onto a SMBH), photoionization from very hot stars, and shock heating (induced by SNe and starburst-driven superwinds) as the primary source of ionization in LINERs (e.g., Veilleux et al., 1999).
Recent results indicate that most nearby LINERs are dominated by photo-ionization rather than shock heating, and that they are an important class of AGNs distinguished primarily by a lower accretion rate than in Seyfert nuclei (Kewley et al., 2006; Ho, 2008). This implies that the frequency of dual AGNs may be much higher than inferred to date. Only recently, with the capability of the Chandra X-ray Observatory to penetrate their extensive dust cocoons with high-resolution hard X-ray observations, have suspected dual AGNs been confirmed in a small number of (U)LIRGs. Perhaps the best known example is NGC 6240, in which hard X-rays and strong Fe K emission lines indicate the presence of two AGNs with a projected separation of 14 (1 kpc) (Komossa et al., 2003). A second case is the ULIRG Mrk 463, a system first pointed out as an active double-nucleus galaxy by Petrosian, Saakian & Khachikian (1978). The eastern component undoubtedly hosts a dust-enshrouded Type 1 AGN that is powering apparently young radio jets (Mazzarella et al., 1991a), but conflicting optical spectral classifications from various studies left the nature of the western nucleus in doubt (LINER, Seyfert 2, or starburst/AGN composite). Dual AGNs in Mrk 463 have been confirmed recently via detection of two compact, luminous sources of hard X-rays using Chandra (Bianchi et al., 2008). To date, very few systems in the GOALS sample have been confirmed to contain dual AGNs via X-ray observations. The first system is NGC 6240, and the second is Arp 299 (NGC 3690 + IC 694) (Ballo et al., 2004). This article presents an in-depth investigation of a third system in this rare class of objects that has considerable importance for understanding the evolution of galaxy mergers and their remnants.
1.3. Complex Phenomena in Mrk 266
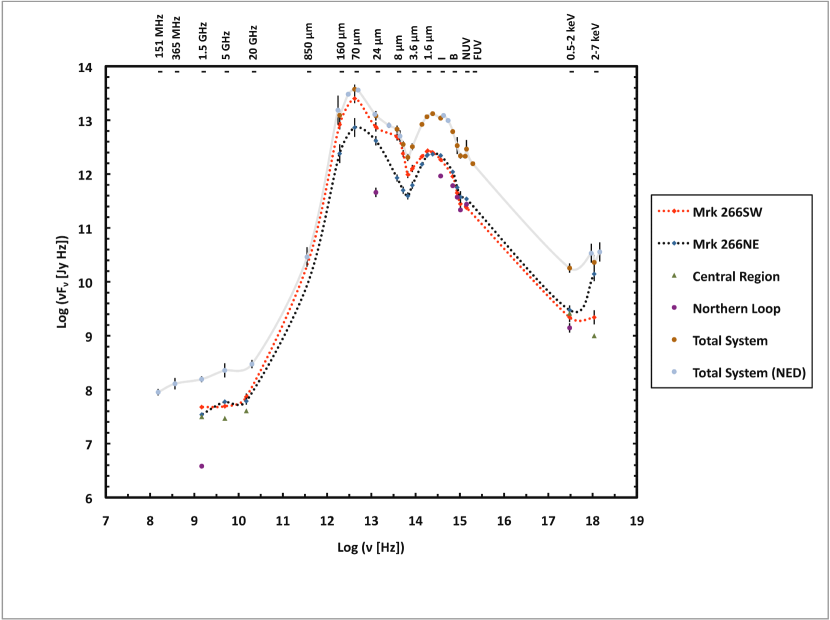
One of the most remarkable LIRGs in the local Universe is Mrk 266 (NGC 5256). The system was first called out as an extraordinary object in the Markarian Survey (First Byurakan Sky Survey) of ultraviolet-excess galaxies due to the presence of two nuclei within what appeared to be a single galaxy (Petrosian, Saakian & Khachikian, 1978, 1979). In a detailed spectroscopic investigation at optical wavelengths, Petrosian, Saakian & Khachikian (1980) showed that the nuclei have a radial velocity difference of 280 , and based on the assumption that the nuclei revolve about a common center of gravity, masses of were estimated for the SW and NE nuclei, respectively. As for all objects in the Markarian Survey, Mrk 266 stood out because its UV-to-optical flux ratio is higher than in normal galaxies. However, Mrk 266 is also a LIRG, with an infrared luminosity of (8 - 1000 µm, as estimated from flux densities in all four IRAS bands; Armus et al., 2009). As shown in the current study (§3.5), the global spectral energy distribution indicates the bulk of its energy is emitted in the mid- to far-infrared; much more energy is being emitted at the peak of the SED than is escaping in UV radiation ().
Mrk 266 contains a filamentary nebula of ionized hydrogen 30 kpc in diameter (Armus et al., 1990) surrounding the two nuclei. A luminous X-ray nebula 100 kpc in extent detected by ROSAT (also surrounding the two nuclei) and complex kinematics derived from optical spectroscopy revealed one of the most spectacular examples of an outflowing, starburst-driven superwind (Wang et al., 1997). In addition to radio continuum emission from the two nuclei, a bright radio source located between the nuclei was detected and interpreted as enhanced synchrotron emission induced by extensive shocks at the interface of the merging galaxies (Mazzarella et al., 1988). Imaging in (Mazzarella et al., 1988; Armus et al., 1990), [O III] (Hutchings et al., 1988) and soft X-rays (Kollatschny & Kowatsch, 1998) also revealed a bright loop of emission extending 24″(17 kpc) to the north-east and connected to the SW (Seyfert 2) nucleus (Wang et al., 1997). Recent Chandra observations have resolved X-ray emission from both nuclei, and detected diffuse emission associated with the northern feature and between the nuclei (Brassington et al., 2007). The nature of the northern emission region (hereafter called the Northern Loop) has remained controversial, with suggestions including a component of the superwind (Wang et al., 1997), a “jet” from an AGN (Kollatschny & Kowatsch, 1998), and a tidal tail (Brassington et al., 2007).
Mrk 266 is worthy of further detailed study because it manifests complex processes that are rarely detected simultaneously, presumably due to their relatively short time scales: vigorous star formation, a candidate dual AGN (depending on the ionizing source of the LINER), a powerful large-scale superwind, and substantial radio continuum and X-ray emission between the nuclei. The relative proximity of the system permits close-up investigation of an important stage in the evolution of major mergers that may involve the transformation of LIRGs into ULIRGs, AGN feedback with the ISM, and implications for fueling (or quenching) of accreting SMBHs which galaxy evolution models predict to have occurred in large numbers during earlier epochs.
In this study, new observations and re-processed archival data from the Spitzer, Hubble, Chandra, XMM-Newton and GALEX space telescopes are analyzed in combination with multi-wavelength ground-based data. Imaging, photometric, and spectroscopic data are presented in §2. In §3 the new data are interpreted to obtain new insights into the nature of the colliding/merging system (§3.1), the nuclei and circumnuclear regions (§3.2), the region between the nuclei (§3.3), the extensive superwind (§3.4), the SEDs of the major components (§3.5), newly detected star clusters (§3.6), and the molecular gas properties (§3.7). In §3.8, Mrk 266 is examined in comparison with other interacting systems with strong radiation sources between the galaxies, and a sequence is proposed that may represent an evolutionary progression from dual AGNs (with kpc-scale separations) to binary AGNs (with parsec-scale orbits). Due to the large number of new measurements spanning many spectral regions, the basic observations and data reductions are described in §2, but most of the corresponding figures and tables are displayed alongside their interpretation and analyses in §3. Conclusions are summarized in §4. A systemic heliocentric recession velocity of (de Vaucouleurs et al., 1991) is adopted, corrected to via the flow model of Mould et al. (2000a, b) that accounts for three major attractors in the local Universe. We adapt cosmological parameters , , and (Hinshaw et al., 2009). The corresponding luminosity distance to Mrk 266 is 129 Mpc (distance modulus 35.55 mag), and the spatial scale is 0.59 kpc/arcsec222Provided by NED at http://ned.ipac.caltech.edu/.
2. Observations
2.1. Optical and Near-Infrared Imaging with HST
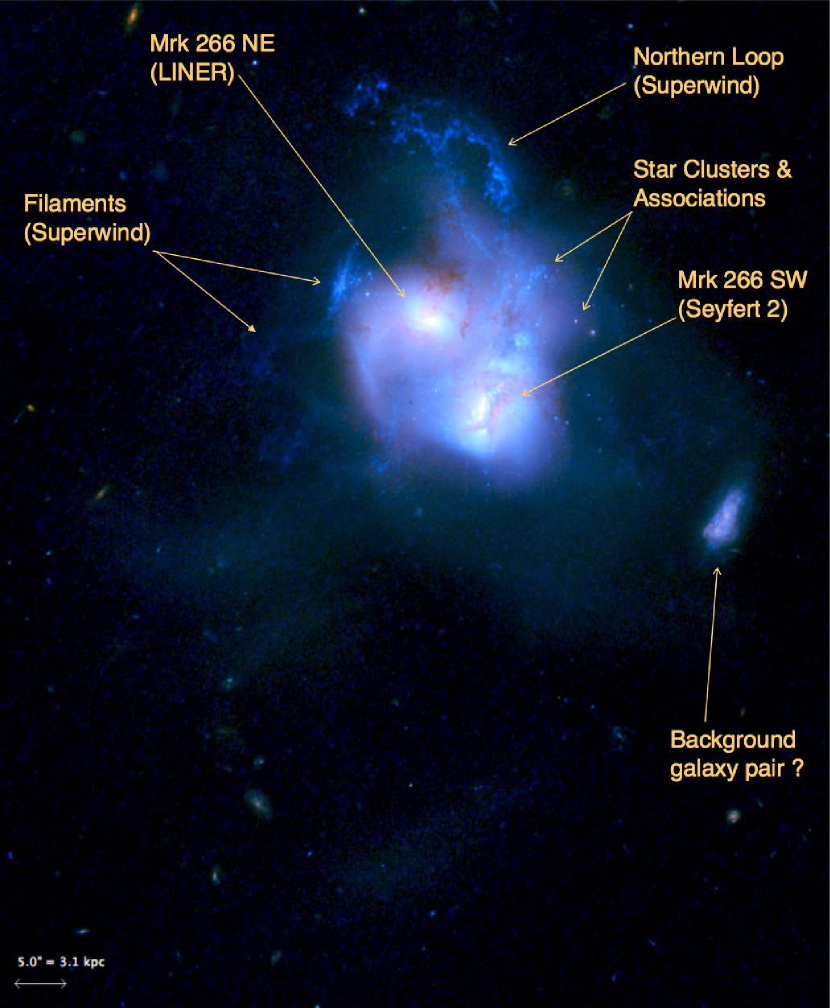
Mrk 266 was observed 2005 November 17 with the Advanced Camera for Surveys (ACS) Wide Field Channel (WFC) as part of a HST Cycle 14 GOALS program to investigate 88 LIRGs with (PID 10592, PI A. Evans). The system was imaged with an integration time of 22.5 minutes in the F435W filter (B band, 0.435 µm, image #J9CV48010) and 13 minutes in the F814W filter (I band, 0.814 µm, image #J9CV48020). The WFC has a field of view of 202″ x 202″ with pixels subtending 005. The images were processed through the standard STScI pipeline to remove instrumental signatures, subtract a dark frame, apply flat fielding, remove geometric distortion, and apply flux calibration. Residual cosmic ray removal, background subtraction, and accurate astrometric calibration using sources from 2MASS (Skrutskie et al., 2006) were also performed using procedures detailed by Evans et al. (2012, in preparation). Figure 1 presents a composite color image constructed using the B and I band data, and labels identify major features that are analyzed throughout this article.
Near-infrared observations at 1.6 µm (F160W, H band) with the NIC2 aperture of NICMOS were acquired on 1997 September 13 in Cycle 7 (PID 7328, PI M. Malkan). The image (#N44B40010) was retrieved from the HST archive, corrected for bad pixels, cosmic rays were removed, and astrometric calibration was applied by aligning the galaxies with the ACS images. The central regions of the SW and NE galaxies in these three HST band are displayed in context with their analysis in §3.1.
2.2. Deep B+V+I Band Ground-Based Imaging
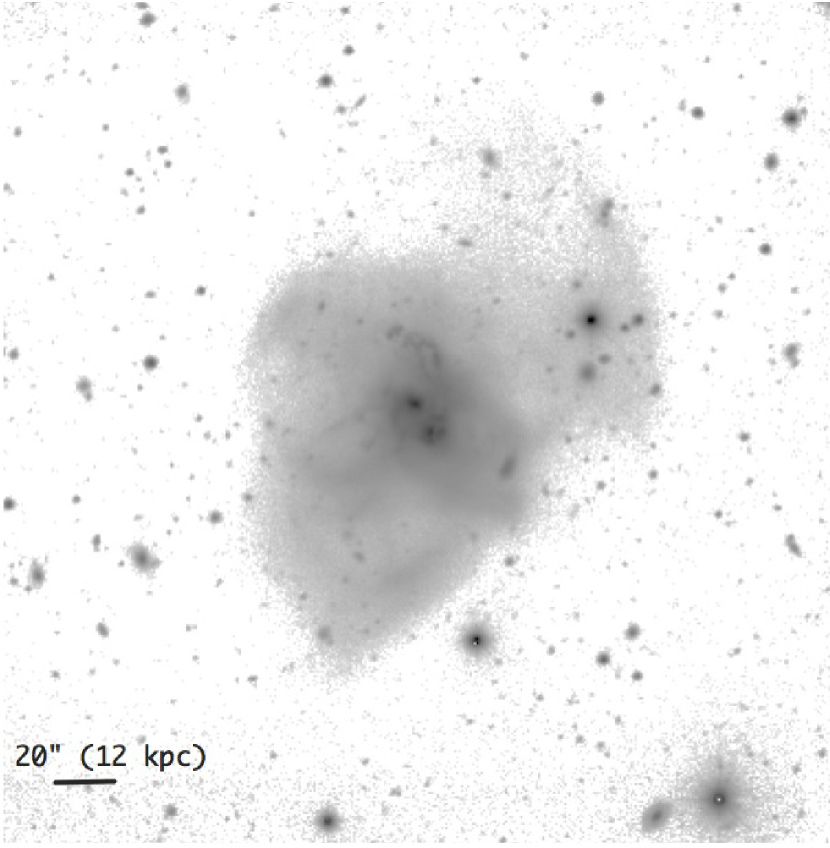
To complement the HST high-resolution imagery and reveal the faintest emission possible, Figure 2 shows the result of spatial registration and stacking of B, V, and I band images obtained on 1998 December 22 and 2000 May 04 with the University of Hawaii 2.2 m telescope (effective seeing 15 FWHM). Details of the data acquisition and reduction are given by Ishida (2004). The data are presented using Gaussian equalization to contrast the low and high surface-brightness features in the same view. Highly asymmetric, low surface-brightness emission can be seen spanning 103 kpc (29) from the SE to NW extremities, which is approximately twice the extent of the faintest emission visible in the HST ACS data, SDSS, and previously published imagery.
2.3. X-Ray Observations with Chandra and XMM-Newton
2.3.1 Chandra Observations
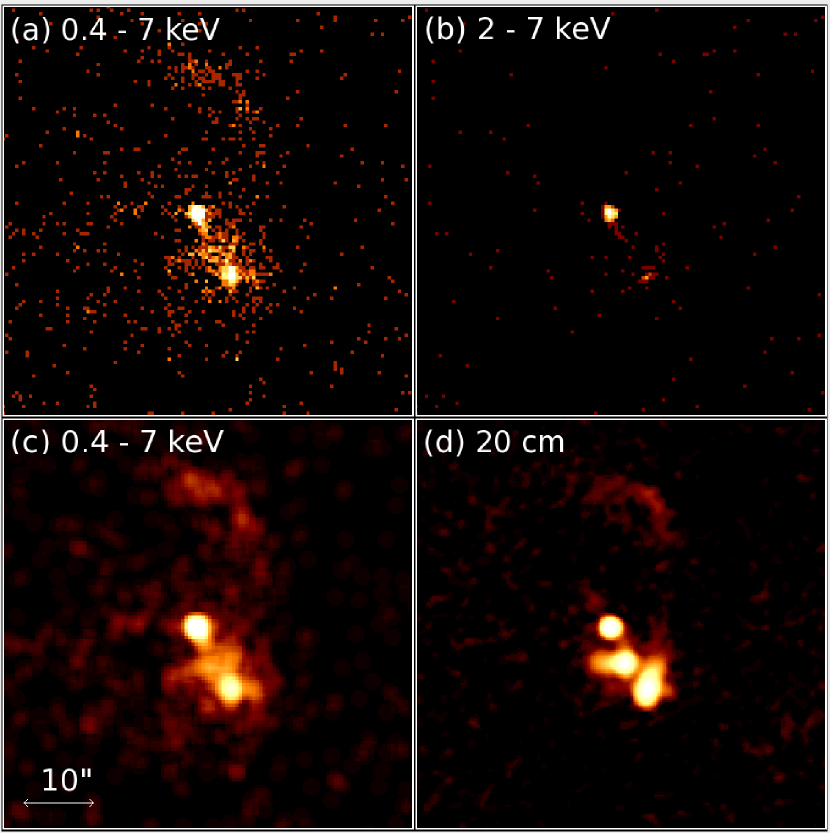
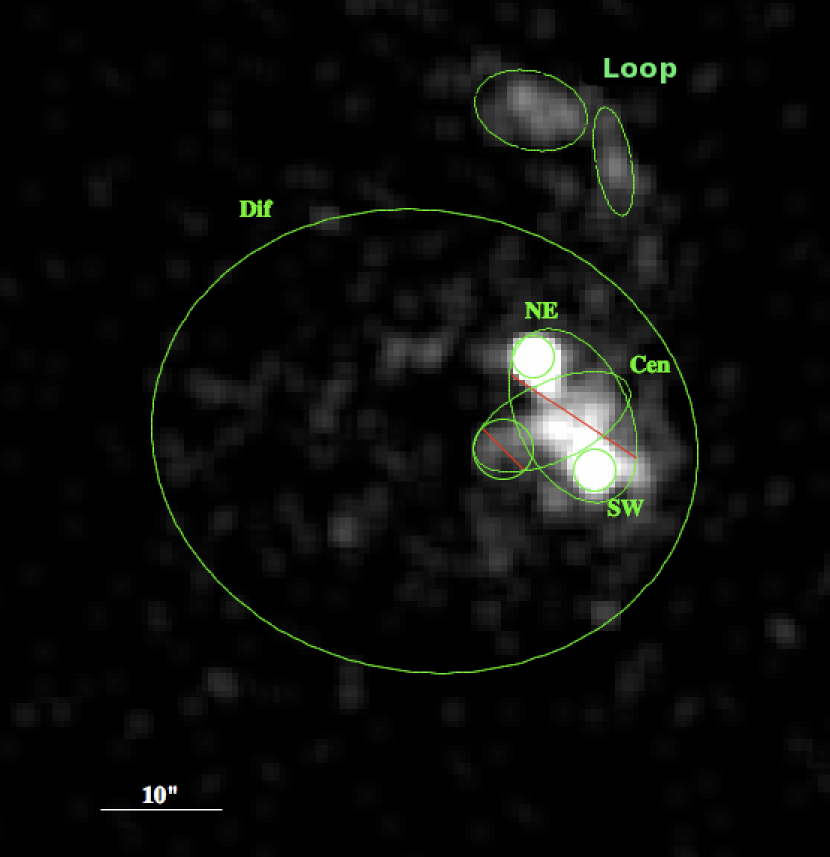
Chandra observations were obtained with the Advanced CCD Imaging Spectrometer (ACIS-S) on 2001 November 02 (PI A. Read) with a total integration time of 19.95 ks. The spatial resolution is ″ FWHM. These observations were first presented by Brassington et al. (2007). In order to make refined measurements, highlight additional features, and analyze the X-ray properties alongside observations at other wavelengths, the data were taken from the Chandra Data Archive333http://cxc.harvard.edu/cda/ (OBSID #2044) and re-processed using standard procedures in CIAO 4.0. The data were corrected for detector response and converted to flux density () units. Details of the data reduction procedures can be found in Iwasawa et al. (2011). Figure 3 shows the resulting full band (0.4 - 7 keV) image, the hard band (2-7 keV) image, a smoothed version of the full band data, and the 20 cm radio continuum image from Mazzarella et al. (1988). Figure 4 illustrates apertures with parameters listed in Table 1 that were used to define regions of interest, and Figure 5 shows the X-ray spectra constructed in these regions.

2.3.2 XMM-Newton Observations
X-ray observations with XMM-Newton, reaching significantly higher energies (10 keV) than Chandra (7 keV), were acquired with the European Imaging Photon Camera (EPIC) on 2002 May 15 (PI A. Read). The data obtained with the EPIC pn-CCD camera were utilized, providing an angular resolution of 6″ FWHM and a spectral resolution of (. The observation was performed with the Thin Filter in the extended full-window imaging mode. The data set (#0055990501) was taken from the XMM-Newton Science Archive444http://xmm.esac.esa.int/xsa/ and processed with standard procedures in the software packages SAS 8.1 and HEASoft 6.6 utilizing the latest calibration files (as of 2009 January). Time intervals with high particle background levels were discarded, leaving useful data with an effective exposure time of 13.2 ks. The count rate in the 0.4-10 keV band is 0.19 count s-1. The X-ray emission is only marginally resolved by XMM, therefore the spectrum for the total system emission within a large aperture of 45″ radius is produced here. Figure 6 shows the resulting XMM spectrum of the integrated emission from the system. Key features include Si XIII K (1.853 keV) emission, as also observed in the Chandra spectra of the two nuclei (Fig. 5), and strong Fe K line emission at 6.4 keV.

2.3.3 X-ray Measurements
| Region | RA, DEC (J2000) | a″ | b/a | PA° |
|---|---|---|---|---|
| (1) | (2) | (3) | (4) | (5) |
| SW | (13:38:17.31,+48:16:31.9) | 1.7 | 1.00 | |
| NE | (13:38:17.82,+48:16:41.2) | 1.7 | 1.00 | |
| Center | (13:38:17.66,+48:16:35.8) | 6.9 | 0.47 | 155 |
| Loop A | (13:38:17.15,+48:16:57.2) | 4.5 | 0.32 | 10 |
| Loop B | (13:38:17.83,+48:17:01.4) | 4.7 | 0.68 | 75 |
| DiffuseaaThe diffuse emission is approximated by the flux within this large ellipse after subtraction of the flux in the two small ellipses in the following two rows, which are proceeded by a minus sign in this table and marked with red lines in Figure 4. | (13:38:18.71,+48:16:34.2) | 22.5 | 0.84 | 80 |
| Diffuse -1 | -(13:38:17.49,+48:16:36.3) | 4.6 | 0.61 | 25 |
| Diffuse -2 | -(13:38:18.07,+48:16:33.6) | 2.5 | 1.00 | |
| Total | (13:38:17.66,+48:16:35.8) | 33.0 | 1.00 |
| Region | F(Fe K | kT (soft) | ||
|---|---|---|---|---|
| (1) | (2) | (3) | (4) | (5) |
| Mrk 266 SW | ||||
| Mrk 266 NE | ||||
| Between Nuclei | ||||
| Northern Loop | ||||
| Diffuse Region | ||||
| Total (Chandra) | ||||
| Total (XMM) |
Note. — Measurements of the Chandra spectra in regions of interest; they are not corrected for absorption. Column (1): Region of interest, as illustrated in Fig. 4. Column (2): Flux of the Fe K line in units of . The rest-frame energy measured from the XMM spectrum for this feature is keV. The value for the NE nucleus is a upper limit. Column (3): Temperature (kT in units of keV) of the soft (0.5-2 keV) X-ray emission with uncertainties. Column (4): Flux in the soft (0.5-2 keV) X-ray band in units of ; the estimated relative uncertainty is 20%. Column (5): Flux in the hard (2-7 keV) X-ray band in units of ; the estimated relative uncertainty is 30%. No flux is detected above 2 keV in the Northern Loop or in the Diffuse Region. Mrk 266 SW shows some emission above 2 keV, but most of the detected flux appears to originate in the Fe K line. The NE and SW galaxies also both show strong Si XIII emission at 1.8-1.9 keV.
Spectral measurements and results from continuum model fitting of the Chandra and XMM-Newton observations are presented in Table 2. The sum of the emission in the elliptical regions misses some low surface-brightness emission that is recovered in measurements of the total system in a circular aperture with a radius of 33″. The total system fluxes measured by Chandra are, within the uncertainties (i.e., 20% in and 30% in ), in agreement with the XMM total flux measurements listed in Table 2. There may be some contribution of photoionized gas (by the AGNs) in the soft X-ray emission, but the S/N is insufficient to fit this component; therefore, the temperatures given in Table 2 are obtained from a model fit consisting of thermal emission due to star formation. Mrk 266 NE has an AGN component, which is modeled by an absorbed power-law with photon index 1.8 (fixed) and ; correcting for this absorption suggests an intrinsic hard-band flux of . There is a tail of hard X-ray emission in the source between the nuclei, but its spectral shape is not well constrained; the 2-7 keV flux given here is mostly due to this hard tail.
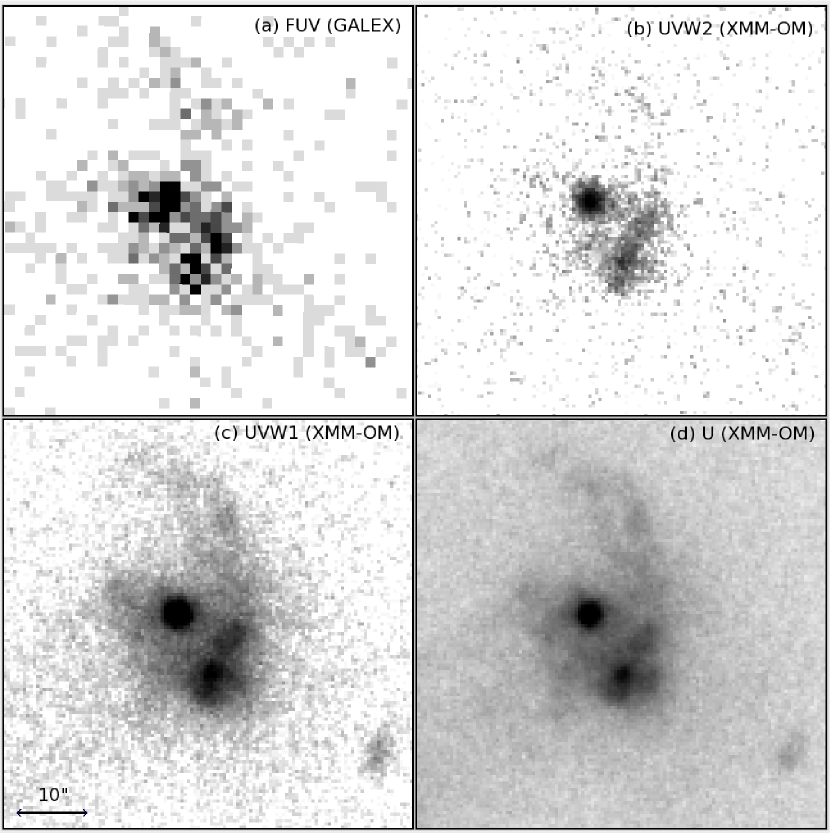
2.4. Ultraviolet Imaging with GALEX and XMM-Newton OM
Ultraviolet images of Mrk 266 were obtained on 2004 June 04 with an integration time of 111 sec in the NUV (2271 Å) and FUV (1528 Å) bands during the All Sky Imaging Survey (AIS) conducted by the Galaxy Evolution Explorer (GALEX). The data were extracted from MAST (tile AISCHV3_104_01135) as provided by the standard GALEX data processing pipeline, and photometry was performed directly from these images using procedures outlined by Howell et al. (2010).
Contemporaneously with the X-ray observations by XMM-Newton summarized above, the Optical/UV Monitor Telescope (XMM-OM) obtained observations of Mrk 266 in the U (3000 - 3900 Å), UVW1 (2450-3200 Å), and UVW2 (1800-2250 Å) filters with exposure times of 800, 1000 and 1400 sec, respectively. The XMM-OM instrument and data characteristics are described by Mason et al. (2001). These images have significantly better spatial resolution (″ FWHM) and higher sensitivity than the AIS observations from GALEX, and they also considerably extend the UV coverage. The reduced and calibrated XMM-OM images, as produced using the methods documented by Kuntz et al. (2008), were obtained from MAST(dataset #0055990501). Photometric measurements (presented in §2.6.2) were calibrated using zero-points in Table 19 of the XMM-Newton Users Handbook,555http://heasarc.gsfc.nasa.gov/docs/xmm/uhb/XMM_UHB.html which are 19.1890, 18.5662 and 16.5719 AB mag in the U, UVW1 and UVW2 filters, respectively. Figure 7 displays the UV imagery of Mrk 266 in the FUV band of GALEX and in three filters of XMM-OM.
2.5. Mid- and Far-Infrared Imaging with Spitzer
Imaging observations of Mrk 266 were obtained with the Spitzer Space Telescope as part of the Cycle 1 General Observing program for GOALS (PID 3672; PI J. Mazzarella). The Infrared Array Camera (IRAC, Fazio et al., 2004) onboard Spitzer was used to image the source at 3.6, 4.5, 5.8 and 8.0 µm (AOR #12305408). Due to the presence of bright galactic nuclei, the high dynamic range (HDR) mode was utilized in all four bands. The HDR frames were comprised of 1-2 second exposures to calibrate pixels that may have saturated in the 30-second exposures. The IRAC observations involved dithering to achieve redundancy to correct for cosmic ray hits and bad pixels. The Multiband Imaging Photometer for Spitzer (MIPS, Rieke et al., 2004) was utilized to image Mrk 266 at 24, 70 and 160 µm using the Photometry and Super Resolution mode (AOR #12349184). Each observation consisted of multiple 3-second integrations to insure adequate redundancy. Mapping cycles were used at each wavelength to correct the data for transients in the detectors. Details of the post-pipeline data processing and calibration of these data are given in Mazzarella et al. 2012 (in preparation). Various Spitzer images and photometric measurements for Mrk 266 are incorporated into the following sections in conjunction with the analyses of data in other spectral regions.
2.6. Mrk 266 from Radio Through X-Rays
2.6.1 Multi-Waveband Imagery
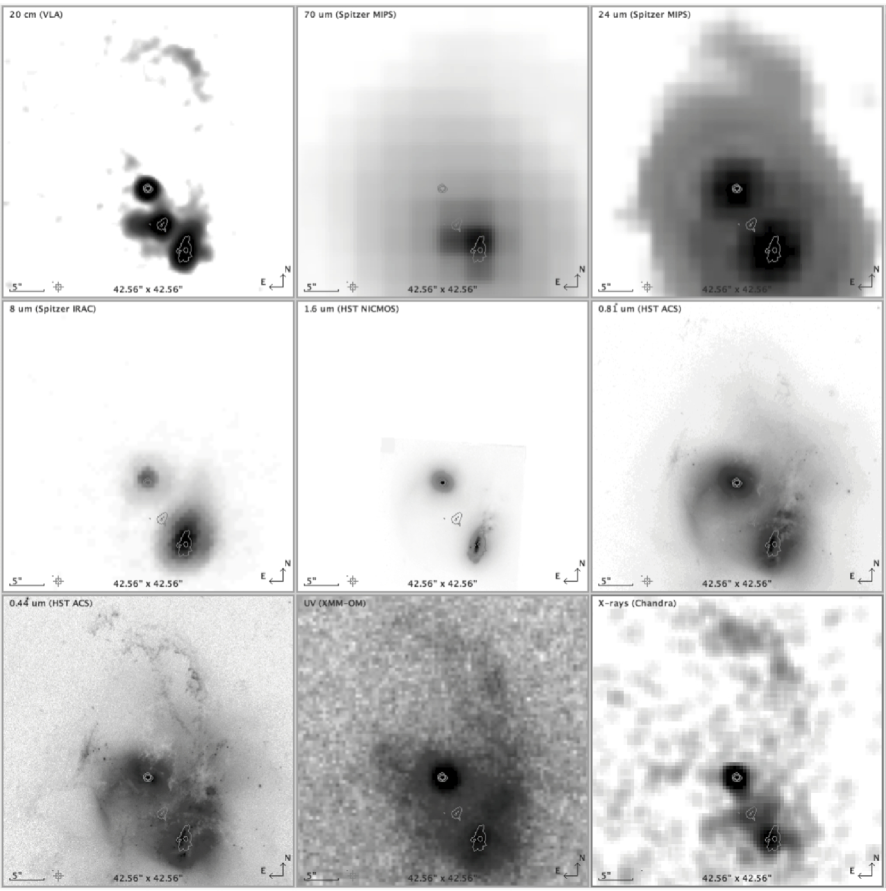
Figure 8 shows the structure of Mrk 266 in nine spectral regions spanning radio through X-rays using the observations discussed above. All images are displayed with the same orientation and scale to facilitate comparison. In each panel, contours of the 6 cm (4.885 GHz, 03 x 04 beam) image from Mazzarella et al. (1988) are superposed, primarily for astrometric reference. It is noteworthy that the elongated radio continuum structure with double peaks observed between the galaxy nuclei, as well as the elongated morphology of the SW galaxy, was confirmed in more sensitive 8.4 GHz observations with 027 x 022 resolution (Leipski et al., 2006).
2.6.2 Photometry and Spectral Energy Distributions
Using the data displayed in Figure 8 and other passbands discussed above, aperture photometry was performed in elliptical regions parameterized in the Appendix (Table 11 and Figure 31). However, an alternative measurement procedure was necessary for the lower resolution far-infrared data. The spatial resolution of the MIPS images, determined by the size of the Spitzer PSF (/D) are 6″, 18″, and 40″ FWHM at 24, 70 and 160 µm respectively. The 24 µm IRAC image (Fig. 8c) clearly resolves the two galaxies, and it also reveals dust emission from the Northern Loop which is analyzed in §3.4.3. The 10″ angular separation of the two galaxies is too small to be resolved by MIPS at 70 and 160 µm. However, as shown in Figure 8b, the centroid of the 70 µm emission clearly indicates that the SW galaxy dominates the far-infrared emission from the system. The centroid of the 160 µm emission is also consistent with the SW galaxy providing the majority of the flux.
The 70 and 160 µm flux densities for the two galaxies were estimated as follows: The relation derived by Xu et al. (2010),
| (1) |
was used with measured monochromatic luminosities at 8 and 24 µm to derive (1 - 1000 µm) estimates of , , and for Mrk 266 SW, NE, and the total system respectively. Then, the ratios of measured for the total system were applied to estimate the 70 and 160 µm flux densities for the two galaxies (Table 13). The estimated uncertainty in the fluxes derived using this procedure is 20%. Comparison of the summation of the estimated component flux densities with the measured total 70 and 160 µm flux densities for the total system (Table 12) indicates consistency within the uncertainties.
Appendix Tables 12 and 13 present photometry for the total system and for the components (SW, NE, the central region between the nuclei, and the Northern Loop). Figure 9 displays the resulting Spectral Energy Distributions (SEDs).
2.7. Mid-Infrared Spectroscopy with Spitzer
Mid-infrared spectroscopy of Mrk 266 obtained in staring mode with the Infrared Spectrograph (IRS, Houck et al., 2004) onboard Spitzer have been published by Brandl et al. (2006), Dudik et al. (2007), and Bernard-Salas et al. (2009). Unfortunately, these observations suffer from aperture affects that resulted in missing emission from some components in different spectral regions. Appendix §5.2 provides clarification of which emission features have been measured for each component of Mrk 266.
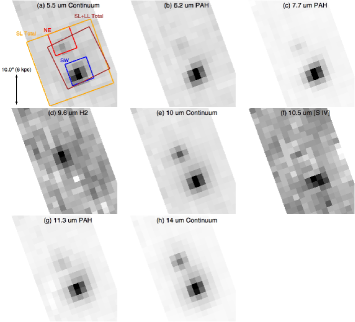
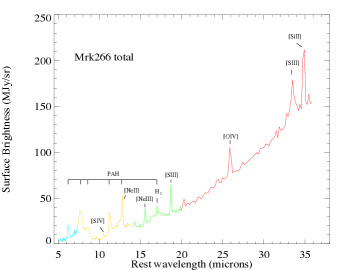
In order to overcome the limited spatial extent of the staring-mode observations, the IRS spectral map obtained on 2005 January 10 available in the Spitzer archive (program P03269; PI J. Gallimore; AOR #12459264) was used to construct spectra for each nucleus and for the total system. Spectral mapping with the SL module consisted of 13 integrations, each 6 seconds in duration and stepped perpendicular to the slit with an interval of 18 (half the slit width). Mapping with the LL module was performed with 5 integrations, each 6 seconds in duration and stepped perpendicular to the slit with an interval of 485 (half the slit width). The individual calibrated spectra produced by version S15.3 of the Spitzer Science Center pipeline were used to construct a spectral cube with the CUBISM package (Smith et al., 2007). In all cases, background observations were assembled from the non-primary slit and subtracted from the data. CUBISM was used to construct images over specific wavelength ranges and spectral features, including 5.5, 10, and 14 µm continuum and continuum-subtracted 6.2, 7.7, and 11.3 µm PAH, 9.7 µm S(3), and [S IV] 10.5 µm emission lines. These images are presented in Figure 10, where the first panel illustrates rectangular apertures used in CUBISM to extract 1-d spectra.

| Feature | Flux () | EQW (µm) |
|---|---|---|
| (1) | (2) | (3) |
| Mrk 266 Totalaa Spectral measurements for the integrated emission from both galaxies in Mrk 266. Features in the 5.2-14.5 µm (SL) and 14.5-38 µm (LL) regions were measured from the 1-d spectrum plotted in Figure 11; this region is 4x4 LL pixels in size, where each pixel is 51 x 51, as outlined in brown in Figure 10(a). | ||
| pp These line fluxes were measured using PAHFIT and include an extinction correction based on a fit with a dust screen, which corresponds to mag. | ss EQW measurements for the PAH features were measured using a spline-fitting technique for estimating the local continuum. Spline fitting was also used to estimate fluxes of features in the SL spectra of the individual galaxies which could not be measured with PAHFIT. See text for details. | |
| pp These line fluxes were measured using PAHFIT and include an extinction correction based on a fit with a dust screen, which corresponds to mag. | ||
| pp These line fluxes were measured using PAHFIT and include an extinction correction based on a fit with a dust screen, which corresponds to mag. | ||
| pp These line fluxes were measured using PAHFIT and include an extinction correction based on a fit with a dust screen, which corresponds to mag. | ss EQW measurements for the PAH features were measured using a spline-fitting technique for estimating the local continuum. Spline fitting was also used to estimate fluxes of features in the SL spectra of the individual galaxies which could not be measured with PAHFIT. See text for details. | |
| pp These line fluxes were measured using PAHFIT and include an extinction correction based on a fit with a dust screen, which corresponds to mag. | ||
| pp These line fluxes were measured using PAHFIT and include an extinction correction based on a fit with a dust screen, which corresponds to mag. | ||
| pp These line fluxes were measured using PAHFIT and include an extinction correction based on a fit with a dust screen, which corresponds to mag. | ||
| pp These line fluxes were measured using PAHFIT and include an extinction correction based on a fit with a dust screen, which corresponds to mag. | ||
| pp These line fluxes were measured using PAHFIT and include an extinction correction based on a fit with a dust screen, which corresponds to mag. | ||
| pp These line fluxes were measured using PAHFIT and include an extinction correction based on a fit with a dust screen, which corresponds to mag. | ||
| pp These line fluxes were measured using PAHFIT and include an extinction correction based on a fit with a dust screen, which corresponds to mag. | ||
| pp These line fluxes were measured using PAHFIT and include an extinction correction based on a fit with a dust screen, which corresponds to mag. | ||
| pp These line fluxes were measured using PAHFIT and include an extinction correction based on a fit with a dust screen, which corresponds to mag. | ||
| pp These line fluxes were measured using PAHFIT and include an extinction correction based on a fit with a dust screen, which corresponds to mag. | ||
| pp These line fluxes were measured using PAHFIT and include an extinction correction based on a fit with a dust screen, which corresponds to mag. | ||
| pp These line fluxes were measured using PAHFIT and include an extinction correction based on a fit with a dust screen, which corresponds to mag. | ||
| pp These line fluxes were measured using PAHFIT and include an extinction correction based on a fit with a dust screen, which corresponds to mag. | ||
| pp These line fluxes were measured using PAHFIT and include an extinction correction based on a fit with a dust screen, which corresponds to mag. | ||
| pp These line fluxes were measured using PAHFIT and include an extinction correction based on a fit with a dust screen, which corresponds to mag. | ||
| Mrk 266 SWbb Spectral features measured from the SL spectra of Mrk 266 SW and NE as plotted in Figure 12c and 12b. These 1-d spectra were extracted from the blue and red regions of the spectral map shown in Figure 10, which have dimensions of 5x5 SL pixels, where each pixel is 18 x 18. | ||
| ss EQW measurements for the PAH features were measured using a spline-fitting technique for estimating the local continuum. Spline fitting was also used to estimate fluxes of features in the SL spectra of the individual galaxies which could not be measured with PAHFIT. See text for details. | ss EQW measurements for the PAH features were measured using a spline-fitting technique for estimating the local continuum. Spline fitting was also used to estimate fluxes of features in the SL spectra of the individual galaxies which could not be measured with PAHFIT. See text for details. | |
| ss EQW measurements for the PAH features were measured using a spline-fitting technique for estimating the local continuum. Spline fitting was also used to estimate fluxes of features in the SL spectra of the individual galaxies which could not be measured with PAHFIT. See text for details. | ss EQW measurements for the PAH features were measured using a spline-fitting technique for estimating the local continuum. Spline fitting was also used to estimate fluxes of features in the SL spectra of the individual galaxies which could not be measured with PAHFIT. See text for details. | |
| ss EQW measurements for the PAH features were measured using a spline-fitting technique for estimating the local continuum. Spline fitting was also used to estimate fluxes of features in the SL spectra of the individual galaxies which could not be measured with PAHFIT. See text for details. | ss EQW measurements for the PAH features were measured using a spline-fitting technique for estimating the local continuum. Spline fitting was also used to estimate fluxes of features in the SL spectra of the individual galaxies which could not be measured with PAHFIT. See text for details. | |
| ss EQW measurements for the PAH features were measured using a spline-fitting technique for estimating the local continuum. Spline fitting was also used to estimate fluxes of features in the SL spectra of the individual galaxies which could not be measured with PAHFIT. See text for details. | ||
| Mrk 266 NEbb Spectral features measured from the SL spectra of Mrk 266 SW and NE as plotted in Figure 12c and 12b. These 1-d spectra were extracted from the blue and red regions of the spectral map shown in Figure 10, which have dimensions of 5x5 SL pixels, where each pixel is 18 x 18. | ||
| ss EQW measurements for the PAH features were measured using a spline-fitting technique for estimating the local continuum. Spline fitting was also used to estimate fluxes of features in the SL spectra of the individual galaxies which could not be measured with PAHFIT. See text for details. | ss EQW measurements for the PAH features were measured using a spline-fitting technique for estimating the local continuum. Spline fitting was also used to estimate fluxes of features in the SL spectra of the individual galaxies which could not be measured with PAHFIT. See text for details. | |
| ss EQW measurements for the PAH features were measured using a spline-fitting technique for estimating the local continuum. Spline fitting was also used to estimate fluxes of features in the SL spectra of the individual galaxies which could not be measured with PAHFIT. See text for details. | ss EQW measurements for the PAH features were measured using a spline-fitting technique for estimating the local continuum. Spline fitting was also used to estimate fluxes of features in the SL spectra of the individual galaxies which could not be measured with PAHFIT. See text for details. | |
| ss EQW measurements for the PAH features were measured using a spline-fitting technique for estimating the local continuum. Spline fitting was also used to estimate fluxes of features in the SL spectra of the individual galaxies which could not be measured with PAHFIT. See text for details. | ss EQW measurements for the PAH features were measured using a spline-fitting technique for estimating the local continuum. Spline fitting was also used to estimate fluxes of features in the SL spectra of the individual galaxies which could not be measured with PAHFIT. See text for details. | |
| ss EQW measurements for the PAH features were measured using a spline-fitting technique for estimating the local continuum. Spline fitting was also used to estimate fluxes of features in the SL spectra of the individual galaxies which could not be measured with PAHFIT. See text for details. | ||
| ss EQW measurements for the PAH features were measured using a spline-fitting technique for estimating the local continuum. Spline fitting was also used to estimate fluxes of features in the SL spectra of the individual galaxies which could not be measured with PAHFIT. See text for details. | ||
With a pixel size of 51x51 and a spatial resolution of 10″ on the red end, we cannot use the LL observations (14-38 µm) to separate the two galaxies as we can with the SL data (5.2-14.5 µm). Further, the LL map did not completely cover the NE nucleus. A “total” SLLL 1-d spectrum was extracted that contains most of the integrated emission of the system over 5-38 µm in a region 4x4 LL pixels in size (outlined in brown in Figure 10a). Another 1-d spectrum was extracted that fully covers both galaxies in the 5-14 µm SL spectrum in a region 13x13 SL pixels in size, where each pixel is 18x18. The resulting 1-d spectra, representing the sum of the emission from both galaxies, are presented in Figure 11 (SLLL) and in Figure 12a (SL only), respectively. In addition, 1-d extractions from the SL map were constructed that provide a clean separation between the NE and SW nuclei; these regions are shown as red and blue rectangles (each covering 5x5 SL pixels) in Figure 10a, and the resulting 1-d spectra are presented in Figures 12b and 12c. Due to the very high mid-infrared surface brightness of the galaxies, with a spatial resolution of 36 (two 18 pixels), even the SL spectral map does not enable a reliable separation of the nuclear emission from the diffuse emission surrounding the nuclei.
This is the first time mid-infrared spectra are available for each nucleus in Mrk 266 separately, as well as the integrated emission from both galaxies. Table 3 lists measured line fluxes and equivalent widths for the total system and, where possible, the individual galaxies. The fluxes were converted from surface brightness units () to by multiplying by the extraction aperture. Most of the spectral features in the SLLL spectrum of the integrated emission from the galaxy pair (Fig. 11) were measured using the PAHFIT package (Smith et al., 2007), which includes decomposition of various spectral components and an extinction correction based on a fit with a dust screen, corresponding to mag. However, since the nuclei were resolved only in the SL data (Figure 12b and 12c), and PAHFIT produces most reliable continuum and feature fits when SL and LL are combined, we have used a spline-fitting technique (Hony et al., 2001; Peeters et al., 2002) to measure the SL features listed in Table 3 for the SW and NE galaxies. This further allows for direct comparison to other sources in the literature where this technique has been employed. Spline-fitting was also utilized for the PAH EQW measurements to estimate the local continuum and the silicate absorption strength. As noted by Smith et al. (2007), spline fitting systematically underestimates PAH fluxes compared to full spectral decomposition via PAHFIT. The various measurements are identified in Table 3 with superscripts (PAHFIT) and (spline fitting), respectively.
3. Analysis & Discussion
Mrk 266 is a complex collection of many different physical subsystems, each of which are identified in Fig. 1 and discussed in the following subsections. At the macro level, Mrk 266 is clearly a merging system with two distinct AGNs coupled with strong spatial differences in current star formation, outflow, merger dynamics and AGN heating. But within that framework there are several specific questions that we can directly address using our multiwavelength data set: What are the structural parameters and underlying stellar populations of the two host galaxies? Is there evidence for dynamic outflow from each nucleus? Is the NE LINER a genuine AGN or is it powered by star formation? Is the origin of the observed diffuse emission tidal or due to galactic superwinds? What are the properties of the suspected star clusters that are forming in the merging system? Is Mrk 266 a unique dual AGN system, or are we observing a short-lived phase of an evolutionary process that commonly occurs when two massive, dusty disks merge?
3.1. Interacting/Merging Galaxies Revealed
3.1.1 Morphology and Bulge/Disk/Bar Decomposition
| Band | (%) | C(n) | |||||
|---|---|---|---|---|---|---|---|
| (1) | (2) | (3) | (4) | (5) | (6) | (7) | (8) |
| Mrk 266 SWaaThe 1.6 µm image of Mrk 266 SW is modeled as the sum of components. The 0.44 and 0.81 µm images are too confused by extinction and H II regions to derive reliable models of the underlying stars; simple models were fit at these wavelengths only to examine the residual images for fine structure in the star-forming regions (Fig. 16). | |||||||
| 0.44µm | B(4) | ||||||
| 0.44µm | T | ||||||
| 0.81µm | B(4) | ||||||
| 0.81µm | T | ||||||
| 1.6µm | B(4) | ||||||
| 1.6µm | D(1) | ||||||
| 1.6µm | b | ||||||
| 1.6µm | P | ||||||
| 1.6µm | T | ||||||
| Mrk 266 NEbbThe 1.6 µm image of Mrk 266 NE is modeled as the sum of components; there are no significant Bar or Disk components detected for this galaxy. | |||||||
| 0.44µm | D(1) | ||||||
| 0.44µm | T | ||||||
| 0.81µm | B(4) | ||||||
| 0.81µm | D(1) | ||||||
| 0.81µm | T | ||||||
| 1.6µm | B(4) | ||||||
| 1.6µm | P | ||||||
| 1.6µm | T | ||||||
| Mrk 266 Total (SW+NE)ccThe total flux (apparent magnitude) accounted for in the GALFIT model for the galaxy pair in each HST passband. | |||||||
| 0.44µm | T | ||||||
| 0.81µm | T | ||||||
| 1.6µm | T | ||||||
Note. — Fitting parameters and results of modeling the HST data using GALFIT. Column (1): HST Filter: B = F435W (0.44µm); I = F814W (0.81µm); H = F160W (1.6µm). Column (2): Percentage of the total flux of the GALFIT model of the galaxy pair accounted for by the indicated component of the model image at 0.44, 0.81 or 1.6 µm. Column (3): Model components coded as follows: B=Bulge (Sersic index n=4); D=Disk (Sersic index n=1); b=bar; P=Point source based on Tiny Tim Krist (1993); T = Total flux from all GALFIT components for the galaxy. Column (4): Bulge-to-Disk ratio. Column (5): Effective radius of the Sersic fit (kpc units). Column (6): Axis ratio of the component fit. Column (7): Position angle of the component fit (degrees east of north). Column (8): Apparent AB magnitude of the sum of the GALFIT model components for each galaxy, where . Conversions between the AB and Vega systems (http://www.stsci.edu/hst/acs/analysis/zeropoints/) are as follows: .
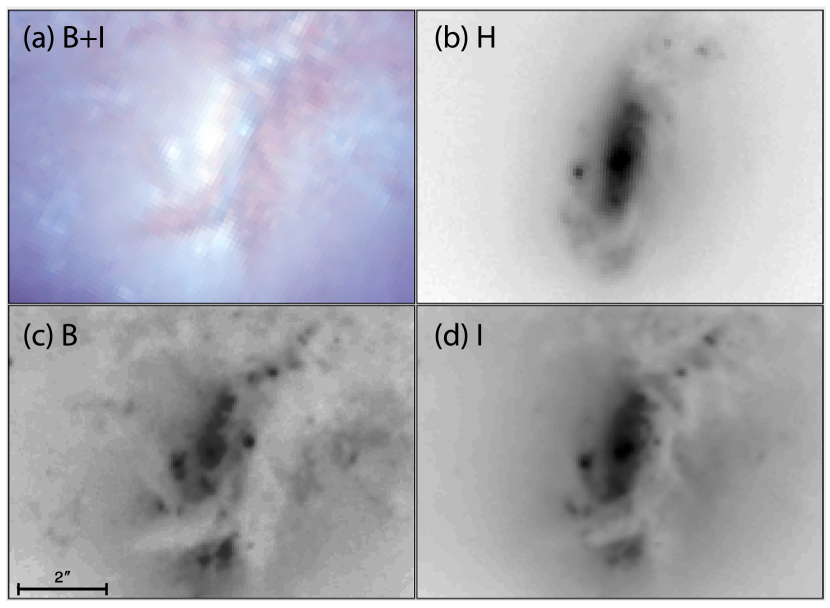
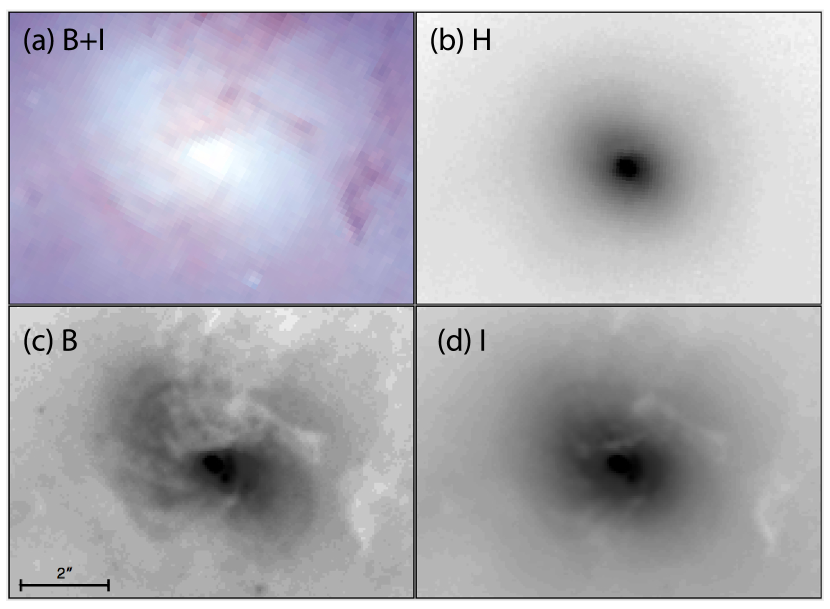
High resolution HST imagery (Fig. 1) has revealed a wealth of morphological structures within Mrk 266. At optical wavelengths (B and I) there are two distinct galaxies within a diffuse and highly asymmetric envelope. Patchy dust obscuration and clumpy star formation regions are evident on a variety of scales. The underlying structure of the two galaxies is best revealed in the NICMOS H band image. The SW galaxy (Fig. 14) is a barred spiral with two arms and predominant dust features, and the estimated Hubble type is SBb (pec). The NE galaxy (Fig. 14) has no discernible spiral arms and appears to be Hubble type S0 or S0/a (pec).
In the extremities of the system are three notable features at optical wavelengths (Fig. 1): (1) Extending 25″ (15 kpc) to the north is a fragmented, filamentary feature known as the Northern Loop; this structure is examined in detail in §3.4. (2) Faint emission extending 60″ (36 kpc) to the south and 40″ (24 kpc) to the south-east from the center of the system appears to be tidal debris. The deep B+V+I image (Fig. 2) reveals much fainter, asymmetric emission spanning 103 kpc (29). The peculiar morphology and vast extent of this emission are consistent with numerical simulations of tidal debris created during a major merger (e.g., Mihos, 1999; Cox et al., 2006). (3) Approximately 25″ to the south-west are two objects that could be either knots near the end of a tidal tail or background galaxies. The latter interpretation is favored due to what appear to be compact nuclei and spiral arms. If these are background galaxies with similar physical size and separation as Mrk 266, their projected diameters (3″) and separation (2″) imply they are 5 times further away than Mrk 266 (distance 650 Mpc, ); redshift measurements are needed for confirmation.
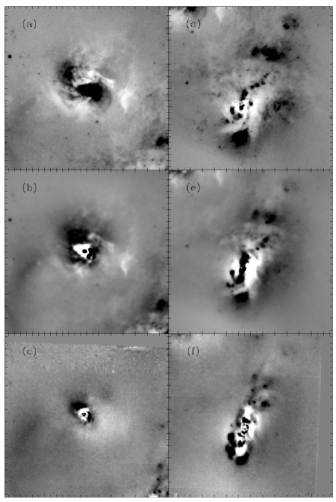
Using GALFIT (Peng et al., 2002), quantitative isophotal analysis was performed on both component galaxies in the three HST bands. At 1.6 µm (H band) where dust obscuration is minimal and thus permits the most reliable decomposition of the underlying galaxies, various trial fits involving possible point source, bulge, disk and/or bar components were made; potential nuclei were modeled using a point spread function generated from the Tiny Tim package (Krist, 1993)666http://www.stsci.edu/software/tinytim/tinytim.html. Figure 15 shows the components of the best-fitting models in the H band. Due to extensive, patchy dust obscuration and complex star-forming regions, only models with possible bulge and disk components were considered in the B and I bands. Subtraction of the best-fitting models from the direct images are useful to elucidate further fine structures, as shown visually for all three bands in Figure 16. The results of this structural analysis at H band are the following: a) The SW galaxy has no detected point source emission; its nucleus is therefore obscured by dust even at 1.6 µm. b) The NE galaxy exhibits no significant disk component and therefore can be modeled using only a point source plus bulge profile. c) Approximately 10% of the total H-band light is in the form of diffuse emission which is likely tidal in origin (Fig. 15a). In the optical bands the residual images reveal the following: a) The SW galaxy has many knots of emission which are likely star clusters or associations; these features are analyzed in detail in §3.6. b) The largest features in the B-band residual image appear to be giant star-forming regions (superassociations) situated on both ends of the stellar bar. This phenomenon, in which superassociations occur on both sides of stellar bars much more frequently than they occur on a single side, was pointed out by Magtesian & Khachikian (1991). c) The NE galaxy has numerous radial, asymmetric filaments (most pronounced in the B band) indicative of bi-conical outflow from the AGN; this region is analyzed more fully in §3.2.4. Parameters from the GALFIT modeling are listed in Table 4. Adopting a distance modulus of 35.55 mag (see §1.3), the apparent H magnitudes (Vega system) of Mrk 266 SW and NE (Table 4) correspond to remarkably similar absolute magnitudes of and .
3.1.2 Galaxy Luminosities and Derived Stellar Masses
The H-band (1.6 µm) luminosity function of galaxies in the Coma Cluster has been approximated as a Schechter function with mag (de Propris et al., 1998). Therefore, Mrk 266 SW and NE are 50% and 30% more luminous than the typical galaxy in the local universe. Applying the mean mass-to-light ratio at H-band of 4.6 (/) for spiral galaxies (including early types S0 and S0/a; Gavazzi et al. (1996)) results in total galaxy mass estimates of (SW) and (NE). Estimates of the stellar mass in old stars derived from the mean ratio of based on model predictions by Lacey et al. (2008) produces similar results of (SW) and (NE).777The model curve for galaxies in Figure 13c of Lacey et al. (2008), adjusted to h 0.70, corresponds to a range of 4.5 - 7.0 in . A significantly lower ratio of was found by Arnouts et al. (2007) and Cole et al. (2001). The nature of this discrepancy is beyond the scope of this article. SED model fitting can improve on stellar masses estimated from monochromatic luminosities U et al. (2011). Next we turn attention to the nuclei and their circumnuclear regions.
3.2. The Nuclei and Circumnuclear Regions
3.2.1 Optical and Infrared Spectral Diagnostics
Using optical emission-line diagnostics, the NE nucleus has been classified as a LINER and the SW nucleus as a Seyfert 2 (e.g., Hutchings et al., 1988; Mazzarella & Boroson, 1993; Ishigaki et al., 2000). At optical wavelengths, the NE nucleus has brighter continuum emission and less extinction than the SW nucleus. Yuan et al. (2010) classified Mrk 266 NE as a composite AGN/starburst nucleus, and they concluded that the NE and SW nuclei have similar relative AGN and starburst contributions within the LINER and Seyfert 2 branches of the [O III]5007/ vs. [O I]6300/H diagnostic diagram.888The identifications of the NE and SW nuclei of Mrk 266 were mistakenly swapped in the tables and figures of Kim et al. (1995) and Veilleux et al. (1995), and thus also in Table 2 of Yuan et al. (2010). The identifications are corrected here. Since the IRS apertures encompass an area of 5.4 x 5.4 kpc2 (Fig. 10), whereas published optical diagnostics were obtained through smaller apertures of 1 x 1 kpc2, nuclear emission is more diluted by extranuclear emission in the mid-IR spectra than in the optical spectra. However, since the mid-IR spectra penetrate much more dust than the optical spectra, if there is sufficient centrally concentrated dust heated by an embedded AGN, this emission can potentially overpower the extended star formation (as in many ULIRGs). The IRS spectra of the two nuclei (Fig. 12) show them to be similarly dominated by PAH emission, and the large PAH equivalent widths (Table 3) indicate the prominence of star-formation (e.g., Armus et al., 2007). The NE source has lower PAH fluxes and equivalent widths, indicating excess warm dust emission compared to the SW source.
| Diagnostic | SW Galaxy | NE Galaxy | Total System | ||||||
|---|---|---|---|---|---|---|---|---|---|
| Value | Value | Value | |||||||
| (1) | (2) | (3) | (4) | (5) | (6) | (7) | (8) | (9) | (10) |
| (1) aa Based on published high-resolution, staring-mode data (Appendix Table 14). The NE nucleus was not fully covered in these observations. | 0.93 | 23% | 73% | 0.67 | 17% | 64% | |||
| (2) aa Based on published high-resolution, staring-mode data (Appendix Table 14). The NE nucleus was not fully covered in these observations. | 0.14 | 11% | 53% | ||||||
| (3) PAH EQW [µm]bb Based on new low-resolution measurements from the IRS spectral map (Table 3). | 0.67 | 0% | 0.4 | 30% | 0.47 | 10% | |||
| (4) PAH EQW [µm]bb Based on new low-resolution measurements from the IRS spectral map (Table 3). | 0.54 | 69% | 43% | 0.25 | 79% | 56% | 0.46 | 71% | 46% |
| (5) bb Based on new low-resolution measurements from the IRS spectral map (Table 3). | 1.6,8.6 | 47% | 9% | 0.56,6.4 | 81% | 33% | 2.0,2.9 | 52% | 11% |
| (6) cc The continuum flux density ratio estimated via interpolation in the SED of the global system, , is within 8% of the value computed from the IRS (SL+LL) spectrum. Given this close agreement, since the 15 and 30 µm fluxes could not be measured for the individual galaxies with the IRS (because they were unresolved by the LL module), the flux ratios estimated by interpolation from the broad-band photometry in the SEDs for the individual galaxies (Table 13) were substituted. | 3.9 | 89% | 82% | 3.3 | 92% | 87% | 4.8 | 85% | 76% |
| Meandd The mean values omit the 6.2 µm PAH EQW because there is no bolometric correction available for this diagnostic. | 40% | 52% | 71% | 59% | 47% | 49% | |||
| Std. Dev. | 35% | 29% | 28% | 27% | 33% | 28% | |||
Note. — Column (1): Mid-infrared spectral diagnostic used to estimate the fractional contribution of radiation from an AGN. Columns (2)-(4): For the SW galaxy, the value of the diagnostic followed by the percentage of AGN contribution to the diagnostic luminosity and the estimated percentage of AGN contribution to . The latter uses the zero-points and bolometric corrections from Veilleux et al. (2009); see §3.2.1. Columns (5)-(7): The same as columns (2)-(4), but for the NE galaxy. Columns (8)-(10): The same as columns (2)-(4), but for the total system.
The 6.2 µm PAH EQWs and 9.7 µm silicate absorption strengths999The empirical method of Spoon et al. (2007) was applied to the SL spectrum (5-14 µm region; Fig. 12) to measure silicate strengths of for the SW nucleus, the NE nucleus, and the total system, respectively. A similar absorption strength, , was measured using the 5-40 µm SLLL data for the total system (Fig. 11). place the SW galaxy on the bottom right vertex of the silicate depth versus PAH EQW plot of Spoon et al. (2007), a region dominated by galaxies with high star formation rates; the NE galaxy (with similar Si strength but a lower 6.2 µm EQW of 0.4 µm compared to 0.67 µm for the SW galaxy) is in a region populated with AGN and ULIRGs having substantial dust heating by non-stellar radiation. The observed silicate strength in the SW galaxy () is intermediate between the values observed for the face-on galaxy NGC 7714 and the edge-on galaxy M82, which is consistent with the derived disk axial ratio of °for Mrk 266 SW (Table 4). The observed silicate absorption strengths correspond to for the SW and NE nuclei, respectively; these values result from applying the relationships and (Roche & Aitken, 1984). However, for clumpy dust configurations expected in AGN tori, emission and absorption cannot be disentangled along the line of sight and therefore these are lower limits to the true silicate column to the central sources.
Various empirical diagnostics have been published to quantify the relative contributions to dust heating from AGN and starburst sources (e.g., Armus et al., 2007). We focus primarily on the suite of methods applied to local ULIRGs and QSOs by Veilleux et al. (2009), including application of their bolometric corrections to express the estimated AGN dust heating contributions as a fraction of . All methods assume that the line emitting regions are subject to the same amount of extinction within the aperture, which may be questionable, especially for Mrk 266 SW. Since the NE galaxy was not observed in the high-resolution IRS mode, methods that involve the fine structure lines can only be applied to the SW galaxy. The results are summarized in Table 5. For the SW galaxy, the [O IV]/[Ne II] ratio indicates an overall AGN contribution to of 73%, whereas the [Ne V]/[Ne II] ratio suggests 53%. The 6.2 µm EQW indicates that the mid-IR luminosity of the SW component is due entirely to a starburst, and a 30% AGN contribution is inferred for the NE galaxy. This diagnostic suggests a 10% AGN contribution to the mid-IR luminosity of the total system.101010The CAFE SED fitting package provides an independent, model-dependent estimate of the AGN contribution to the total infrared luminosity. See §3.5. The AGN fractions estimated from the 6.2 µm EQW are substantially lower than those obtained using the EQW of the 7.7 µm PAH feature (see Table 5). This discrepancy may be due to greater difficulty measuring the 7.7 µm PAH feature because of confusion from surrounding features (8.6 µm PAH and silicate absorption) and complications in defining the proper continuum level.
The continuum shape over 3-16 µm provides another diagnostic. The physical basis is that dust grains located near an AGN can reach temperatures as high as 500-1000 K (before they sublimate), and such high dust temperatures would completely dominate the continuum emission compared to dust heated by a starburst. This method was developed by Laurent et al. (2000), adapted by Peeters et al. (2004) for interpretation of mid-IR spectra from the Infrared Space Observatory (ISO), and modified further for Spitzer IRS data by Armus et al. (2007). Continuum fluxes in the relevant passbands were combined with the 6.2 µm PAH fluxes, and the formulation of Veilleux et al. (2009) was used to compute AGN fractions before and after bolometric corrections. The results suggest is 33% for the NE galaxy, but only about 10% for the SW galaxy and the total system. The continuum flux density ratio provides our final empirical diagnostic; Veilleux et al. (2009) found this to be an effective substitute for the PAH-free and silicate-free MIR/FIR ratio.
On average, with a standard deviation of nearly 30%, these diagnostics indicate approximately equal contributions of AGN and starburst heating of the dust in both galaxies (Table 5). This is similar to the average AGN contribution to found for ULIRGs in the QUEST sample with Seyfert 2 spectral classifications (Veilleux et al., 2009). The variation in these diagnostics may be due, in part, to the different optical depths probed by different wavelengths.
Finally, there is a significant difference in the PAH properties of the galaxies. The modeling of Draine & Li (2001) combined with the ratios of the PAH features ( and ) indicate a dominance of relatively warm, ionized PAHs in the SW component and cooler, neutral PAHs in the NE component. The PAH line flux ratios for the total system reflect the fact that the SW galaxy dominates the total mid- and far-infrared emission from Mrk 266. The PAH ratio in Mrk 266 NE (0.76) is substantially larger than the ratio in the SW galaxy (0.34). The former is similar to the ratios observed in other galaxies containing AGNs, and the latter is near the mean value (0.25) observed in galaxies with pure starburst (H II) spectra (Smith et al., 2007). Following the inferences proposed by Smith et al., this suggests that the hard radiation field surrounding the partially obscured AGN in the NE galaxy may be preferentially destroying PAH molecules small enough to emit at 7.7 µm, thus increasing the 11.3µm/7.7µm PAH ratio compared to the SW nucleus which has a more heavily obscured AGN and a higher star formation rate.
3.2.2 Warm Molecular Gas
In the NE galaxy, the IRS spectral maps (Figs. 10 and 12) reveal bright rotational lines of molecular hydrogen, specifically µm and µm. In the SW galaxy, the µm emission is much weaker, and any µm emission that may be present intrinsically is overshadowed by the blue wing of the strong 12.6 µm PAH complex. In contrast, the SW galaxy has bright µm emission, whereas the NE nucleus is undetected in this feature. Give that the NE galaxy has 8 and 24 µm flux densities that are 1.8 and 5.7 times fainter than the SW galaxy (see Table 13 and Fig. 9), it is surprising that the line emission in Mrk 266 NE is substantially more luminous than in Mrk 266 SW. This suggests that the majority of the detected line emission in the NE galaxy has a different origin than in the SW galaxy. A prime candidate for the enhanced emission in Mrk 266 NE is shock excitation.
Analysis of near-infrared spectra of Mrk 266 led Davies et al. (2000) to conclude that fast C shocks () are responsible for 70% of the 1-0 S(1) emission in the two nuclei, with fast J shocks () and UV fluorescence responsible for the remaining 30%. Davies et al. demonstrated that the powerful radio continuum and 1-0 S(1) emissions observed in Mrk 266 NE cannot be explained with pure starburst models, and they are likely generated predominantly by shocks. Furthermore, the presence of 1-0 S(1) emission extended out to 1 kpc from the NE nucleus, with a large equivalent width and low S(1)/B ratio that rule out star formation, provides additional evidence that the emission is excited by spatially extended shocks. Davies et al. speculated that Mrk 266 NE may itself be a very close pair of galactic nuclei with shocked molecular gas settled between them, as observed in NGC 6240. Our interpretation of the latest data from Spitzer, HST and Chandra favors an AGN-driven outflow as the origin of strong shocks in Mrk 266 NE (see §3.2.4).
3.2.3 AGN Black Hole Masses
Marconi & Hunt (2003) established an empirical relation between H-band bulge luminosity and nuclear black hole mass. Combining measurements of the total H-band absolute magnitudes with the GALFIT image decomposition results showing that 78% and 99% of the total H-band light is in the bulge components of the SW and NE galaxies (§3.1.1), the calibration of Marconi & Hunt (Group 1 Galaxies) yields black hole masses of (SW) and (NE). An independent diagnostic is available from the high-ionization, mid-IR emission lines detected in Mrk 266 SW. Using the approach of Dasyra et al. (2008), the µm (µm) emission line luminosity of computed from published high-resolution IRS measurements (Appendix Table 14) corresponds to for the SW nucleus, which is consistent with the IR photometry. The inferred black hole masses are therefore in the typical range known to power other luminous AGNs.
3.2.4 Evidence for Nuclear Outflows and Shocks
In the previous section the radiation field heating the dust in the two nuclear environments was established. In this section evidence is presented for dynamical outflows from the nuclei. Within a radius of 2″ (1.2 kpc) around the NE nucleus (Figs. 14c,d and 16a), the HST optical imaging reveals structure that is strongly suggestive of a bi-conical outflow with patchy dust extinction. Evidence for this interpretation rather than spiral arms is as follows: (a) Multiple filamentary structures extend radially and asymmetrically from the nucleus rather than in a symmetric spiral pattern. (b) There is the lack of improved definition in any spiral arm pattern in the I-band image relative to B-band. (c) Photometric deconvolution (§3.1.1) indicates the NE galaxy is bulge-dominated. There are also conspicuous knots of concentrated emission along a concave arc located 0 .4 W of the nucleus. Table 6 lists photometric measurements of the 3 most prominent optical knots. The individual knot luminosities of are substantially higher than other luminous star clusters in Mrk 266 (see §3.6, Fig. 27), and their orientation in an arc embedded within a triangular bow-like structure suggests they may be energized by an AGN-driven outflow in a situation similar to M51 (Cecil, 1988) rather than by unusually massive star clusters.
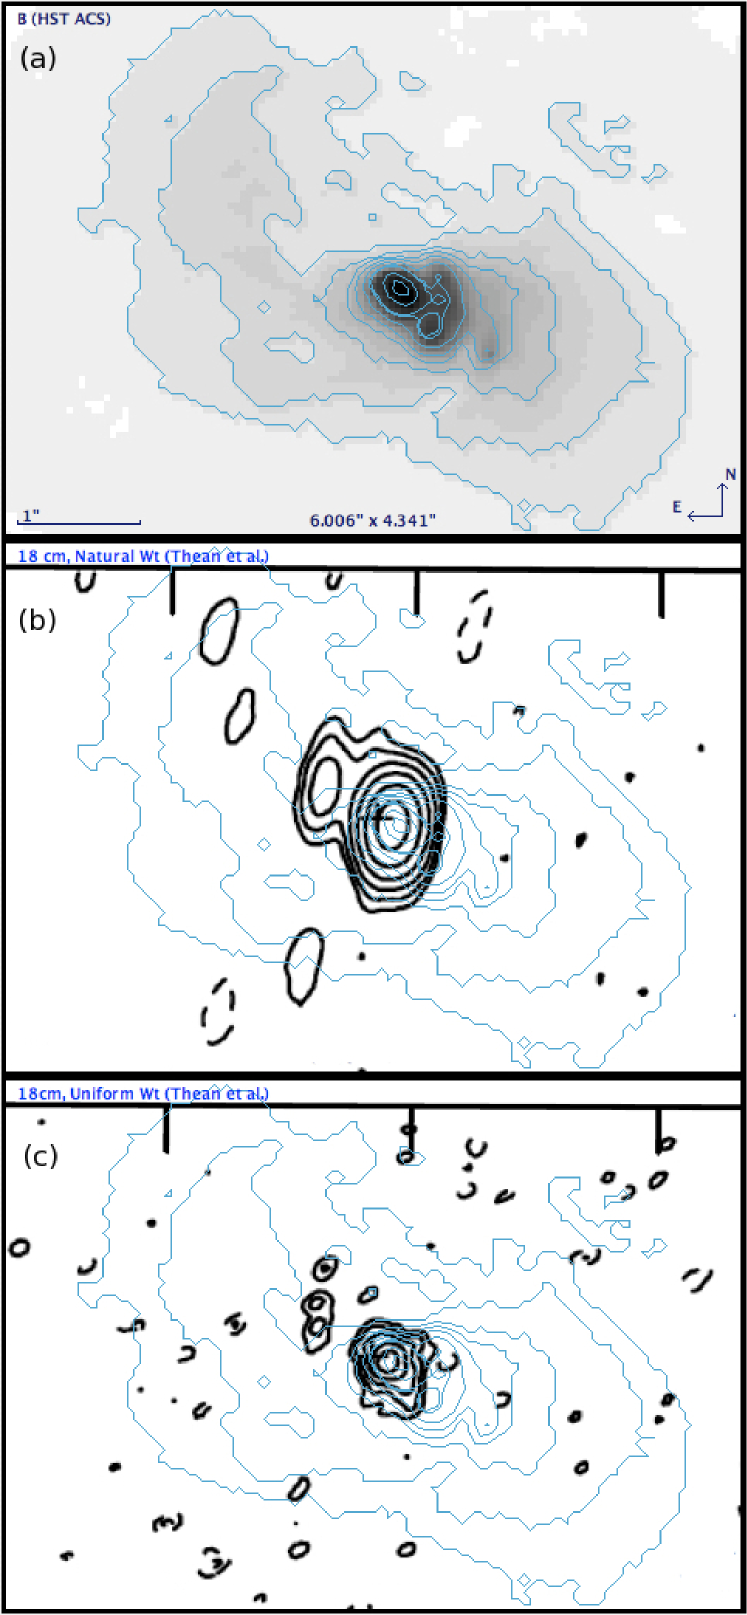
A comparison of the B-band emission with published high-resolution 18 cm radio continuum observations (Thean et al., 2001) is shown in Figure 17. The 18 cm MERLIN map exhibits limb-brightening at the location of the optical arc and knots 04 (240 pc) west of the nucleus, and a secondary radio continuum peak is located 06 (360 pc) NE of the nucleus. An axis at position angle intersects the radio/optical nucleus, the radio emission 06 NE of the nucleus, and B-band knots situated 04 and 09 SW of the nucleus. Bi-conical AGN outflows with aligned radio continuum and optical emission-line radiation with dimensions of 1 kpc are commonly observed in Seyfert galaxies and in some LINERS, especially those that are nearly face-on such as NGC 1068 and M51. (See, for example, the review of Veilleux et al. (2005).) The optical morphology of the NE nuclear environment is remarkably similar to the radiative bow shock observed 5″(230 pc) south of the nucleus of M51, which is also a LINER (Cecil, 1988; Ford et al., 1985).
The combined data suggest that the AGN in Mrk 266 NE is ejecting radio-emitting plasma along an axis with PA , which is also aligned with a bi-conical ionization cone that extends to a radius of 1.2 kpc from the nucleus. The 6 cm radio power () and spectral index () of Mrk 266 NE are consistent with optically thin synchrotron emission (Mazzarella et al., 1988), and these parameters are similar to other luminous AGNs in the local universe (e.g., Rush et al., 1996). The radio jet appears to be running into dense material concentrated 04 (240 pc) SW from the nucleus, but it is able to escape to a greater distance in the opposite direction (Fig. 17). This hypothesis is consistent with the velocity field measured for the molecular gas (§3.7) which shows a rotating disk aligned roughly orthogonal to this putative ionization cone. The B-I color map from the HST data (Figure 26) reveals that dust is distributed primarily along the NS direction, which again is roughly orthogonal to the AGN jet/outflow axis. Regions inside a radius of 2″ from the nucleus of Mrk 266 NE (Fig. 26) are as blue as the Northern Loop, which is known to be dominated by bright [O III] 5007 and H line emission (Hutchings et al., 1988; Ishigaki et al., 2000)111111The [0 III] 5007 line emission around Mrk 266 NE (Hutchings et al., 1988) is elongated along the same position angle as the HST B-band image contoured here in Figure 17. This provides evidence that the HST B-band image is dominated by emission-line gas in this region. The passband of the F435W filter omits the [O III] lines, but it includes the [O II] 3727 line observed in the spectrum of Mrk 266 NE (Kim et al., 1995) and also at large radii within the ionization cones of many AGNs (e.g. Tadhunter, 2008).. Davies et al. (2000) provided independent evidence for shock-heated gas in this region in the form of the radial profile of the 1-0 S(1) 2.12 µm emission line. Furthermore, the emission-line image presented by Davies et al. (2000) shows a bimodal structure oriented at PA centered on the NE nucleus, providing additional support for our hypothesis. While most of this evidence is indirect, its combined weight favors our interpretation that the extranuclear emission around Mrk 266 NE is dominated by an AGN-powered outflow that is generating spatially extend shocks.
Similar events may be occurring in the SW galaxy. The HST images show numerous compact structures over a 1 kpc size region that share the same NS orientation as the prominent stellar bar seen in the H-band image. It is highly likely that these compact structures are young stellar clusters (see §3.6). Observations at 1.6 GHz (Thean et al., 2001) show sub-arsecond structure aligned NW-SE with respect to the SW nucleus, similar to previous 5 Ghz measurements (Mazzarella et al., 1988). Comparing the new HST images with the extended radio emission maps suggests the circumnuclear emission in this case is dominated by star formation. An AGN outflow in the SW galaxy may be present but is difficult to detect due to its relatively high inclination (). It is very difficult to disentangle starburst-driven winds from AGN-driven winds in galaxies containing both a Seyfert 2 and a powerful starburst Veilleux et al. (e.g., 2005). Although evidence for an AGN-driven outflow in the circumnuclear region of Mrk 266 SW is weak, there is ample evidence for a starburst-driven superwind on a larger scale based on the filamentary and [O III] line emission that comprise the Northern Loop, and from the fainter emission-line filaments labeled “eastern arm-like region” and “west knot” in Figure 2 of Ishigaki et al. (2000), all of which appear to connect or align with the SW nucleus. Properties of the kpc-scale outflow revealed by the new data are discussed in §3.4.
| R.A | Dec | ||
|---|---|---|---|
| hh:mm:ss.sss | dd:mm:ss.ss | mag | mag |
| (1) | (2) | (3) | (4) |
| 13:38:17.75 | 48:16:40.9 | ||
| 13:38:17.75 | 48:16:41.1 | ||
| 13:38:17.75 | 48:16:41.3 |
Note. — Columns (1) and (2): J2000 R.A. and Dec, with uncertainty in the absolute astrometry of 05. Columns (3) and (4): Apparent magnitudes and uncertainties measured in the HST/ACS F435W (B) and F814 (I) bands, respectively.
3.2.5 Hard X-Ray Properties of the Nuclei
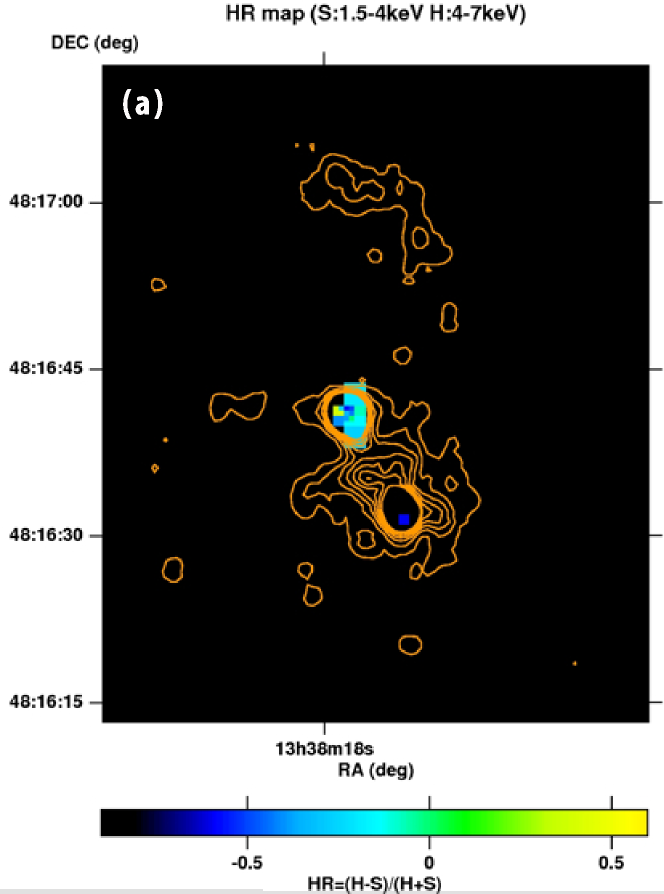
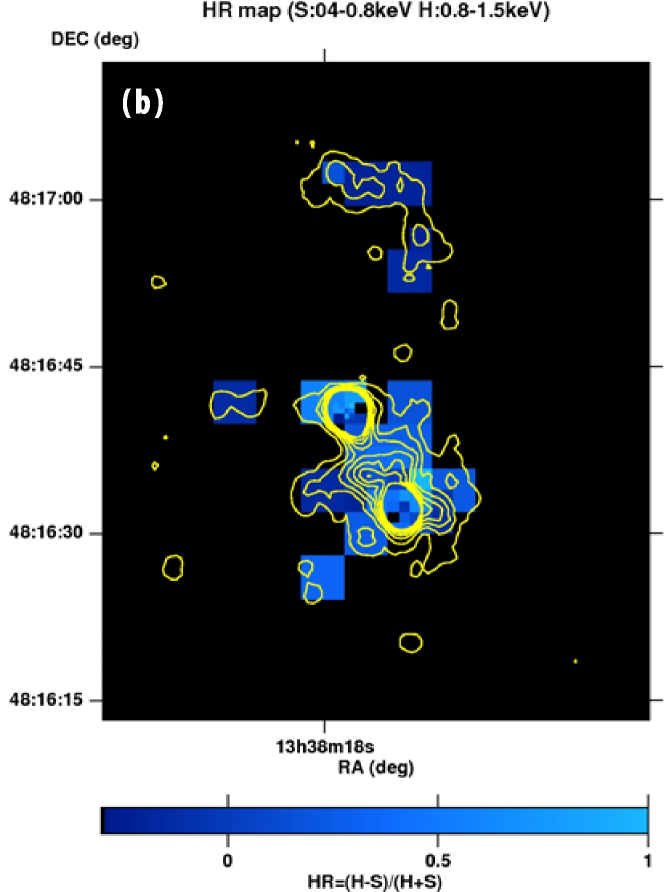
Basic properties of the Chandra data for Mrk 266 were presented by Brassington et al. (2007). We have performed additional processing to reveal previously unknown structural details and physical properties. As shown in Figure 18a, the SW (Seyfert 2) nucleus has a much softer X-ray spectrum and lower luminosity than the NE (LINER or composite AGN/Starburst) nucleus. The luminosity and hard X-ray spectrum of the NE nucleus provide a clear signature of an obscured AGN. The X-ray spectrum obtained of the integrated system with XMM (Fig. 6) shows strong Fe K emission at 6.4 keV. This high-ionizaton feature has been observed in the ULIRGs Arp 220 (Iwasawa et al., 2005), in the LIRG NGC 3690 (Ballo et al., 2004), and more recently in the integrated (stacked) spectrum of 30 LIRGs in the GOALS sample that are relatively faint in the hard X-ray band (Iwasawa et al., 2009). Modeling the global XMM spectrum of Mrk 266 with a thermal (soft, extended) component due to star formation and an absorbed power-law (hard, compact) component from the AGNs results in an absorption column of , which is close to the lower limits derived from the 9.6 µm silicate absorption feature (§3.2.1).
Unlike XMM, Chandra was able to resolve the nuclei and has detected two separate sources of (2-7 keV) X-ray emission, with the bulk of the combined emission emanating from the NE component (Fig. 3). The physical origin of the bright Fe K line observed in the XMM spectrum of the integrated system is less clear. The Chandra spectrum of the total emission from Mrk 266 (Fig. 5f) does not show the Fe K line. However, the large aperture (33″ radius) used to produce this spectrum introduces substantial noise in the background in the higher energy bands where there is very little extended emission. Detailed inspection of the Chandra data within small apertures centered on the nuclei provides a strong clue that the Fe K line originates primarily from the SW nucleus121212The 6-7 keV (Fe K) image contains 10 counts from the NE nucleus and 4 counts from the SW nucleus, while the neighboring 3-6 keV band shows a much larger contrast, with 79 counts from the NE nucleus and only 1 count from the SW nucleus. In other words, the spectrum of the SW nucleus has almost no detected flux at energies keV, but it shows a sudden rise at the Fe K band (Fig. 5). This suggests that the hard band spectrum of the SW nucleus is dominated by flux from the Fe K line., indicative of a reflection-dominated spectrum of a heavily obscured AGN. Since optical spectra reveal the presence of Seyfert 2 activity in the SW nucleus, the weakness of the hard X-ray emission can be understood as a consequence of suppression of X-rays by Compton thick absorption. Heavy obscuration towards the SW nucleus as inferred from the Spitzer IRS spectrum and the large column density of obscuring material estimated from the CO (1-0) observations (§3.7) support this interpretation of the X-ray data.
If the 6-7 keV photons in the Chandra spectrum of the SW nucleus are due to Fe K line emission, as our analysis suggests, the flux of ph cm-2 s-1 accounts for the majority of the Fe K line flux detected in the XMM-Newton spectrum. This means that the NE nucleus accounts for most of the escaping hard X-ray continuum, but it emits little Fe K emission. The equivalent width of Fe K expected from a source absorbed by cm-2, as inferred for the NE nucleus (Table 2), is at most 0.1 keV (e.g. Awaki et al., 1991; Krolik et al., 1994; Ghisellini, Haardt & Matt, 1994), while the equivalent width measured in the XMM-Newton spectrum is keV. This mismatch can be readily explained if the bulk of the Fe K line emission is from the SW nucleus. The Fe K line luminosity is . Using the relation derived in Iwasawa et al. (2005) for the Type 2 AGN in the HyLIRG IRAS F15307+3252, the intrinsic 2-10 keV luminosity of the obscured AGN in Mrk 266 SW is , where f is the (unknown) visible fraction of the reflecting matter in the line of sight. The observed ratio for the SW nucleus also indicates a highly absorbed X-ray source with . (See Appendix §5.3.)
Finally, it should be emphasized that the Fe K line detections are marginal. However, we gain confidence through independent detections for the global system with XMM and for the SW galaxy with Chandra, combined with line flux values that agree within the uncertainties in the calibrations and S/N (Table 2). A detection of Fe has also been reported at the 90% confidence level with ASCA GIS observations (Risaliti et al., 2000). Confirmation requires more sensitive observations.
3.2.6 The LINER in Mrk 266 NE
The relative strength of the PAH features, silicate absorption, and continuum shape indicate Mrk 266 NE is typical of an “IR LINER” or “Transition” between IR-luminous LINERs and “Type 1” LINERs. Although the mid-IR data for Mrk 266 NE are only sufficient to compute 3 of the 6 parameters in diagnostic diagrams (Fig. 2 of Sturm et al. (2006)), the relatively small 6.2µm/11.2µm PAH flux ratio (1.1) is on the low end of the distribution observed in “IR LINERs” (where the transition to Type 1 occurs), whereas the continuum flux ratios and place Mrk 266 NE on the extreme end of the distribution of “IR LINERs” with very red, warm dust continua. Mid-IR spectral data alone do not permit a clear distinction between the various kinds of energy sources that can power a LINER (e.g., Kewley et al., 2006; Ho, 2008). However, there are at least four indicators that Mrk 266 NE is energized primarily by an AGN, in addition to shock excitation: (1) small PAH equivalent widths and a deficiency of 6.2 and 7.7 µm PAH emission relative to 11.3 µm PAH emission (§3.2.1); (2) morphological evidence for a radiative bow shock within an ionization cone aligned with radio plasma in an outflow (§3.2.4); (3) spectral properties of the luminous, hard X-ray point source (§3.2.5); and (4) a high flux ratio (Imanishi et al., 2009). Indeed, the strength and spatial extent of emission indicate the presence of extensive shocks in the region (§3.2.2) that may be triggered by outflow from the AGN (§3.2.4).
3.3. Between the Colliding Galaxies
3.3.1 A Search for Counterparts to the Radio Emission
The bright radio continuum source located between the nuclei of Mrk 266 (Figs. 8a and 19) was interpreted as a source of enhanced synchrotron emission induced by shocking of the ISM at the interface of the merging galaxies (Mazzarella et al., 1988). Direct imaging of this area with HST ACS and NICMOS, Spitzer IRAC and MIPS (§2.6.1), and spectral mapping with Spitzer IRS (§2.7) reveales no obvious source at optical continuum, near-IR, or mid-IR wavelengths. This strongly rules out any third (dust-obscured) galaxy nucleus or a luminous off-nuclear star-forming region as observed in other interacting systems such as the Antennae (Mirabel et al., 1998) and II Zw 96 (Inami et al., 2010). Additonally, there is no detectable emission from this region in the near-UV or far-UV (Fig. 7 and 8h), and there is no detection of warm molecular gas in the continuum-free µm emission-line image (Fig. 10). Although a bridge of CO (1-0) emission has been detected between the galaxies (Imanishi et al., 2009), it is shown below (§3.7) that this material is located to the north of the central radio continuum emission. Next we turn attention to the only other waveband where a source of radiation has been detected that is spatially correlated with the radio continuum emission between the galaxies.
3.3.2 X-Rays Between the Nuclei
Substantial soft X-ray emission has been detected between the nuclei of Mrk 266 by Chandra. Analysis by Brassington et al. (2007) indicates that the X-ray emitting gas in this region has an intrinsic luminosity of and has a temperature of 1.07 keV, approximately twice the temperature of much more diffuse emission surrounding the two galaxies (omitting the nuclei and northern source). Brassington et al. suggested that this X-ray emission is likely associated with the collision between the two galaxies, as proposed previously for the radio continuum emission (Mazzarella et al., 1988). The present work extends these results using reprocessing of the Chandra data to enhance the definition of structure in the diffuse X-ray emission and to further characterize its physical properties.
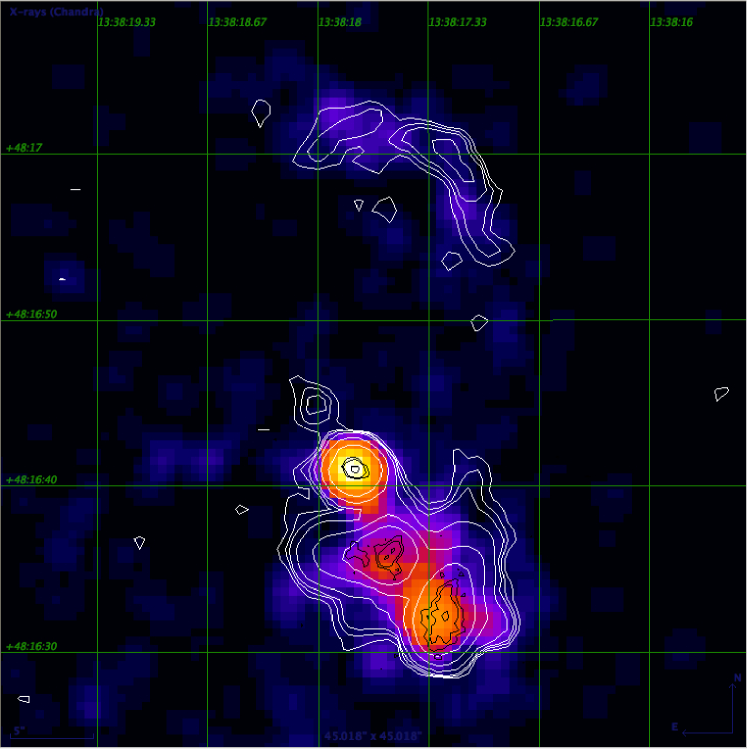
To begin with, Figures 3 and 19 illustrate the remarkable correspondence between the 0.4-7.0 keV X-ray emission and the 20 cm radio continuum emission. As shown in Figures 8 and 19, the higher resolution 6 cm radio continuum emission (03x04 FWHM), resolves the 20 cm source into a flattened structure with two sub-components. These components are coincident with the brightest knot of soft (0.4-4.0 keV) X-ray emission located between the galaxies. The contours of the full-band (0.4-7.0 keV) X-ray image in Figure 18 further delineates the structure of the diffuse emission between the nuclei and to the south-west. Figure 18b presents the hardness of the soft X-ray spectrum (), which indicates temperature variations within the extended emission.
Figure 20 provides a detailed view of the enhanced soft X-ray emission between the two galaxies. The X-ray spectra in the three circled areas show that the SE region has a softer spectrum indicating a lower temperature (kT keV) than the other two regions (kT keV). These differences are also reflected in the map, where the SE region has and the region at the radio continuum peak and 4″ NE of that location have ranging from 0.2 to 0.4. Therefore, the X-ray brightness certainly increases at the radio peak, but the temperature of the X-ray emitting gas at that location is similar to the region 4″ (2.4 kpc) to the NW. A caveat in this analysis is that when dust obscuration is also varying spatially, may not translate directly to real variations in temperature.
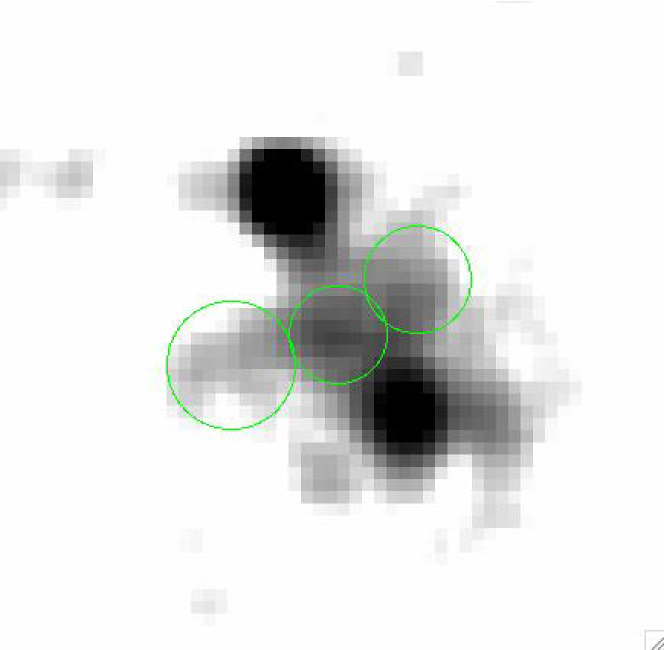
Table 7 presents physical parameters estimated from spectral analysis of the soft X-ray emission illustrated in Figure 20. The most straightforward interpretation is that the X-ray emission is the result of gas being shock-heated to . This physical process would also give rise to the observed enhanced synchrotron radiation (Mazzarella et al., 1988). Davies et al. (2000) interpreted the lack of 1-0 S(1) emission from the central region of Mrk 266 as evidence for very fast shocks with relative velocities of produced at the interface of superwinds emerging from the two galaxies. Such fast shocks would generate the observed non-thermal radio continuum emission and also heat the gas to K, far above the dissociation temperature of . This would explain the lack of detected emission lines between the galaxies in the near-infrared observations of Davies et al. and in the mid-infrared IRS spectroscopy presented in the current study (§2.7). This physical scenario also predictes higher temperatures in the shocked region compared with the diffuse superwind. This is exactly what our refined analysis of the Chandra data reveals.
The estimated cooling time in this region is only 4 Myr. This is very short compared to the dynamical time scale of the merger (a few hundred million years), and therefore it is likely that we are observing this emission during a short-lived phase of the interaction. This would explain why so few interacting systems have been found with radio continuum and X-ray emission enhanced between the galaxies to the same extent as in Mrk 266. However, as shown below, there is evidence that gas in this region may be replenished from the powerful starburst-driven superwinds (§3.4), or from gravitational infall of material toward the center of mass of the system (§3.7).
| Parameter | Value | Units |
|---|---|---|
| (1) | (2) | (3) |
| 0.5-2 keV Flux | ||
| Temperature (kT) | keV | |
| Luminosityaa
The bolometric luminosity of this thermal gas, as deduced via extrapolation
from fitting the data at energies of 0.01-10 keV.
|
||
| Volume | ||
| Electron Density | ||
| Thermal Energy | ||
| Gas Mass | ||
| Cooling Time | yr |
Note. — Column (1): Physical parameter computed from analysis of the soft band (0.5-2.0 keV) Chandra emission in the region between the colliding disks of Mrk 266. Column (2): Value. Column (3): Units. The computations assume an angular-scale distance of 129 Mpc and the scale of 0.59 kpc/″ (see §1.3), and the emitting region is approximated by a tube 4″ in diameter and 13″ in length at a position angle of .
3.4. The Superwind and Northern Loop
An outstanding characteristic of Mrk 266 is the extensive filamentary nebula of ionized hydrogen 30 kpc in diameter (Armus et al., 1990) contained within an X-ray nebula 100 kpc in extent. Optical emission-line diagnostics and kinematics indicate this is one of the most energetic examples of an outflowing, starburst-driven superwind (Wang et al., 1997). Mrk 266 has the third highest luminosity in a sample of 40 local infrared-bright galaxies studied by Armus et al. (1990). Kollatschny & Kowatsch (1998) presented deep observations with ROSAT HRI that revealed luminous soft X-ray emission spatially correlated with a loop of H and [O III] 5007 line emission 14″ long by 7″ wide extending 10-34″ (6-20 kpc) to the north of the system (herein called the Northern Loop), leading these authors to interpret the X-ray emission in this region as hot post-shock gas in a high-velocity “jet” (most likely emanating from the SW nucleus). Kollatschny & Kowatsch (1998) argued also that the X-ray emission is too luminous and the opening angle of the X-ray/[O III] emitting region is too small to be explained by a superwind. A third possibility, suggested by Brassington et al. (2007), is that the northern structure is a tidal tail containing in situ star formation that is responsible for the soft X-ray emission and H emission. In the subsections below we exploit the new multiwavelength data to make the case that the Northern Loop is the most luminous component of a superwind energized by star formation and one (or both) AGNs.
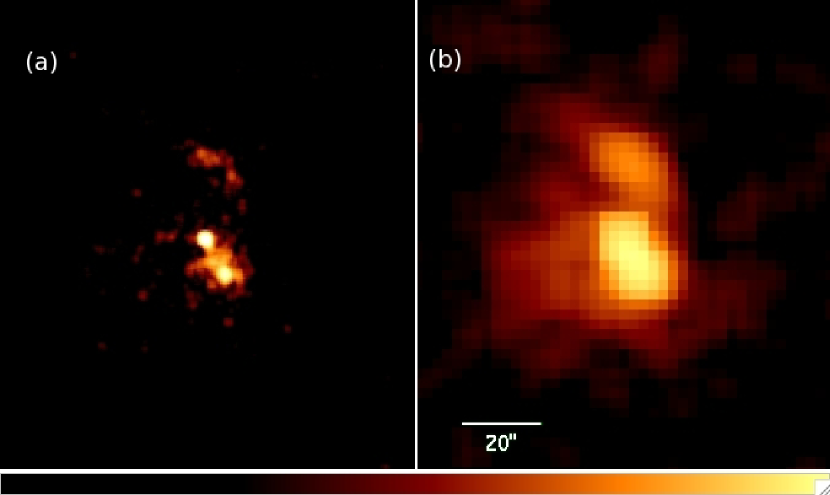
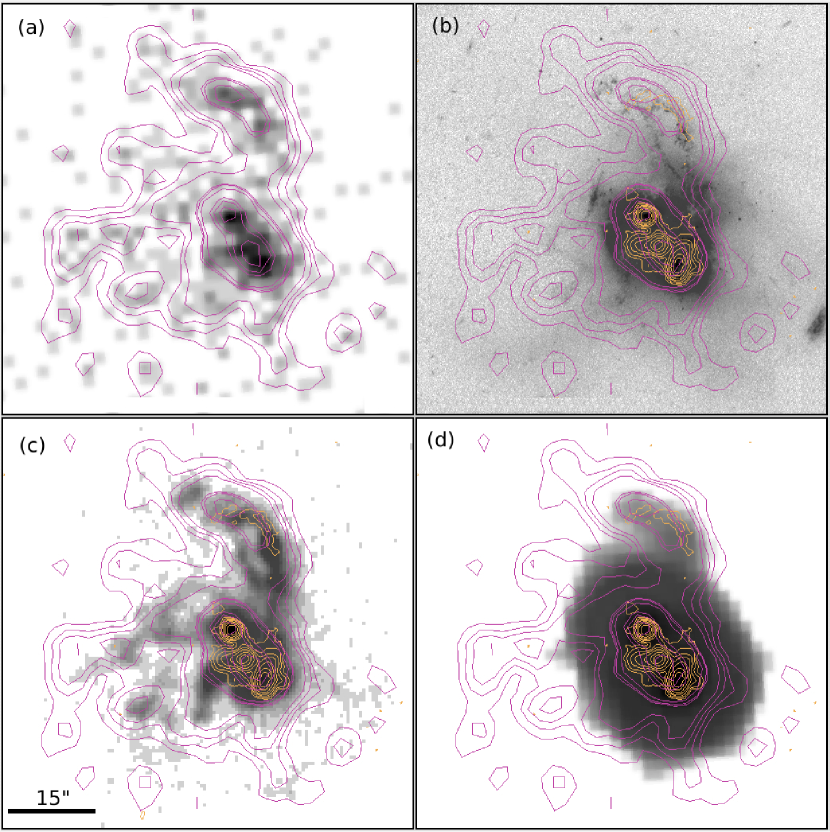
3.4.1 Spatially Correlated Soft X-rays and H Filaments
Our reprocessing of the Chandra data (Fig. 21) reveals that the X-ray emission detected in the direct high-resolution data is a high-surface-brightness ridge embedded in a longer spur that extends an additional 20″ (12 kpc) toward the NE. A map of the hardness of the soft X-ray spectrum (Fig. 18) shows the northern region has , indicating a relatively cool temperature of kT keV. If this is a region of in situ star formation, one would expect to find a high density of star clusters; however, the nearest detected optical star clusters are more than 5″ (3 kpc) SW from the brightest X-ray and radio continuum emission in the Northern Loop (§3.6). Therefore, the properties of this feature must be ascribed to something other than starlight. Figure 22 shows that the diffuse soft X-ray emission (0.4 - 1.0 keV) corresponds remarkably well with observed H filaments and knots that extend out to 18 kpc (30″) to the north and to the east of the galaxies. In the northern region, the soft X-rays have highest surface brightness near the outer edge of the Northern Loop detected in H and in the B band (including [O II] 3727 line emission), which is also co-spatial with 20 cm radio continuum emission. Close spatial correlation between hot X-ray emitting gas and warm H-emitting gas is a signature of winds in objects ranging from ULIRGs to dwarf starburst galaxies (Grimes et al., 2005).
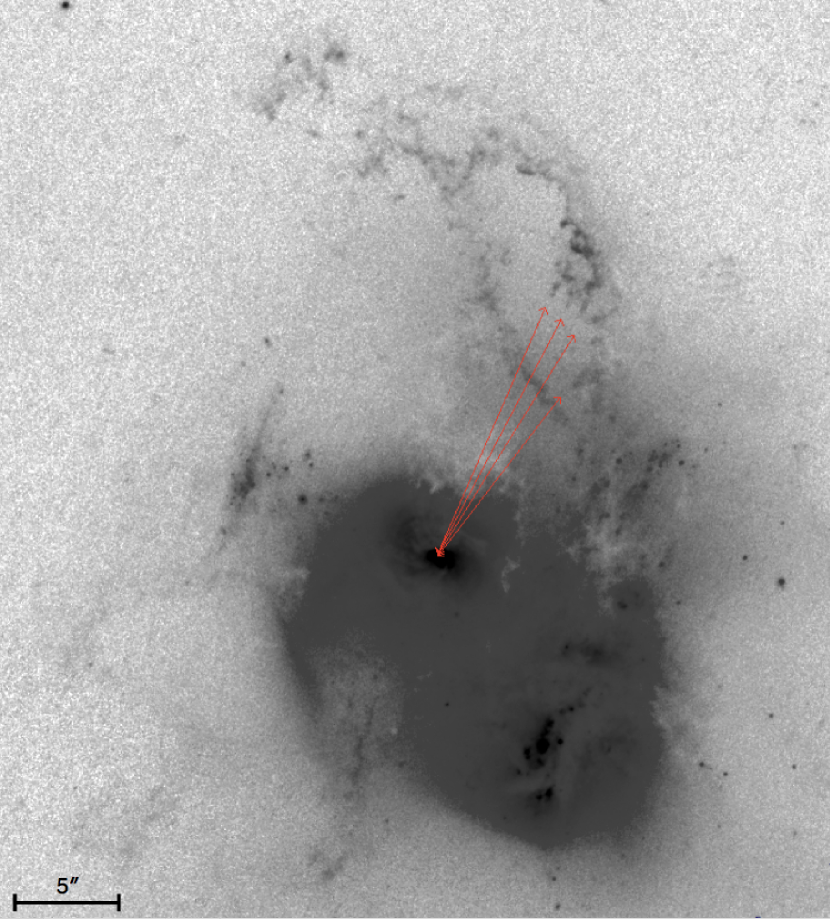
3.4.2 Structure in the Northern Loop at 100 pc Scales
The filamentary morphology of the Northern Loop revealed by the HST imagery is evidence for an expending shell or “bubble” that is fragmenting due to Rayleigh-Taylor instabilities in a starburst- or AGN-driven superwind. Three dimensional hydrodynamic simulations of galactic winds predict this phenomena (Cooper et al., 2008). Elongated structures ″ (300-600 pc) in length protruding inward from the western, outer edge of the Northern Loop are highly suggestive of Rayleigh-Taylor fingers or bow shocks predicted by simulations (e.g., Heckman et al., 1990; Cooper et al., 2008). These protrusions appear to have a radial distribution centered on the NE nucleus (Fig. 23), indicating this AGN may be a primary energizing source for this component of the superwind. Wang et al. (1997) and Ishigaki et al. (2000) have shown that filaments throughout Mrk 266, including the Northern Loop, have line ratios (e.g., ) indicating photoionization from an AGN dominates over ionization from massive stars, and shocks that could explain the LINER-like nebular spectrum have insufficient energy to account for the luminosity of the extended nebula. However, the luminous starburst in the SW galaxy is also likely to be a major contributor to the over all energetics of the superwind.
The morphological, kinematic and ionization properties of the prominent Northern Loop can be interpreted with the superwind model of Heckman et al. (1990). In this scenario, the star-burst driven gaseous outflow has inflated a “bubble” that is highly elongated along the direction of least resistance (maximum pressure gradient), and the closed loop of optical line emission indicates the superwind in Mrk 266 is in a relatively young radiative cooling phase that occurs before the wind expands further during a “blow-out” phase. This again is consistent with the idea that we are observing a relatively short lived and dynamic phenomena.
3.4.3 Dust in the Wind
The detection of 24µm emission co-spatial with the Northern Loop (Fig. 22d) is strong evidence for thermal continuum emission from dust grains entrained in the superwind. By estimating the dust temperature and grain emissivity profile, the mass of dust can be derived following the single temperature thermal model of Hildebrand (1983), which is given by
| (2) |
where is the average grain size (0.1 µm), is the density of grain material, is the grain emissivity characterized as , is the flux density of the thermal emission at frequency , is the distance, and is the Planck function. Assuming and other grain properties from Hildebrand (1983) results in at 24 µm. In more convenient units, the above equation becomes
| (3) |
where is in Jy, is in Mpc, is in K, and is in . The 24 µm flux density measured for the Northern Loop (17 mJy, or 2% of the total flux) corresponds to a dust mass . Using the calibration of Alton et al. (1999) based on the known case of M82, the total far-infrared luminosity ratio of predicts a dust mass of in the entire wind of Mrk 266. This would imply that the 24 µm emission from the Northern Loop contains at least 25% (and possibly the majority) of the total dust mass within the superwind of Mrk 266.
However, this result depends on the assumption that most of the observed flux is due to dust emission alone and that we have made a reasonable determination of . One possible source of alternate emission is the [O IV] 25.9 µm emission line. We estimate this contribution to be less than 10%131313 This estimate is based on the assumption that the mixture of ionized gas and thermal dust in the superwind of Mrk 266 may resemble a scaled up version of a planetary nebula such as NGC 2346 (Su et al., 2004). The published IRS spectrum of Mrk 266 shows a bright [O IV] 25.9 µm emission line, however it does not permit separation of emission from the SW nucleus and the diffuse emission in the Northern Loop. . Since there is no detection in any other mid-IR or sub-mm passband available to help constrain , a characteristic temperature of 37 K is assumed based on modeling of sub-mm observations of the dusty outflow in M82 (Alton et al., 1999).
The overall physical interpretation presented above adds strong support for the superwind interpretation of Wang et al. (1997) in which stellar winds and supernovae are driving a powerful outflow of gas and dust. The Northern Loop is likely the cross section of the most luminous “bubble” of expanding ionized gas in the wind. The fragmented morphology and radial orientation of protrusions in this region suggest it is strongly influenced by radiation or a gaseous outflow energized by the NE galaxy, and the detection of co-spatial 24 µm emission provides strong evidence for dust mixed with the ionized gas in the superwind. The new observations are difficult to reconcile with a jet (ejection from an AGN) as suggested by Kollatschny & Kowatsch (1998) or with a (stellar) tidal tail as hypothesized by Brassington et al. (2007).
3.5. SED Analysis
3.5.1 Decomposition of Dust Emission Components
Figure 24 presents results of a multicomponent model decomposition of the IRS spectrum (Fig. 11) combined with the broad-band SED (Table 12, Fig. 9) of global measurements for the Mrk 266 system using the CAFE software package (Marshall et al., 2007)141414 CAFE could not be used to constrain the fits for the individual galaxies because the IRS spectral map could not resolve the galaxies over the 14-38µm range of the LL module (§2.7).. A very good fit to the SED is provided by a model consisting of PAH emission, atomic and molecular line emission, plus cold (26 K), cool (72 K), warm (235 K) and hot (1500 K) thermal dust components heated by the combination of an unobscured photospheric interstellar radiation field (ISRF), an obscured starburst (SB) component with a strength constrained by the observed PAH emission, and an AGN (accretion disk) component with a strength constrained by the fitted hot dust emission. Uncertainties in the derived dust temperatures are K.
Table 8 lists the results of the fit. The derived extinction-corrected PAH flux ratios appear to be fairly “normal,” located between the curves for ionized and neutral PAHs in Figure 16 of Draine & Li (2001). The parameter is the sum of the derived intrinsic source luminosities , and is the total dust luminosity. The primary results are the relative fractions of , the fractions of , and the dust masses characterized as arising from cold, cool, warm and hot thermal dust components. As noted in Marshall et al. (2007), the four dust components used to model galaxies are typically heated to characteristic temperatures of , where the actual temperatures (noted above and in Table 8 for Mrk 266) are determined from fitting of the radiation field energy density of the corresponding radiation sources. Although the model suggests that a hot dust component accounts for 10% of the total dust luminosity, this is uncertain because the fitting of this component is weighted heavily by the mid-IR wavelength region where emission from hot dust competes with stellar photospheric emission. Reconciliation of this relatively low AGN contribution with spectral diagnostics that suggest a 50% AGN contribution in the individual galaxies (§3.2.1) may be due primarily to an aperture effect. The latter measurements were made in apertures that isolate the nuclear regions, and they are thus more sensitive to AGN signatures than the larger apertures used to construct the SED for the global system which encompass more spatially extended starburst emission.
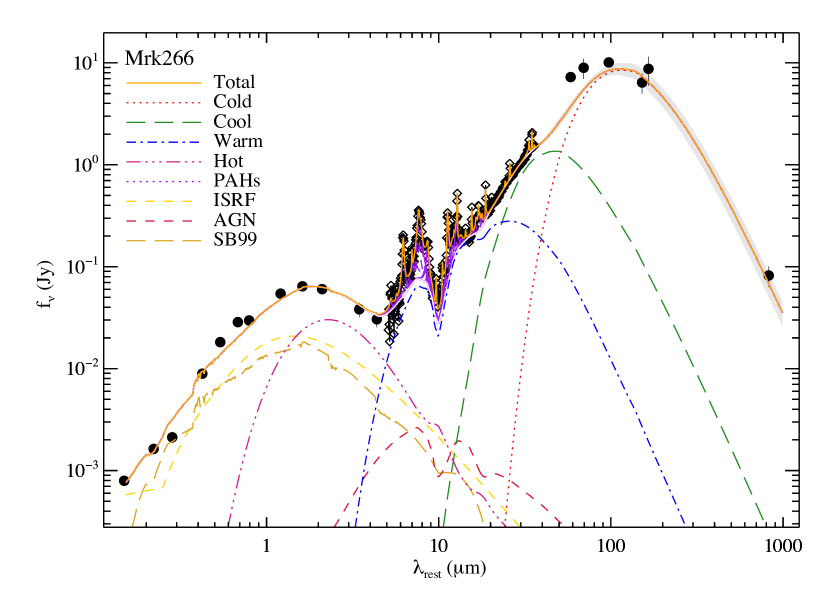
| Parameter | ISRF+SB+AGN |
|---|---|
| (1) | (2) |
| aaThese values are likely closer to the intrinsic physical attenuation than the much lower value of derived from spline fitting that estimates only the apparent strength of the silicate absorption feature §3.2.1. | |
| bb The values are corrected for the attenuation by . | |
Note. — Parameters resulting from SED decomposition using the sum of ISRF + starburst + AGN radiation sources, as described in the text and plotted in Figure 24.
It is illustrative to compare Mrk 266 with the galaxies modeled by Marshall et al. (2007). Overall, the SED of Mrk 266 can be modeled as a starburst dominated LIRG, with weak AGN indicators from the thermal dust or PAH emission, as is also the case in NGC 6240 and NGC 2623. While the cold dust component in Mrk 266 has essentially the same temperature as derived for NGC 6240 (29 K), the cool (72 K) and warm (235 K) dust components of Mrk 266 are significantly warmer than those in NGC 6240 (61 K and 193 K). Together the warm and hot components comprise 23% of the total dust luminosity of Mrk 266. For context, the sum of the (apparent) warm and hot dust fractions are 22% in NGC 6240, 77% in Mrk 463, and 82% in the QSO PG . Within the uncertainties, Mrk 266 has the same cold dust mass as NGC 6240. Compared to the other two dual-AGN systems which have had SED decomposition using this technique, the distribution in Mrk 266 is quite similar to NGC 6240, and both of these systems have much smaller fractions of warm+hot dust than Mrk 463. The Mrk 266 SED fitting results also illustrate that only 700 of dust at can generate the same luminosity ( ) as of dust at .
3.5.2 Flux Ratios
The physical nature of AGNs is often revealed via flux ratios. We begin by determining the “q” parameter as defined by Yun et al. (2001),
| (4) |
where , and the flux densities are those measured by IRAS for the global system. In addition, the parameter can be defined as
| (5) |
where is the 24 µm flux density measured by Spitzer MIPS. The data in APPENDIX Tables 12 and 13 give and for the global system, and for Mrk 266 SW (NE). Mrk 266 is typical of galaxies in the IRAS 2 Jansky Survey, 98% of which fall in the range (population mean ). A useful comparison for the values is the sample mean ( dispersion) for over 770 galaxies in the Spitzer First Look Survey with redshifts less than 0.4 (Marleau et al., 2007). The global system and Mrk 266 NE are within of this sample mean, and although for Mrk 266 SW is large compared to most LIRGs, it is within the dispersion of the FLS population. Therefore, Mrk 266 shows no significant deviations from the infrared-radio correlation followed by star-forming galaxies and radio-quiet AGNs.
The ratio of infrared to ultraviolet luminosities provides a diagnostic of the amount of reprocessed versus escaping radiation from young, massive stars. Mrk 266 has an observed ratio of , where is the sum of the NUV and FUV luminosities measured by GALEX, and it has a ratio (5%). With a correction for the finding that is powered roughly equally by the AGNs and star formation (§3.2.1), about 10% of the total star formation in Mrk 266 is observable directly as escaping UV photons, and 90% is UV radiation reprocessed into thermal infrared emission. Since the star formation rate (SFR) scales directly with the starburst component of , the system has %, which is on the high end of the distribution for the GOALS sample ranging 0.2% - 18% with mean 3% (Howell et al., 2010).
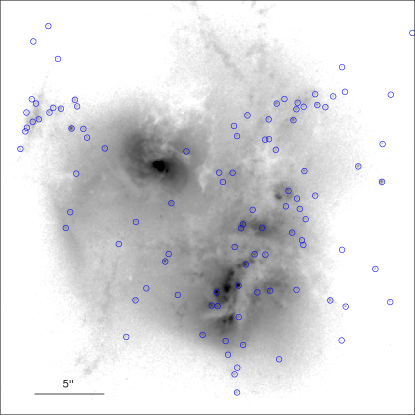
Lastly we examine the ratio of hard X-rays to infrared flux. Among 13 local ULIRGs studied by Armus et al. (2007), those with AGN-dominated mid-IR spectra have a ratio of hard X-rays to infrared luminosity , whereas starburst-dominated ULIRGs have . The XMM-Newton measurement for the global Mrk 266 system gives , and the higher resolution Chandra measurements give and for the SW and NE nuclei, respectively. The component galaxies of Mrk 266 are therefore at extreme ends of the range observed to date in the local (U)LIRG population: The value of for Mrk 266 NE is 40% larger than NGC 6240, which itself is similar to ratios found in optical/UV-selected Seyfert galaxies and quasars (Ptak et al., 2003). Mrk 266 SW, on the other hand, has one of the smallest ratios among local (U)LIRGs, similar to Arp 220 and IRAS 22491-1808 (Armus et al., 2007). This is consistent with new evidence presented in §3.2.5 that the X-ray source in Mrk 266 SW is Compton-thick. The fact that the luminosity ratio of the SW and NE galaxies in hard X-rays () is close to the reciprocal of the ratio in the infrared () and in cold molecular gas (; §3.7) is a strong clue that the factor of disparity in the ratios for these galaxies is mainly due to differences in the column density of material absorbing UV/X-ray photons and re-emitting the energy in the far-infrared, rather than an order of magnitude difference in the intrinsic hard X-ray luminosities of the AGNs.
This same conclusion about high column density material as the responsible agent for the variance of flux ratios can be arrived at by simply comparing the two nuclei. The data presented in §2.6.2 show that the luminosity ratio of the two galaxies, , is in the far-UV and soft X-ray bands, transitions through 1.0 in the near-infrared (1.2 µm), increases to a maximum of 5.7 at 8 µm, and drops to 3.5 at 70 µm (the SED peak) and 3.3 in the total infrared emission (). The ratio drops further to 2.3 at 850 µm, and to 1.4 at 20 cm. Thus, although Mrk 266 SW clearly dominates this merger in the mid-IR and far-IR, the two galaxies have similar luminosities in the near-IR, UV, soft X-rays, and radio continuum. It is only at the highest energies with available data for the separate galaxies where the situation is reversed: Mrk 266 NE is 6.4 times more luminous in the hard (2-7 keV) X-ray band than its companion Mrk 266 SW. As shown in §3.2.5, this is more likely due to a higher column density of absorbing material along our line of sight to the SW nucleus (compared to the NE nucleus) than to an intrinsic difference in their power sources.
3.6. Star Clusters
3.6.1 Cluster Detection and (B - I) Color Map
The HST/ACS images of Mrk 266 reveal numerous very compact, marginally resolved sources scattered throughout the system. Their over all properties indicate they are star clusters (SCs) and associations similar to those observed in other galaxies undergoing extensive bursts of star formation. The detection method followed the procedure described in detail by Modica et al. (2012) for SCs in the late stage LIRG merger IC 883. First, masks outlining the galaxy were applied to the images. Then Source Extractor (Bertin & Arnouts, 1996) was used to fit and subtract the underlying galaxy and perform point source detection in the B and I band images. The extracted objects were processed with IDL routines to perform photometry and apply selection criteria that accepted only reliable sources with a FWHM of 1.7-4 pixels, have S/N 5, and are detected in both bands; details are given in Modica et al. (2012). This procedure resulted in the detection of 120 point sources with and (uncorrected for extinction); their coordinates and photometric properties are listed in the Appendix (Table 15).
Figure 25 shows the direct HST B-band image (a) and the image after processing with Source Extractor to fit and subtract the local background and extract SCs (b). The density of SCs is highest in three extended regions identified with green ellipses in Figure 25b: (1) within and surrounding the disk of the SW galaxy; (2) along a band extending 5-15″ (3-9 kpc) north-west from the NE galaxy, passing near the base of the Northern Loop; and (3) in a group centered 8″ (5 kpc) north-east of the NE nucleus. There are 22 SCs within a projected radius of 5″(3 kpc) around the nucleus of Mrk 266 SW, and only 6 SCs within the same radius around Mrk 266 NE (black circles in Fig. 25b). The ratio of surface densities of detected clusters in the SW and NE galaxies (3.7) is nearly the same as the ratio of their infrared luminosities (3.5, see §3.5), and it is also similar to the ratio of their cold molecular gas masses (4.9, see §3.7). This situation is consistent with the apparent Hubble types and 1.6 µm bulge-to-disk ratios (§3.1.1) of the two galaxies (i.e., SBb disk galaxies contain more gas to fuel star formation than S0/a galaxies). Despite a nearly 4-to-1 ratio in the number of clusters detected in the central 3 kpc of the SW and NE galaxies, across the entire system there is a nearly equal number of clusters on both sides of a notable gap about 2″ (1.2 kpc) wide running between the galaxies at ° (red band in Fig. 25b).
A color map revealing the variation of (B - I) magnitudes throughout Mrk 266 is shown in Figure 26, with an overlay of symbols coded to indicate the (B - I) colors of the SCs (uncorrected for extinction). Dust lanes present in the direct images (Figs. 1, 14 and 14) are more clearly delineated in this color map as filamentary regions with (B - I) 2 mag. In the SW galaxy, the reddest dust lanes are on the east and west sides of the nucleus, and aligned with the major axis of the underlying starlight detected in the 1.6 µm image (Fig. 3); they are also aligned with the apparent rotation axis of the molecular gas (see §3.7). In the NE galaxy, the dust lane has an “S” shape that crosses the nucleus at PA. Higher than average extinction explains the lack of detected clusters in these circumnuclear dust lanes. However, in the region between the galaxies the color map shows bluer (B - I) values, suggesting the apparent dearth of clusters along this gap (red band in Fig. 25b) may be intrinsic.
Some of the bluest SCs (blue circles in Fig. 26) are located in regions identified with blue ellipses in Figure 25b, including groupings centered 7″ and 13″ north-west of the SW nucleus (inside regions 1 and 2 noted above), and a notable chain 5″ in length located north-east of the NE nucleus (inside region 3 noted above). The detected clusters are a direct probe of star formation occurring in regions with relatively low extinction. However, the fact that the total luminosity of the unobscured clusters ( mag, or ) is only 0.1% (1.6%) of the total infrared (B-band) luminosity indicates that these clusters provide a minor contribution to the total energy output of the system.
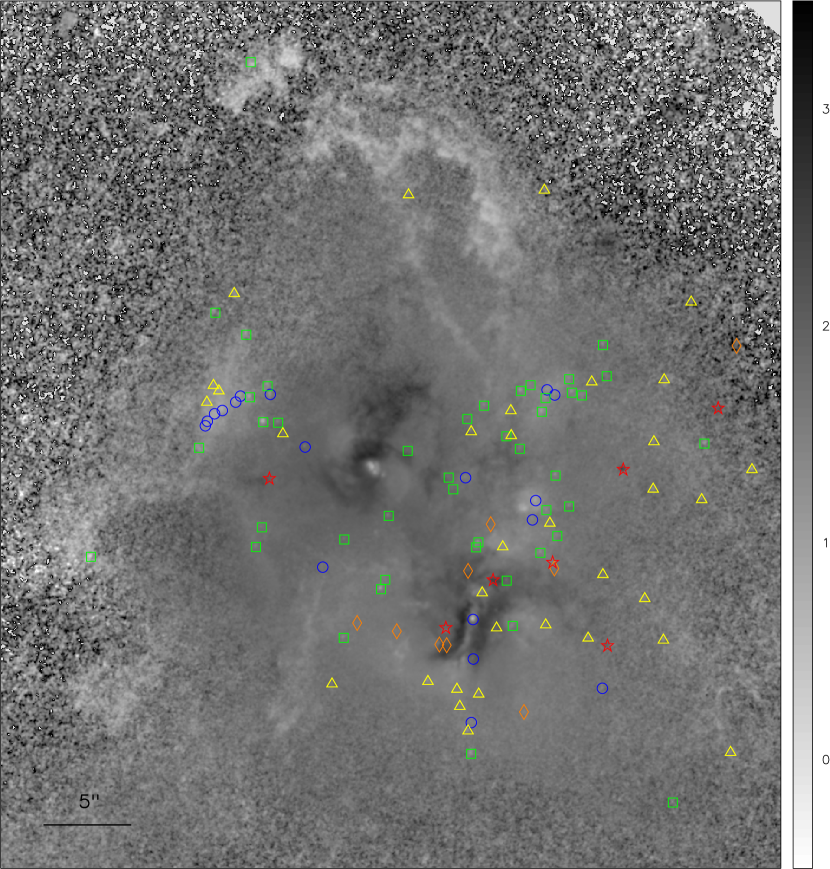
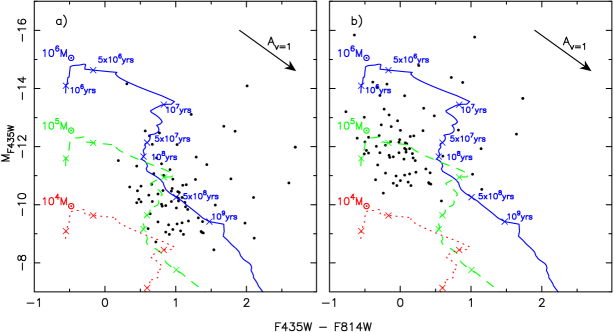
The very blue colors of the Northern Loop and filaments throughout the system are likely a signature of strong nebular [O II] and [O III] line emission in the B band (see §3.4). The NE nucleus, the arc 04 to the west, and the bi-conic structure in which they are embedded are comparably blue, with (B - I) -0.2 mag. Similarity in color with filaments throughout the system that are visible in [O III] emission-line imaging (Ishigaki et al., 2000) lends support to the hypothesis presented in §3.2.4 that the circumnuclear region of Mrk 266 NE is an AGN ionization cone.
3.6.2 Star Cluster Color-Magnitude Diagram
Figure 27 is a vs. color-magnitude diagram with evolutionary tracks constructed using population synthesis models from Bruzual & Charlot (2003). Most of the SCs have observed (apparent) colors of and (Fig. 27a). Although there is an age/mass degeneracy in the uncorrected measurements, at first glance most of the SCs appear to have ages of a few hundred Myr to 1 Gyr. However, given the orientation of the extinction vector in Figure 27, which is nearly parallel to the age tracks in the population synthesis models, it is clear that the SCs are very likely to be significantly younger and/or more massive than they appear when uncorrected for extinction and reddening due to dust. There are other indicators for high but variable dust extinction: (a) dust lanes evident in the color (B - I) map (Fig. 26); (b) the observation that 90% of the total luminosity is generated by dust emitting in the thermal infrared (§3.5); and (c) evidence for dust entrained in the superwind as far as 25″(15 kpc) from the center (§3.4.3).
Due to this high variability we can only apply a mean extinction estimate using the following indicators: (a) The emission-line Balmer decrement () measured from long-slit optical spectroscopy resulted in E(B-V) values of 0.72 mag and 0.22 mag for Mrk 266 SW and NE, respectively (Veilleux et al., 1995)151515The identifications of the NE and SW nuclei of Mrk 266 were mistakenly swapped in the tables and figures of Kim et al. (1995) and Veilleux et al. (1995).. (b) Long-slit spectroscopy along three position angles found throughout the inner 20″ (10 kpc) of Mrk 266 (Wang et al., 1997). These measurements indicate a characteristic extinction of in Mrk 266, which is similar to the sample mean of ) mag observed for a large sample of local, luminous starburst galaxies Calzetti et al. (1994). To estimate the total extinction at particular wavelengths, we assume as found in the general ISM of our Galaxy. However, this can be considered a minimum, because regions containing young star clusters in Mrk 266 (and other LIRGs) could have a significantly larger value of as measured in Galactic star-forming regions such as the Orion Nebula and giant molecular clouds (e.g., McCall, 2004).
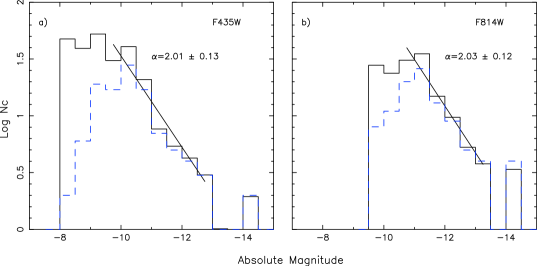
Application of a mean extinction correction of mag to the observed colors (Fig. 27a)161616The Galactic foreground extinction in the direction of Mrk 266 is only E(B-V) = 0.013 mag (Schlegel et al., 1998); with caveats documented in NED, this corresponds to mag. shifts the points to an intrinsic mean color of (B - I) 0.0 mag and to a mean luminosity of -12 mag (Fig. 27b). Comparison of the mean extinction-corrected data to the model curves (Fig. 27b) leads to the following results for the detected cluster population on average: (a) most of the SCs have ages between 1 and 50 Myr; (b) although the current data cannot remove the age/mass degeneracy for the reddest clusters (B - I 0.5 mag), about half of the objects are very blue (B - I 0.2 mag), very young (1 - 5 Myr), and are consistent with masses of ; (c) the 11 most luminous SCs have mag and are located near the (blue) track for clusters with ages of only 1-10 Myr; (d) the two very luminous objects with -15.8 mag are located 075 E (the red cluster with B - I 1.1) and 091 W (the blue cluster with B - I -0.6) of the SW nucleus, respectively (see Fig. 26); and finally (e) if a mean extinction of mag () is more applicable than mag in regions containing the blue SCs, as argued above, than most of the SCs are on average only 1 Myr old and have masses spanning to . These results indicate the detected SCs are massive and likely relatively young. However, they represent only the “tip of the iceberg” in terms of the extensive starburst which is mostly obscured by dust in optical and UV observations.
3.6.3 Star Cluster Luminosity Functions
Figure 28 is a plot of the luminosity function (LF) derived for the SCs detected in the B and I band images. The index () of a power law fit to the LF, after correction of the cluster counts for foreground contamination and completeness using techniques described in Modica et al. (2012) and Vavilkin et al. (2012, in preparation), is in both the B and I bands.
It is revealing to compare the power-law slope of the star cluster luminosity function (LF) in Mrk 266 with the star cluster LFs observed in other merger systems. In the well-studied Antennae Galaxy, the cluster LF has (Whitmore et al., 2010). In the early-stage merging LIRG system II Zw 96, was found (Inami et al., 2010). For clusters in two well-known ULIRGs that appear to be in intermediate and late stages of the merger process, the following slopes were measured by Surace et al. (1998): for Mrk 463, and for Mrk 231. For SCs in the late-stage (single nucleus) merger system IC 883, Modica et al. (2012) derived LF indices ( and ) that are remarkably similar to the values found in Mrk 266. In another late-stage LIRG merger remnant, NGC 34 (Mrk 938), the star cluster LF has (Schweizer & Seitzer, 2007). (Both IC 883 and NGC 34 are in the GOALS sample, with and , respectively.) It is also noteworthy that the LF slopes in Mrk 266 and these other (U)LIRGs are similar to the LFs of young star clusters in the irregular galaxies SMC and LMC, which have mean (Gieles et al., 2006). The specific frequency of young star clusters is defined as , where is the number of clusters above the specified luminosity limit normalized by the B-band luminosity of the host galaxy (e.g., Larsen & Richtler, 1999). Correcting for completeness in the cluster detection, Mrk 266 has , which is similar to completeness-corrected values observed in the cluster-rich LIRG sample of Vavilkin et al. (2012, in preparation). We conclude that and for star clusters in Mrk 266 are similar to other LIRGs.
Various disruption mechanisms have been described in the literature to model the luminosity, mass and age distributions of star clusters in interacting galaxies (e.g., Whitmore et al., 2007). Given that Mrk 266 has one of the most powerful superwinds known in the local universe (§3.4), this raises the question of whether star clusters are being disrupted by this outflow/feedback process to a larger degree than in systems such as the Antennae with much less powerful superwinds and lower star formation rates. The dearth of detected SCs in the interaction zone of Mrk 266 noted above, despite relatively low extinction and molecular gas spanning part of this region (§3.7), and despite the presence of SCs in other regions at equally large distances from the galaxy centers, may be a sign of cluster disruption or suppression of star formation in this narrow band between the two galaxies. A possible explanation would be fast shocks and extensive turbulence at the interface of the colliding galaxies or colliding superwinds expanding from the two galaxies, as discussed in §3.3. However, there is no signature of cluster disruption on a global scale in Mrk 266, as might be revealed through an or value that is significantly different than the SC populations observed in (U)LIRGs with less powerful superwinds.
3.7. Molecular Gas Properties
3.7.1 The Integrated Emission from CO, NCH, and HCO+
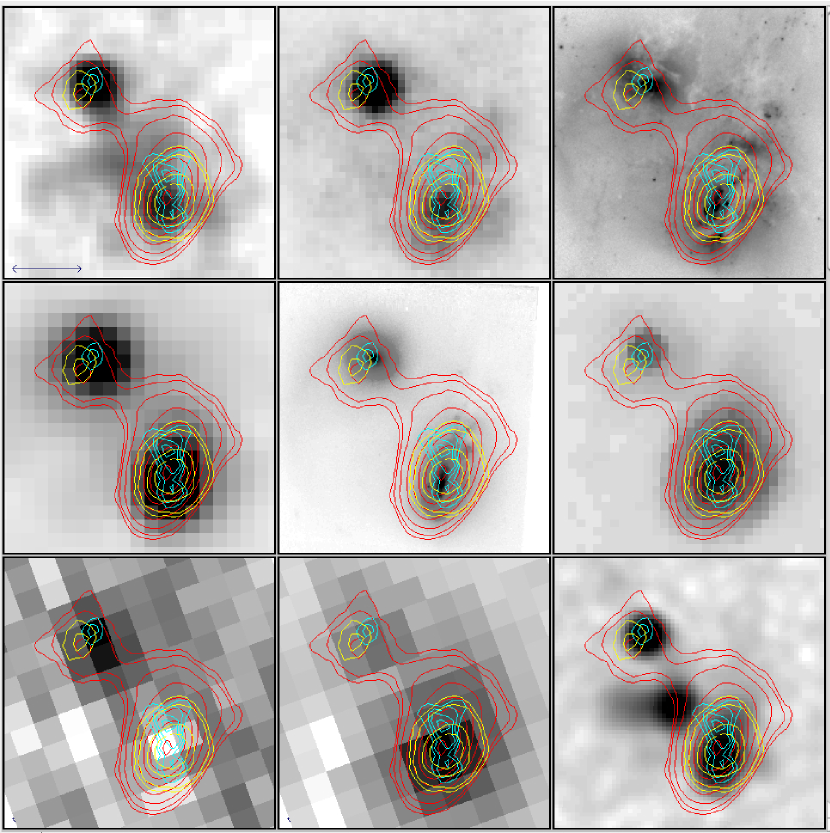
Interferometric observations of Mrk 266 in HCN(1-0), HCO+(1-0) and CO(1-0) with the Nobeyama Millimeter Array were presented by Imanishi et al. (2009). In this section these data are used to explore the distribution of molecular gas with respect to various features in the system, and to derive the physical conditions of the cold molecular gas. Figure 29 presents contours of the integrated emission from these three molecular transitions overlaid on images ranging from X-rays through radio continuum. There are intriguing differences between the spatial distributions of these molecular species. Although the SW galaxy contains about 5 times more flux in CO (1-0) than its companion, the NE galaxy is clearly detected in all three molecular transitions. The bulk of the integrated CO (1-0) emission in the system is aligned with the major axis of the SW galaxy, with a centroid near the X-ray/infrared nucleus. CO (1-0) is also detected in a bridge connecting the two galaxies, which is discussed further below (§3.7.2). The HCN gas in the SW galaxy shows double structure with peaks located 1.2 kpc (2″) to the NE and SW of the region where the CO (1-0) and HCO+(1-0) are most heavily concentrated at the location of the X-ray/IR/radio nucleus. If this morphology is due to limb-brightening in a rotating disk, the HCN disk is tilted 10° with respect to the axis of the CO (1-0) and 1.6 µm emission (Fig. 29e). Most of the CO emission in the NE galaxy is offset by 1 kpc (15) to the SE of the X-ray/optical nucleus. The CO (1-0) in this region is spatially coincident with the peak of the HCO+ (1-0), whereas the dense gas traced by HCN is concentrated very close to the nucleus about 1 kpc to the NW. Figure 29c shows that the centroid of the HCN emission is aligned within 02 of the eastern point source in the HST B-band image, which we interpret to be the AGN of Mrk 266 NE (§3.2.4).
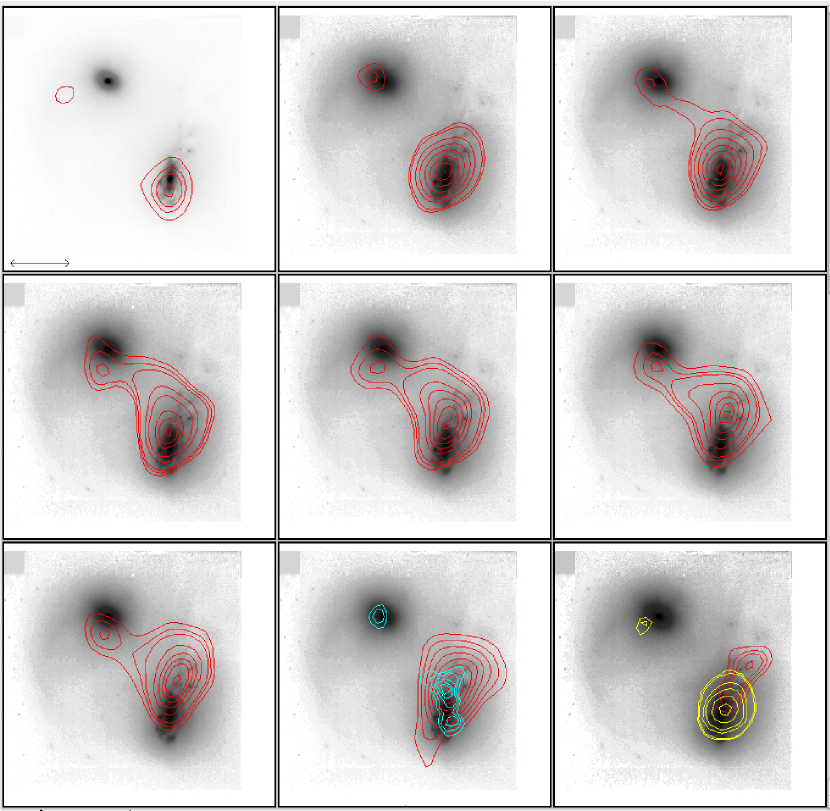
Applying the formulation of Evans et al. (2005) to compute , and assuming a CO luminosity to gas mass conversion factor suggested by observations of ULIRGs (Downes & Solomon, 1998), results in estimates of the warm molecular gas mass for the two galaxies: and for Mrk 266 SW and NE, respectively. The sum of these components corresponds to a total mass of . However, the maps also include an extended component, and the integrated CO(1-0) line flux of the total system is 180 (Imanishi et al., 2009). The corresponding total molecular hydrogen gas mass of Mrk 266 from the Nobeyama observations is thus . Within the uncertainties, this is consistent with 206 measured with single-dish observations (Sanders et al., 1986) and a corresponding estimate of when adjusted to . If the CO to conversion factor appropriate for Mrk 266 is similar to GMCs in our Milky Way (, Radford et al., 1991), the actual gas masses may be 4 times larger than the estimates computed here. (Sanders et al. (1986) derived assuming .) Assuming a weighted mean dust temperature of 50 K in the CO-emitting regions based on SED fitting (§3.5.1) and using the observed CO (1-0) line widths, applying the formulation of Evans et al. (2005) enables estimation of the radius of the unresolved CO-emitting regions, the dynamical masses of the galaxies, as well as the column densities. These results are presented in Table 9.
| Parameter | SW | NE | Total |
|---|---|---|---|
| (1) | (2) | (3) | (4) |
| CO (1-0) flux aa
The CO (1-0) line fluxes and line widths are from Imanishi et al. (2009);
all other parameters are derived here for the first time.
|
88 | 18 | 180 |
| CO (1-0) FWHM aa
The CO (1-0) line fluxes and line widths are from Imanishi et al. (2009);
all other parameters are derived here for the first time.
|
500 | 250 | |
| [] | |||
| [pc] | 208 | 134 | |
| [] | |||
| 0.28 | 0.37 | ||
Note. — Column (1): Observed or derived parameter. Columns (2)-(4): For the SW galaxy, NE galaxy, and the total system, respectively— the value of the parameter in Column (1).
3.7.2 Spatial Distribution and Kinematics of CO (1-0)
Figure 30 shows the spatial distribution of CO (1-0) in velocity channels ranging from to , in judiciously chosen steps varying from 30 to 250 , produced from the FITS channel map provided by Imanishi et al. (2009). The CO (1-0) contours are superposed on the HST NICMOS 1.6 µm image for comparison with the highest resolution tracer available for the (old) stellar mass in the galaxies, and to minimize confusion from dust obscuration and young star-forming regions that dominate the imagery at shorter wavelengths.
The CO (1-0) emission in Mrk 266 SW shows a strong velocity gradient ranging from on the SE side to on the NW side of the disk. At progressively higher velocities, the centroid of the CO (1-0) emission is located at larger radii, extending as far as 5″ (3 kpc) NW from the SW nucleus. The molecular gas in this off-nuclear region has a radial velocity greater than the SW nucleus, and this gas coincides spatially with the most luminous region of off-nuclear star formation that is prominent in optical and UV images (see Fig. 8). Although the density of SCs is not significantly higher than in the surrounding areas, this region contains many of the most luminous SCs (Fig. 25).
The low ratio in Mrk 266 NE is consistent with its apparent near-IR Hubble type of S0/a (pec), suggesting that its pre-merger gas content was relatively low and incapable of sustaining a high SFR. Figure 30 shows that a large quantity of molecular gas detected over the velocity range is bridging between the galaxies. The highest concentration of CO on the NE side of the bridge is centered 1 kpc (15) to the SE of the nucleus of Mrk 266 NE. As shown in Figure 29i, the CO (1-0) in this off-nuclear region coincides with the peak of the HCO+ (1-0) emission, whereas the HCN (1-0) emission is concentrated at the NE nucleus. This result is consistent with research that has called into question the use of HCN as a tracer of dense gas fueling star formation, suggesting that in some cases HCN is energized by an X-ray Dissociation Region (XDR) associated with an AGN (e.g., Graciá-Carpio et al., 2008).
The distribution of CO (1-0) in Mrk 266 suggests the system is currently in a short-lived phase in which 40% of the cold molecular gas is falling toward the center of mass of the system, or transferring between the galaxies along a tidal bridge as predicted by merger simulations (e.g., Cox et al., 2006). Mrk 266 appears to be in a similar evolutionary stage as three other LIRGs in the GOALS sample that have a large fraction of their total CO emission located between the nuclei: VV 114 (Yun et al., 1994), NGC 6090 (Bryant & Scoville, 1999), and NGC 6240 (Engel et al., 2010). However, unlike VV 114 where the 1.4 GHz radio continuum emission has a similar spatial distribution as the CO, the enhanced radio continuum emission between the nuclei of Mrk 266 peaks 2″(1.2 kpc) south of the CO bridge (Fig. 29i). Another difference is that whereas the bulk of the HCO+ in VV 114 is located between the nuclei (Imanishi et al., 2007), in Mrk 266 the HCO+ is still bound to the galaxies.
3.8. Wider Implications
The proceeding sections have shown that Mrk 266 exhibits the simultaneous occurrence of a variety of phenomena including dual AGNs, an outflow containing a likely radiative bow shock in the narrow-line region of the NE nucleus, a starburst with a population of young star clusters, a galactic scale “blow-out” expelling dust in a superwind, shocked gas between the galaxies, and molecular gas falling toward the center of mass or transferring between the galaxies. In this closing section, Mrk 266 is compared with other local major mergers and (U)LIRGs, and we attempt to place the system into a tentative sequence with a small number of other confirmed dual AGNs (with kpc scale nuclear separations) that may represent stages in the formation of binary AGNs (accreting SMBHs with pc-scale orbital separations).
3.8.1 Emission Between Interacting Galaxies
Interacting systems exhibiting substantial radio continuum, X-ray, or molecular gas emission between the galaxies are rare, but a few have been studied in detail. By comparing these systems with Mrk 266 we may be able to gain further insight into this phenomenon.
The Taffy Galaxy (VV 254): This interacting pair has 50% of its total 1.5 GHz flux emerging between the companions, which has been interpreted as synchrotron radiation from cosmic ray electrons trapped in magnetic field lines and stretched like taffy as the galaxies pass through each other (Condon et al., 1993). Imaging in 450 and 850 µm continuum emission and in multiple transitions of CO indicate the bridge between the galaxies consists of interstellar dust and gas extruded from the galaxy disks via direct cloud-cloud collisions (Zhu et al., 2007). Mid-infrared observations have detected substantial PAH emission in the bridge (Jarrett et al., 1999).
The regions between the components of Taffy and Mrk 266 both contain large fractions of their total radio continuum and CO emission, yet they contain little or no evidence for luminous star formation. However, unlike Taffy, there is no detected infrared enhancement between the galaxies of Mrk 266. In addition, while the radio continuum and CO emission are roughly spatially aligned and uniformly distributed between the Taffy galaxies, in Mrk 266 the central radio emission is much more centrally concentrated and the bridge of CO (1-0) emission is spatially decoupled from the radio continuum and X-ray emission. The absence of a discrete mid-IR or far-IR source between the galaxies of Mrk 266 suggests shocks may have destroyed most of the dust grains in this region. The collision in the Taffy system was estimated to occur yr prior to its current configuration (Condon et al., 1993). Its global star formation rate is not significantly higher than in non-interacting spiral galaxies (Zhu et al., 2007), and no evidence for an AGN has been published for either galaxy.
The Antennae (NGC 4038/4039): This galaxy pair is well known for having 30% of its total bolometric luminosity, 40% of its total CO (1-0) flux (Zhu et al., 2003), and a high concentration of young star clusters (Whitmore et al., 1999) located in an off-nuclear region between the colliding disks. We have shown that in Mrk 266 the molecular gas bridging the galaxies is decoupled from the central radio/X-ray source, and there is no evidence for star formation between the galaxies. Compared to Mrk 266, the Antennae exhibit: (a) 5 times lower luminosity in the far-infrared and in CO (1-0); (b) a cooler effective dust temperature; (c) a large region of diffuse X-rays, but a weaker superwind; (d) a pair of long tidal tails rather than diffuse, asymmetric tidal debris; and (e) low-luminosity LINER and starburst (H II) nuclei.
Early simulations suggested we are viewing the Antennae galaxies soon after their first encounter (e.g., Dubinski et al., 1996), but a recent model that accounts for the starburst in the overlap region constrains the system to 40 Myr after the second encounter and only 50 Myr before the galaxy centers fully merge (Karl et al., 2010). The close projected separation and small relative velocity of the nuclei imply Mrk 266 is in a similar stage of the merger process as the Antennae. The lack of well defined tidal tails in Mrk 266 may be due to any number of conditions, including a relatively small disk mass in the NE galaxy (§3.1.1); a retrograde encounter or an orbital geometry (e.g., a smaller perigalactic distance) that produces more diffuse tidal debris (Dubinski et al., 1996); or a large ratio of dark matter halo mass to visible (bulge plus disk) mass that can cause tails produced early in the encounter to fall back onto the galaxies quickly, resulting in late-stage tidal debris resembling loops and shells (Mihos et al., 1998). It is noteworthy that the extent of the diffuse optical emission in Mrk 266 ( kpc) is similar to the end-to-end length of the tails in the Antennae. A detailed simulation of kinematic data for Mrk 266 is needed to constrain its true dynamical age.
NGC 6240: Mrk 266 appears to be in a similar evolutionary stage as the well-known system NGC 6240, in which X-ray observations by Chandra have also revealed dual AGNs (Komossa et al., 2003) and a large fraction of the molecular gas is located between the nuclei (Tacconi et al., 1999). Although the total infrared luminosity is about half that of NGC 6240, Mrk 266 has a much warmer dust temperature () compared with NGC 6240 (). Likewise, decomposition of the infrared SEDs indicates warm (cool) dust components of 225 K (73 K) in Mrk 266 compared to 193 K (61 K) in NGC 6240 (§3.5.1). The 0.4-10 keV X-ray luminosity of Mrk 266, , is 57% that of NGC 6240, and within the uncertainties of the X-ray flux absorption corrections their intrinsic ratios are similar (). The projected separation of the nuclei in NGC 6240 is 1 kpc (18).
Stephan’s Quintet: This is a well studied compact group containing a large intergalactic shock region with substantial radio continuum, X-rays, infrared and molecular gas emission. Unlike Mrk 266, the main shock region of Stephan’s Quintet exhibits broad () rotational lines of warm with an order of magnitude higher surface brightness than the soft X-ray emission (Appleton et al., 2006). This dichotomy may be explained by a difference in the shock conditions in the two systems. Detailed modeling suggests the shock velocity in Stephan’s Quintet is (Cluver et al., 2010). As noted by Davies et al. (2000), if the intergalactic shock front in Mrk 266 is produced by the collision of superwinds expanding outward from the two galaxies at , adding this to the collisional velocity of the two galaxies can produce a net shock velocity approaching . This would heat the gas far above the dissociation temperature of (Lim, 2003), which is consistent with a temperature of K deduced from modeling of the soft X-ray data (§3.3.2). Another difference between these systems is that although 40% of the CO (1-0) in Mrk 266 is located in a bridge between the galaxies where little or no star formation is taking place, in Stephan’s Quintet CO (1-0) is detected in regions where star formation is occurring as traced by 24 µm dust emission and UV continuum emission from young, massive stars (Cluver et al., 2010).
In summary, the radio continuum and X-ray emission between the galaxies in Mrk 266 is more similar to the large-scale shock detected in Stephan’s Quintet than the off-nuclear star formation observed in the Antennae. The lack of bright line emission and infrared emission from dust grains in the central region of Mrk 266 may be due to the presence of a very fast shock that effectively destroys most of the dust grains, sublimates the molecular gas, and inhibits star formation. The ridge of K gas between the galaxies of Mrk 266, which is nearly times hotter than in other regions of the diffuse X-ray nebula and has a correspondingly short cooling time, is consistent with this scenario. Since the region with enhanced soft X-rays and radio continuum emission between the galaxies is not well aligned with the molecular gas bridge (Fig. 29) and the physical processes generating these features are likely quite different (shocks generated via superwinds and gas transfer via gravitation tidal forces), we suspect that these two short-lived phases are not directly linked. However, their simultaneous appearance is not a mere coincidence, as both phenomena are causally related to the ongoing galaxy merger.
3.8.2 Will Mrk 266 become a ULIRG?
It is well established that most local LIRGs and effectively all ULIRGs involve interacting and merging gas-rich spiral galaxies (e.g., Sanders & Mirabel, 1996), and the ULIRG phenomenon occurs predominantly in late-stage mergers when dust is heated to high temperatures by being transported by gravitational torques (with the rest of the ISM) close to the central power sources (e.g., Mazzarella et al., 1991b; Mihos & Bothun, 1998). Clearly ULIRGs must pass through a LIRG phase as the star formation rate and/or AGN fueling rate increases the dust heating to produce a luminosity of . At least two lines of evidence – one based upon merger simulations and one based on molecular gas properties – suggest that Mrk 266 will transform into a ULIRG.
Numerical simulations show the timescale for major mergers (from initial approach through final coalescence of the nuclei) averages Gyr, but spans Gyr, depending on the circularity of the orbit, the virial radius and circular velocity (e.g., Jiang et al., 2008). Comparison of the observed properties of Mrk 266 with hydrodynamical simulations (Barnes & Hernquist, 1996; Mihos & Hernquist, 1996; Hopkins et al., 2006; Cox et al., 2006) suggests we are viewing this system about 50% to 70% of the way through the merger process. The presence of an asymmetric halo of low surface-brightness optical emission spanning over 100 kpc, a relatively small projected nuclear separation of 6 kpc, and a low relative velocity of the nuclei of (Khachikian et al., 2006) indicate the two galaxies are likely undergoing their second or third encounter, with each passage damping the relative velocities of the nuclei, strong dynamical friction causing the orbit to decay, and tidal torques driving strong inflows of gas. As pointed out by Mihos (1999), the timescale for violent relaxation is Gyr in the outer regions (low ), but only 100 My in the inner regions (high ). Thus, depending on whether the nuclei are on the verge of free-fall (which can occur as rapidly as of a rotation period) or whether they will orbit one more time before fully merging, the estimated time to coalescence is about 50 to 250 Myr. (We are referring here to the merger of the stellar systems, not the SMBHs. The latter is discussed in §3.8.3.) Based on Monte Carlo simulations of merger models to match the observed distribution of nuclear separations in ULIRGs (Murphy et al., 1996), Mihos (1999) concluded that most ULIRGs are in the final 20% of the merger process. Thus, Mrk 266 appears to be in an interesting evolutionary stage when the nuclei are about to enter the final phase of coalescence characteristic of ULIRGs.
The total cold molecular gas mass of Mrk 266 is similar to that of ULIRGs observed locally and at high redshifts (e.g., Solomon & Vanden Bout, 2005). Given that 40% of the total CO (1-0) emission is in a bridge between the galaxies, there is a large reservoir of cold molecular gas available to form more stars or to fuel the AGNs as the galaxies and nuclei fully coalesce. With and , Mrk 266 falls directly on the well known correlation between (Solomon & Vanden Bout, 2005). Within the evolutionary scenario of Sanders et al. (1988a, b), we expect Mrk 266 will evolve into a ULIRG initially with a relatively “cool” global far-infrared dust temperature similar to Arp 220, followed by a “warm” ULIRG phase exemplified by Mrk 463 (Mazzarella et al., 1991a; Bianchi et al., 2008). Given the new evidence for dust entrainment in the extensive superwind of Mrk 266 (§3.4.3), this system illustrates that the “blow-out phase” when large quantities of dust are expelled to reveal previously obscured optical/UV AGNs can begin during an intermediate stage of the merger before the nuclear coalescence phase when ULIRGs are most likely to occur.
ULIRGs have a much lower space density than LIRGs locally and at intermediate redshifts (Le Floc’h et al., 2005). In addition, the mean luminosity of ULIRGs in the local universe is lower than ULIRGs and sub-millimeter galaxies at high redshifts (e.g., Solomon & Vanden Bout, 2005). The resolution of these observations may well lie in the pre-merger gas content of the participant galaxies. The higher that gas content, the larger the burst of star formation and subsequent dust heating. In the case of Mrk 266, the NE component contains times less molecular gas than its companion; this is consistent with its apparent morphological type (S0/a) and correspondingly high bulge-to-disk ratio found at 1.6 µm. Using the well-established correlation of with (Young et al., 1986), a merging pair involving two late-type spirals with molecular gas masses similar to Mrk 266 SW (SBb) would have a few times higher than is observed in the actual Mrk 266 (SBb + S0/a) pair, resulting in a total at the high end of the local ULIRG distribution (Solomon & Vanden Bout, 2005).
In the hierarchical model, a galaxy’s Hubble type is a byproduct of its merger history (e.g., Schweizer, 2000). In this scenario, although merging played an important role in galaxy evolution over all cosmic time, high-z galaxies and proto-galaxies were very different than those observed at intermediate and low redhifts, and prior to the Hubble sequence was not yet in place. However, from to the present, because many late-type spiral galaxies merged and transformed into early-type spirals, S0, or elliptical galaxies, the fraction of late-type spirals has decreased substantially (e.g., Oesch et al., 2010). Locally at , this makes pairings of gas-rich, late-type galaxies less likely than pairings of one late-type with one early-type galaxy (or of two early-type galaxies). Therefore, at low redshifts a smaller fraction of major mergers will have sufficient gas to fuel star formation or AGN accretion at the level required to reach the ULIRG threshold during early to intermediate phases of the merger. As argued above, however, this would not prevent a ULIRG from developing later if one of the companions has of molecular gas available to be driven toward the center of mass of the system to fuel two massive AGNs as they inspiral toward final coalescence. Mrk 266 is apparently in this physical situation.
3.8.3 Evolution from Dual to Binary AGNs
In this final section we turn attention to the significance of Mrk 266 in context with other confirmed dual AGN systems in an attempt to understand the low detection rate of binary AGNs with sub-parsec scale orbits found in recent surveys. We also propose a putative evolutionary sequence involving a quantitative parameter available for a small number of major merger systems with confirmed dual AGNs and candidate binary AGNs.
Current theory predicts the following evolutionary sequence (e.g., Colpi & Dotti, 2009, and references therein): (a) pairs of massive galaxies separated by many times the diameter of their luminous disks and bulges will merge in 1 Gyr (a few dynamical time-scales) due to dynamical friction between their massive dark matter halos; (b) the two pre-existing SMBHs in their cores (with %) will form dual AGNs as tidal torques drive the ISM inward to fuel accretion at a higher rate than existed prior to the encounter; during this stage the nuclei are merging from a separation of kpc to 10 pc; (c) in many cases conditions may be conducive to forcing the black holes pairs to inspiral over a period of Myr to a separation of pc, at which point they enter Keplerian orbits and may be detectable as binary AGNs; (e) the SMBHs will eventually either completely coalesce or else recoil, resulting in the most powerful sources of gravitational waves predicted to exist. Considering the relatively small number of dual AGNs confirmed to date, it is tempting to conclude that it is rare for both SMBHs to have accretion rates high enough to power two luminous AGNs simultaneously. However, given that the column density of gas and dust in (U)LIRGs is high enough to make the central pc optically thick in the mid-infrared, and even in the far-infrared in many cases (e.g., Thompson et al., 2005), many more dual AGNs will likely be detected with observations in other spectral regions. Indeed, X-ray surveys suggest 60% of optically classified LINERs are true AGNs (Gonzalez-Martin et al., 2006), and high resolution radio continuum imaging finds a high fraction (74%) of AGNs among optically classified LINERs in the 1 Jy ULIRG sample (Nagar et al., 2003).
Along with Mrk 266 and NGC 6240, the following local (U)LIRGs have also been confirmed to contain dual AGNs based on detection of two compact, luminous sources of hard X-rays: Mrk 171 (Arp 299 = NGC 3690 + IC 694) (Ballo et al., 2004) and Mrk 463 (Bianchi et al., 2008). Mrk 171 is similar to NGC 6240 in terms of infrared luminosity ( ), and projected nuclear separation (0.9 kpc, 38). However, with (uncorrected for absorption), Mrk 171 has , which is an order of magnitude smaller than Mrk 266 and NGC 6240. With , Mrk 463 has a hard X-ray luminosity 9 times greater than Mrk 266 and 16 times greater than Mrk 171. Mrk 463 has , which is 2-5 times larger than NGC 6240 and Mrk 266, and 23 times larger than Mrk 171. A remarkable dual AGN is 3C 75, in which both nuclei are emitting powerful double-sided radio jets (Owen et al., 1985); this system consists of a pair of elliptical galaxies with projected separation 6.4 kpc (14″).
There is growing evidence that the current small number of confirmed dual AGNs will increase, primarily with observations of hard X-rays. For example, in a local sample of hard X-ray selected AGNs, 10% have been found to reside in dual systems with separations kpc (Koss et al., 2012).171717However, it should be noted that many pairs with such wide separations may not be gravitationally bound, and a hard X-ray selected sample is naturally biased toward a much higher AGN fraction than an infrared-selected sample. The number of confirmed dual AGNs is currently less than 3% of the GOALS sample. Dual AGNs and binary AGN candidates are also being found in surveys probing to higher redshifts. The system COSMOS J100043.15+020637.2 has been confirmed to contain two luminous AGNs with a separation of 2.5 kpc (05) (Comerford et al., 2009). In CXOC J100043.1+020637, Civano et al. (2010) have interpreted the presence of optical morphology indicating a major merger, a large velocity offset, and an X-ray iron line with an inverted P-Cygni profile as a recoiling SMBH or a slingshot effect in a triple system. The published SED indicates , which is orders of magnitude larger than in the local (U)LIRGs. Four more dual AGNs with kpc-scale separations and have also been discovered recently in the SDSS (Liu et al., 2010).
| Object | z | Sep | Sep | Notes | Refs | |||
|---|---|---|---|---|---|---|---|---|
| (Mpc) | (″) | (kpc) | (km/s) | |||||
| (1) | (2) | (3) | (4) | (5) | (6) | (7) | (8) | (9) |
| Mrk 171 (NGC 3690 + IC 694) | 0.01041 | 51.1 | 3.8 | 0.9 | 11.88 | -4.1 | 1 | |
| Mrk 266 (NGC 5256) | 0.02786 | 129 | 10 | 6.0 | 11.53 | -3.5 | 2 | |
| NGC 6240 | 0.02448 | 116 | 1.8 | 0.9 | 11.93 | -3.1 | 3 | |
| Mrk 463 | 0.05036 | 233 | 3.8 | 3.8 | 11.77 | -2.8 | Young radio jet? | 4 |
| 3C 75 | 0.02315 | 97.9 | 14 | 6.4 | Twin radio jets | 5 | ||
| COSMOS J100043.15+020637.2 | 0.36060 | 1944 | 0.5 | 2.5 | 11.59 | -1.7 | Recoiling SMBH? | 6 |
| 4C +37.11 | 0.05500 | 242 | 0.0073 | 0.008 | Binary AGN | 7 | ||
| SDSS J153636.22+044127.0 | 0.38930 | 2133 | 1.0? | or 5.1 | Binary or dual AGN? | 8,9 |
Note. — Basic parameters for confirmed dual AGNs and putative binary AGNs. Column (1): Object name. Column (2): Heliocentric redshift from NED (see citations therein). Column (3): Luminosity distance computed by NED. Column (4): Projected nuclear separation in arcseconds. Column (5): Projected separation in kpc. Column (6): Log of the infrared luminosity in Solar units. Column (7): Log of the ratio of observed hard X-ray luminosity (2-10 keV from XMM, otherwise 2-7 keV from Chandra, uncorrected for absorption) to infrared luminosity. Column (8): Notes. Column (9): References for the redshift in column (2), the hard X-ray flux used to compute the ratio in column (7), or the Notes in column (8); the codes are as follows: 1 = Ballo et al. (2004); 2 = this article; 3 = Komossa et al. (2003); 4 = Bianchi et al. (2008); 5 = Owen et al. (1985); 6 = Civano et al. (2010); 7 = Rodriguez et al. (2006); 8 = Boroson & Lauer (2009); 9 = Wrobel & Laor (2009). Measurements taken from the literature have been adjusted to . For COSMOS J100043.15+020637.2, was estimated from the Spitzer IRAC 8 µm and MIPS 24 µm measurements in Civano et al. (2010) utilizing equation 1 of the current study.
What appears to be the first bona fide binary AGN was discovered in 4C +37.11, which contains two compact radio sources with a projected separation of only 7.5 mas (7 pc). Based on the radio source compactness, variability, motion in the jets, and spectral shapes, Rodriguez et al. (2006) concluded that both radio cores contain AGNs orbiting with a rotational period of yr within a single elliptical galaxy host. It is notable that the sum of the SMBH masses in 4C +37.11, , is similar to Mrk 266; this implies that LIRGs with bulge masses similar to the companions in Mrk 266 may end up as remnants similar to 4C +37.11. The soft X-ray luminosity of 4C +37.11 is times larger than Mrk 266. (Hard X-ray observations of 4C +37.11 are not available.)
Very few additional binary AGNs have been confirmed, although there are a few candidates. Observations of double-peaked emission lines in the radio-quiet QSO SDSS J153636.22+044127.0 () have been interpreted as a candidate binary SMBH with masses and inferred to be separated by only 0.02 mas (0.1 pc) (Boroson & Lauer, 2009). Wrobel & Laor (2009) reported detection of two 8.5 GHz radio continuum sources separated by 097 (5.1 kpc) within the aperture of the original spectroscopic observations, suggesting this is another kpc-scale dual AGN system. However, further observations show the second radio source is an elliptical galaxy that is not the origin of the red- or blue-shifted Balmer lines (Lauer & Boroson, 2009). Another possibility is that SDSS J153636.22+044127.0 is similar to other “double-peak” AGNs such as 3C 390.3 and Arp 102B, which were also promoted as candidate binary AGNs but later found to be more consistent with a rapidly rotating accretion disk within a single broad-line region (Gaskell, 2010). Additional observations are needed to distinguish between these alternate hypotheses.
Table 10 lists basic parameters for the small number of confirmed dual AGNs and putative binary AGNs discussed above. Due to the high degree of uncertainty in age dating mergers with factors such as nuclear separation, the morphology of tidal debris, and varying techniques applied in the simulations of specific systems, we propose a merger sequence based on the quantitative parameter , where is the 2-10 keV hard X-ray from XMM where available, otherwise the 2-7 keV band from Chandra. According to the evolutionary paradigm whereby ULIRGs transform into UV/optical QSOs during the merger of gas-rich galaxies (Sanders et al., 1988a, b), the degree to which the luminous optical/UV/X-ray emission from the accretion disk is obscured should diminish as superwinds driven by star formation and/or AGNs diffuse or expel the dust from the system. To the extent that increasing , given in parenthesis below, is a reliable gauge of the degree to which the embedded AGN-powered UV/X-ray sources have emerged from their obscuring cocoons, a presumptive sequence is: 181818SDSS J153636.22+044127.0 is omitted from the proposed sequence because its nature as a true binary AGN is controversial, and the required IR and X-ray measurements are not yet available..
Despite the growing number of kpc-scale dual AGNs, the number of sub-parsec binary AGNs in the class of 4C +37.11 remains very small. Currently SDSS J153636.22+044127.0 is the only candidate out of AGNs with in the SDSS (Lauer & Boroson, 2009). Similarly, a recent study of VLBA data for over 3100 radio-luminous AGNs found only one binary, the previously known 4C +37.11 (Burke-Spolaor, 2011). Since major mergers provide a natural process to form binary SMBHs, the apparent dearth of binary AGNs needs explanation. Gaskell (2010) has noted two possibilities: either the lifetime of binary SMBHs is much shorter than predicted (i.e., they inspiral very rapidly rather than remaining in a stalled orbit), or fueling of the accretion disk(s) is somehow suspended. The former explanation seems unlikely because the very presence of the accretion disks forms a significant buffer against rapid inspiral and effectively “softens” the SMBH merger process. A possible physical mechanism for the latter suggestion may be that AGN jets have the potential to impart enough energy into the inner parsecs of a galaxy to impede gas inflow to the accretion disk (Nagar et al., 2005). We propose another physically viable alternative: If dual AGNs are confirmed in many more (U)LIRGs in intermediate stages of the merger process with kpc scale separations (i.e., if most of the LINERs in the GOALS and IRAS 1 Jy ULIRG samples are confirmed to be ionized by a power-law source as suggested by the radio observations of Nagar et al. (2003)), this raises the possibility that there will be an insufficient fuel supply remaining to power luminous binary AGNs late in the merger process.
The lifetime of nuclear starbursts and AGNs is inversely proportional to the efficiency of gas depletion and ranges between for ULIRGs and yr for LIRGs (e.g., Solomon & Vanden Bout, 2005). The lifetime of powerful radio-loud AGNs has also been estimated to be only yr (Bird et al., 2008). This is similar to the dynamical time scale of the final coalescence of the nuclei with high circular velocity at the core of a merger, but only 1-10% of the Gyr time scale for dynamical relaxation of the stars in outer orbits of the remnant galaxy (e.g., Mihos, 1999). Therefore, it is possible that starbursts and dual AGNs may consume or expel the bulk of available gas relatively early in many major mergers, leaving insufficient fuel to power QSOs that can be detected spectroscopically through the stage when the SMBHs inspiral to form a true binary and then coalesce or recoil. This hypothesis counters simulations that find AGN accretion rates peak during the SMBH coalescence (e.g., Johansson et al., 2009).
4. Summary and Conclusions
We have presented the results of a multi-wavelength campaign on the luminous infrared galaxy (LIRG) system Markarian 266 that has yielded the following conclusions regarding the morphology, nuclei, dust, molecular gas, outflows, star clusters, and radiation between the nuclei, as well as implications for a better understanding of the origin of ULIRGs and binary AGNs.
1. HST images show that the “double-nucleus galaxy” observed in low-resolution images is a strongly interacting pair; we classify the SW and NE galaxies as SBb (pec) and S0/a (pec), respectively. Deeper imaging reveals asymmetric tidal debris spanning 100 kpc. At H band, the companions are more luminous than galaxies, and their estimated stellar masses are (SW) and (NE). The stellar bulge luminosities imply remarkably similar nuclear black hole masses of .
2. The NE (LINER) nucleus is emitting 6.4 times more hard X-ray (2-7 keV) flux than the SW (Seyfert 2) nucleus, yet the luminosity of the NE galaxy is only 20% of the SW galaxy at 24 µm and in CO (1-0) molecular gas emission. The Chandra spectra indicate that the SW nucleus is likely the primary source of a bright Fe K line detected in the XMM spectrum of the total system, consistent with a reflection-dominated X-ray spectrum of a heavily obscured AGN. The F(X-ray)/F([O III]) flux ratios also indicate the SW nucleus is much more heavily obscured than the NE nucleus.
3. Soft (0.4-2 keV) X-ray emission extends 15 kpc to the north of the system, between the nuclei, and 3 kpc west of the SW nucleus. The smoothed X-ray structure corresponds remarkably well with filaments in H and [O III] images. A ridge of X-ray emission between the galaxies has an X-ray spectrum consistent with K shock-heated gas, strengthening the idea that the corresponding radio emission is shock-induced synchrotron radiation. The lack of detected 9.7 µm S(3) line emission supports the suggestion that a very fast shock at the interface of superwinds expanding from the two galaxies might generate the observed non-thermal radio continuum emission and heat the gas above the dissociation temperature of . The derived cooling time of the X-ray emitting gas between the nuclei is only 4 Myr.
4. The HST optical images reveal a circumnuclear arc containing three knots 240 pc west of the NE nucleus. The arc is embedded within B-band emission with a filamentary, bi-conic morphology extending over a radius of 1.2 kpc. This region appears to be dominated by nebular emission from the narrow-line region of a double-sided AGN ionization cone. Radio continuum emission at 1.6 GHz peaks at the optical/near-IR nucleus and has components in alignment with the nucleus and the circumnuclear B-band knots (PA56°). A plausible explanation is that the optical knots are clouds entrained in a shock front produced by an AGN-powered collimated plasma outflow (jet). We liken this region to the radiative bow shock 230 pc south of the LINER in M51.
5. Mid-IR spectral diagnostics suggest the bolometric luminosity is powered by roughly an equal mixture of radiation from AGNs and star formation, with substantial scatter among the various methods. Newly constructed SEDs give infrared luminosities of (2.3, 0.7, 3.4) for the SW, NE, and total system respectively. Decomposition of the SED of the total system indicates that cold (26 K), cool (72 K), warm (235 K) and hot (1500 K) thermal dust components contribute approximately 57%, 20%, 12%, and 11% of the bolometric luminosity, respectively. The total cold dust mass estimate is .
6. HST imaging resolves the Northern Loop extending 6-20 kpc from the galaxies into a fragmented morphology suggestive of Rayleigh-Taylor instabilities. A few structures 300-600 pc in length are radially aligned with the NE nucleus, suggestive of bow shocks predicted by hydrodynamic simulations of galactic superwinds. Detection of 24 µm emission in the Northern Loop implies that at least of dust is being swept out of the system by the superwind during a “blow-out” phase that is well underway prior to the final galaxy merger.
7. Approximately 120 star clusters detected with HST are concentrated in the SW galaxy and at the base of the Northern Loop; most have estimated ages less than 50 Myr and masses of . The ratios of cluster surface densities, and within 3 kpc of each nucleus are similar (i.e., ). The star cluster luminosity function is similar to what has been found in other LIRGs, and the unobscured clusters contribute little to powering the total infrared luminosity.
8. We conclude that Mrk 266 NE is an AGN based on the presence of: (1) an obscured, hard X-ray point source; (2) a radiative bow shock aligned with ionization cones and apparent radio plasma outflow; (3) PAH emission with small equivalent widths and a deficiency of 6.2 and 7.7 µm flux relative to 11.3 µm flux; and (4) a flux ratio of 3.5. The spatially extended emission demonstrates that LINERs can exhibit strong signatures of an AGN and shock excitation.
9. The bulk of the CO (1-0) emission in the system is aligned with the major axis of the SW galaxy. HCN (1-0) is aligned with 9.7 µm emission in the nucleus of Mrk 266 NE. However, the CO (1-0) and HCO (1-0) emission peaks are located 1 kpc SE of the NE nucleus, suggesting that either most of the cold molecular gas has already been stripped from the NE galaxy, or gas is being transferred from the SW galaxy to the NE galaxy. Approximately 40% of the total CO (1-0) emission is bridging the galaxies, likely in-falling toward the center of mass or transferring between the galaxies. In this regard, Mrk 266 appears to be in an evolutionary stage similar to VV 114, NGC 6090, and NGC 6240.
10. Two lines of evidence suggest Mrk 266 may evolve into a ULIRG: First, in the context of merger simulations, the galaxies lie within an asymmetric, low surface-brightness halo of tidal debris spanning 100 kpc, with a projected separation of 6 kpc and a relative velocity of only , indicating they are likely undergoing their second or third encounter with only 50 to 250 Myr remaining until they merge via tidal dissipation. Therefore, Mrk 266 appears to be in a short-lived stage when the nuclei are about to enter the final phase of coalescence characteristic of ULIRGs. Second, the total cold molecular gas mass of is similar to local and high-redshift ULIRGs. Since 40% of the total CO (1-0) emission is located between the galaxies, this reservoir is available to form more stars and to fuel the AGNs as the stellar systems and nuclei inexorably coalesce.
11. We propose that Mrk 266 belongs to an evolutionary sequence in which dual AGNs with kpc separations represent precursors to putative binary AGNs with pc scale orbital radii. In this scenario, where Mrk 266 is in an intermediate phase between Mrk 171 and NGC 6240, the global ratio increases by over four orders of magnitude as obscuring material is expelled by outflows to gradually expose previously obscured AGNs.
12. Since major mergers provide a natural process to form SMBH/AGN pairs, the scarcity of confirmed and candidate binary QSOs in large spectroscopic and VLBI surveys is unexpected. While two possibilities are raised in the literature, that either the SMBHs inspiral very rapidly, or fueling of the accretion disks is quenched during the binary phase, we propose a third hypothesis. Since the gas-depletion lifetime of ULIRGs and LIRGs is 10-100 times shorter than the time-scale for creation of a binary SMBH (1 Gyr), it is possible that, in most instances, the gas will be consumed by star formation and accretion during a dual AGN phase long before the SMBHs inspiral to sub-pc separation.
Facilities: CXO (ACIS-S), XMM-Newton (EPIC pn, OM), GALEX (FUV, NUV), HST(ACS, NICMOS), UH:2.2m (), Spitzer(IRAC, MIPS, IRS) Objects: Mrk 266 (catalog Mrk 266), Mrk 266 SW (catalog Mrk 266 SW), Mrk 266 NE (catalog Mrk 266 NE)
5. Appendix
5.1. Photometric Data for Mrk 266
Figure 31 displays regions parameterized in Table 11 that were used to perform aperture photometry tabulated in Tables 12 and 13, as plotted in Figure 9 (§2.6.2).
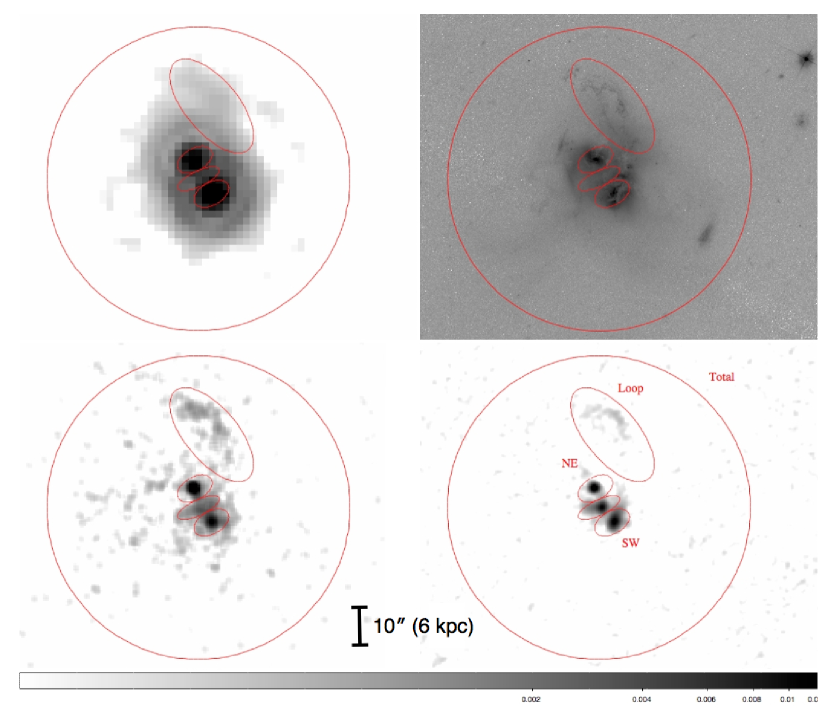
| Region | RA, DEC (J2000) | a″ | b″ | PA° |
|---|---|---|---|---|
| (1) | (2) | (3) | (4) | (5) |
| SW | (13:38:17.28,+48:16:32.1) | 5.0 | 3.0 | 120 |
| NE | (13:38:17.79,+48:16:41.2) | 5.0 | 3.0 | 120 |
| Between Galaxies | (13:38:17.51,+48:16:36.8) | 6.0 | 2.0 | 115 |
| Northern Loop | (13:38:17.54,+48:16:56.0) | 17.0 | 7.5 | 40 |
| Total System | (13:38:17.66,+48:16:35.8) | 40.0 | 40.0 |
Note. — Parameters for elliptical apertures used for photometric measurements, as illustrated in Fig. 31.
| Bandpass | (Hz) | (Jy) | (Jy) | Ref. |
|---|---|---|---|---|
| (1) | (2) | (3) | (4) | (5) |
| 2-10 keV (ASCA) | 1.45E+18 | 2.48E-08 | 5.0E-09 | 2 |
| 2.0-7.0 keV (XMM) | 1.09E+18 | 2.11E-08 | 6.3E-09 | 1 |
| 0.7-7 keV (ASCA) | 9.31E+17 | 3.65E-08 | 7.3E-09 | 2 |
| 0.5-2.0 keV (XMM) | 3.02E+17 | 5.96E-08 | 1.2E-08 | 1 |
| GALEX FUV | 1.96E+15 | 7.94E-04 | 3.1E-05 | 1 |
| XMM-OM UVW2 | 1.41E+15 | 2.06E-03 | 8.0E-04 | 1 |
| GALEX NUV | 1.32E+15 | 1.63E-03 | 3.4E-05 | 1 |
| XMM-OM UVW1 | 1.03E+15 | 2.12E-03 | 2.6E-04 | 1 |
| XMM-OM U | 8.71E+14 | 3.87E-03 | 1.4E-03 | 1 |
| HST ACS F435W (B) | 6.89E+14 | 8.92E-03 | 4.1E-05 | 1 |
| V (Johnson) | 5.42E+14 | 1.82E-02 | 8.6E-04 | 3 |
| LW2 (ISOCAM) | 4.44E+13 | 1.14E-01 | 1.4E-02 | 4 |
| R (Johnson) | 4.28E+14 | 2.86E-02 | 8.0E-04 | 3 |
| HST ACS F814W (I) | 3.68E+14 | 2.97E-02 | 5.5E-05 | 1 |
| 2MASS J (1.2 m) | 2.43E+14 | 5.44E-02 | 6.5E-04 | 1 |
| 2MASS H (1.6 m) | 1.80E+14 | 6.42E-02 | 8.8E-04 | 1 |
| 2MASS Ks (2.2 m) | 1.39E+14 | 6.02E-02 | 8.3E-04 | 1 |
| Spitzer 3.6 m | 8.44E+13 | 3.82E-02 | 5.7E-03 | 1 |
| Spitzer 4.5 m | 6.67E+13 | 3.05E-02 | 4.6E-03 | 1 |
| Spitzer 5.8 m | 5.23E+13 | 6.80E-02 | 1.0E-02 | 1 |
| Spitzer 8.0 m | 3.81E+13 | 1.79E-01 | 2.7E-02 | 1 |
| IRAS 12 m | 2.50E+13 | 3.20E-01 | 1.8E-02 | 5 |
| Spitzer 24 m | 1.27E+13 | 9.55E-01 | 1.9E-01 | 1 |
| IRAS 25 m | 1.20E+13 | 1.07E+00 | 2.8E-02 | 5 |
| IRAS 60 m | 5.00E+12 | 7.25E+00 | 3.3E-02 | 5 |
| Spitzer 70 m | 4.20E+12 | 8.95E+00 | 1.8E+00 | 1 |
| IRAS 100 m | 3.00E+12 | 1.01E+01 | 1.4E-01 | 5 |
| Spitzer 160 m | 1.92E+12 | 6.41E+00 | 1.3E+00 | 1 |
| 170 m (ISO) | 1.76E+12 | 8.73E+00 | 2.6E+00 | 6 |
| SCUBA 850 m | 3.53E+11 | 8.20E-02 | 1.7E-02 | 7 |
| 20.0 GHz (OVRO) | 2.00E+10 | 1.49E-02 | 1.3E-03 | 8 |
| 4.85 GHz | 4.85E+09 | 4.70E-02 | 7.1E-03 | 9 |
| 1.46 GHz (VLA) | 1.46E+09 | 1.07E-01 | 6.2E-03 | 8 |
| Texas 365 MHz | 3.65E+08 | 3.53E-01 | 4.3E-02 | 10 |
| 151 MHz (6C) | 1.52E+08 | 5.90E-01 | 4.0E-02 | 11 |
Note. — Reference codes in Column (5): 1=New measurements in this article; 2=Ueda et al. (2005); 3=Huchra (1977); 4=Ramos Almeida et al. (2007); 5=Sanders et al. (2003); 6=Stickel et al. (2004); 7=Dunne et al. (2000); 8=Edelson (1987); 9=Becker et al. (1991); 10=Douglas et al. (1996); 11=Hales et al. (1990).
| Bandpass | (Hz) | (Jy) | (Jy) | Ref. |
|---|---|---|---|---|
| (1) | (2) | (3) | (4) | (5) |
| Mrk 266 SW | ||||
| 2.0-7.0 keV | 1.09E+18 | 2.02E-09 | 6.1E-10 | 1 |
| 0.5-2.0 keV | 3.02E+17 | 7.28E-09 | 1.5E-09 | 1 |
| XMM-OM UVW2 | 1.41E+15 | 1.68E-04 | 1.1E-05 | 1 |
| XMM-OM UVW1 | 1.03E+15 | 2.72E-04 | 5.4E-05 | 1 |
| XMM-OM U | 8.71E+14 | 5.12E-04 | 2.2E-05 | 1 |
| HST ACS F435W (B) | 6.89E+14 | 1.31E-03 | 1.2E-05 | 1 |
| HST ACS F814W (I) | 3.68E+14 | 5.03E-03 | 2.3E-05 | 1 |
| 2MASS J (1.2 m) | 2.43E+14 | 1.04E-02 | 2.5E-04 | 1 |
| NICMOS H (1.6 m) | 1.87E+14 | 1.45E-02 | 1.7E-04 | 1 |
| 2MASS H (1.6 m) | 1.80E+14 | 1.46E-02 | 3.3E-04 | 1 |
| 2MASS Ks (2.2 m) | 1.39E+14 | 1.53E-02 | 3.1E-04 | 1 |
| Spitzer 3.6 m | 8.44E+13 | 1.50E-02 | 2.3E-03 | 1 |
| Spitzer 4.5 m | 6.67E+13 | 1.47E-02 | 2.2E-03 | 1 |
| Spitzer 5.8 m | 5.23E+13 | 4.59E-02 | 6.9E-03 | 1 |
| Spitzer 8.0 m | 3.81E+13 | 1.28E-01 | 1.9E-02 | 1 |
| Spitzer 24 m | 1.27E+13 | 5.91E-01 | 1.2E-01 | 1 |
| Spitzer 70 maaThe 70 and 160 µm flux densities for the SW and NE galaxies were estimated using the 8 and 24 µm measurements as described in the text. | 4.20E+12 | 6.01E+00 | 1.2E+00 | 1 |
| Spitzer 160 maaThe 70 and 160 µm flux densities for the SW and NE galaxies were estimated using the 8 and 24 µm measurements as described in the text. | 1.92E+12 | 4.30E+00 | 8.6E-01 | 1 |
| 2 cm | 1.50E+10 | 4.90E-03 | 7.0E-04 | 12 |
| 6 cm | 4.89E+09 | 1.01E-02 | 5.0E-04 | 12 |
| 20 cm | 1.47E+09 | 3.24E-02 | 1.4E-03 | 12 |
| Mrk 266 NE | ||||
| 2.0-7.0 keV | 1.09E+18 | 1.29E-08 | 3.9E-09 | 1 |
| 0.5-2.0 keV | 3.02E+17 | 9.93E-09 | 2.0E-09 | 1 |
| XMM-OM UVW2 | 1.41E+15 | 2.45E-04 | 2.0E-05 | 1 |
| XMM-OM UVW1 | 1.03E+15 | 3.63E-04 | 9.1E-05 | 1 |
| XMM-OM U | 8.71E+14 | 6.49E-04 | 3.0E-05 | 1 |
| HST ACS F435W (B) | 6.89E+14 | 1.59E-03 | 1.5E-05 | 1 |
| HST ACS F814W (I) | 3.68E+14 | 6.02E-03 | 2.8E-05 | 1 |
| 2MASS J (1.2 m) | 2.43E+14 | 9.62E-03 | 2.4E-04 | 1 |
| NICMOS H (1.6 m) | 1.87E+14 | 1.22E-02 | 1.6E-04 | 1 |
| 2MASS H (1.6 m) | 1.80E+14 | 1.22E-02 | 3.0E-04 | 1 |
| 2MASS Ks (2.2 m) | 1.39E+14 | 1.09E-02 | 2.6E-04 | 1 |
| Spitzer 3.6 m | 8.44E+13 | 7.35E-03 | 1.1E-03 | 1 |
| Spitzer 4.5 m | 6.67E+13 | 5.90E-03 | 8.9E-04 | 1 |
| Spitzer 5.8 m | 5.23E+13 | 9.57E-03 | 1.4E-03 | 1 |
| Spitzer 8.0 m | 3.81E+13 | 2.23E-02 | 3.3E-03 | 1 |
| Spitzer 24 m | 1.27E+13 | 3.28E-01 | 6.6E-02 | 1 |
| Spitzer 70 maaThe 70 and 160 µm flux densities for the SW and NE galaxies were estimated using the 8 and 24 µm measurements as described in the text. | 4.20E+12 | 1.74E+00 | 7.0E-01 | 1 |
| Spitzer 160 maaThe 70 and 160 µm flux densities for the SW and NE galaxies were estimated using the 8 and 24 µm measurements as described in the text. | 1.92E+12 | 1.25E+00 | 5.0E-01 | 1 |
| 2 cm | 1.50E+10 | 4.10E-03 | 6.0E-04 | 12 |
| 6 cm | 4.89E+09 | 1.22E-02 | 4.0E-04 | 12 |
| 20 cm | 1.47E+09 | 2.35E-02 | 1.0E-03 | 12 |
| Between the Nuclei | ||||
| 2.0-7.0 keV | 1.09E+18 | 9.19E-10 | 2.8E-10 | 1 |
| 0.5-2.0 keV | 3.02E+17 | 8.60E-09 | 1.7E-09 | 1 |
| 2 cm | 1.50E+10 | 2.70E-03 | 5.0E-04 | 12 |
| 6 cm | 4.89E+09 | 6.00E-03 | 2.7E-03 | 12 |
| 20 cm | 1.47E+09 | 2.15E-02 | 9.0E-04 | 12 |
| Northern Loop | ||||
| 0.5-2.0 keV | 3.02E+17 | 4.63E-09 | 9.3E-10 | 1 |
| XMM-OM UVW2 | 1.41E+15 | 1.94E-04 | 1.7E-06 | 1 |
| XMM-OM UVW1 | 1.03E+15 | 2.10E-04 | 4.8E-06 | 1 |
| XMM-OM U | 8.71E+14 | 4.28E-04 | 3.0E-05 | 1 |
| HST ACS F435W (B) | 6.89E+14 | 8.84E-04 | 1.6E-05 | 1 |
| HST ACS F814W (I) | 3.68E+14 | 2.50E-03 | 2.1E-05 | 1 |
| Spitzer 24 m | 1.27E+13 | 3.62E-02 | 7.2E-03 | 1 |
| 20 cm | 1.47E+09 | 2.60E-03 | 5.0E-05 | 12 |
Note. — The reference codes in Column (5) are as follows: 1=New measurements in this article; 12=Mazzarella et al. (1988).
5.2. Clarification of Regions Covered in Published Spitzer IRS Data for Mrk 266
As noted in §2.7, mid-IR spectroscopy of Mrk 266 obtained in staring mode with the Spitzer IRS is complicated due to aperture affects. To facilitate interpretation of the IRS spectroscopy published to date, the available observations are summarized here, and Table 14 provides clarification of which emission features have been measured for each component of the system.
In the low spectral resolution (R 65-130) observations (AOR #3755264; GTO program P00014; PI J. Houck), the Short-Low (SL, 5.2-14.5 µm) aperture of the IRS contained Mrk 266 NE (off center), and missed both Mrk 266 SW and the central radio/X-ray source; the Long-Low (LL, 14–38 µm) slit contained Mrk 266 SW and the radio/X-ray source between the nuclei, but it missed Mrk 266 NE. Neither aperture had the orientation required to sample the Northern Loop. The low-resolution IRS spectrum displayed in Brandl et al. (2006) is therefore a mixture of emission from Mrk 266 NE in the 5-14 µm region with emission from Mrk 266 SW (and the radio/X-ray source between the nuclei) in the 14-38 µm region.
AOR #3755264 also contained high-resolution observations (spectral resolution 600). Dudik et al. (2007, Fig. 8) plotted the SH and LH apertures of these observations as an overlay on a 20 cm image, although they did not present the resulting spectra; their diagram clearly illustrates the aperture affects that complicate the interpretation of IRS spectra for this system. The SH slit contained only the radio source between the nuclei (missing both nuclei), while the LH slit contained 266 SW and the central radio source but it missed Mrk 266 NE. Observations with the SH (9.9 - 19.6 µm) module were also obtained on 2005 January 10 in Spitzer program P03237 (PI. E. Sturm, AOR #10510592); these data cover the SW nucleus, but not the NE nucleus. The available high-resolution spectra were published in an atlas of Spitzer spectra for a sample of starburst galaxies (Bernard-Salas et al., 2009).
| Feature | Flux () | EQW () | Ref. |
|---|---|---|---|
| (1) | (2) | (3) | (4) |
| Mrk 266 SW | |||
| µm (SH) | B09 | ||
| µm (SH) | B09 | ||
| µm (SH) | B09 | ||
| µm (SH) | B09 | ||
| µm (SH) | B09 | ||
| µm (SH) | B09 | ||
| µm (SH) | B09 | ||
| µm (SH) | B09 | ||
| µm (SH) | B09 | ||
| µm (SH) | B09 | ||
| µm (SH) | B09 | ||
| µm (SH) | B09 | ||
| µm (SH) | B09 | ||
| µm (SH) | B09 | ||
| µm (SH) | B09 | ||
| µm (SH) | B09 | ||
| µm (SH) | B09 | ||
| µm (SH) | B09 | ||
| µm (SH) | B09 | ||
| µm (SH) | B09 | ||
| µm (SH) | B09 | ||
| Mrk 266 SW + Source Between Nucleus | |||
| µm (LL)aaThese features are visible in the low-res spectrum published by Brandl et al. (2006), but fluxes were not published. | B06 | ||
| µm (LL) | 0.403 | B06 | |
| µm (LL)aaThese features are visible in the low-res spectrum published by Brandl et al. (2006), but fluxes were not published. | B06 | ||
| µm (LH) | B09 | ||
| µm (LH)bbThis is consistent with a [Ne V] 24.32 µm flux of measured from the same LH aperture by Dudik et al. (2007, Table 2). | B09 | ||
| µm (LH) | B09 | ||
| µm (LL)aaThese features are visible in the low-res spectrum published by Brandl et al. (2006), but fluxes were not published. | B06 | ||
| µm (LH) | B09 | ||
| µm (LH) | B09 | ||
| µm (LH) | B09 | ||
| µm (LL)aaThese features are visible in the low-res spectrum published by Brandl et al. (2006), but fluxes were not published. | B06 | ||
| µm (LH) | B09 | ||
| Mrk 266 NE | |||
| µm (SL) | 0.619 | B06 | |
| µm (SL) | 0.467 | B06 | |
| µm (SL) | 0.126 | B06 | |
| µm (SL)aaThese features are visible in the low-res spectrum published by Brandl et al. (2006), but fluxes were not published. | B06 | ||
| µm (SH)aaThese features are visible in the low-res spectrum published by Brandl et al. (2006), but fluxes were not published. | B06 | ||
| µm (SL)aaThese features are visible in the low-res spectrum published by Brandl et al. (2006), but fluxes were not published. | B06 | ||
| µm (SL)aaThese features are visible in the low-res spectrum published by Brandl et al. (2006), but fluxes were not published. | B06 | ||
| µm (SL) | 0.422 | B06 | |
| µm (SL) | 0.065 | B06 | |
Note. — Column (1): Spectral line identification followed in parentheses by the IRS module used: SL 5.2-14.5 µm, 37x57″, ; LL 14.0-38.0 µm, 105x1683, ; SH 9.9-19.6 µm, 47x113, ; LH 18.7-37.3 µm, 111x223, . Column (2): Flux in . Column (3): Equivalent width in µm. Column (4): Reference: B06 Brandl et al. (2006); B09 Bernard-Salas et al. (2009).
5.3. Evidence That Fe K Originates in Mrk 266 SW
Another clue to the origin of the Fe K emission in Mrk 266 comes from analysis of the X-ray data in combination with optical spectroscopy. The ratio of X-ray (2-10 keV) continuum flux to (dereddened) emission-line flux has been shown to be anti-correlated with and with the equivalent width of the Fe K line, thus providing an indicator for Compton-thick AGNs (Bassani et al., 1999). Using the values measured from Chandra (Table 2) and the de-reddened [O III] 5007 line fluxes from Veilleux et al. (1995) ( for the SW and NE nuclei), the ratios are 0.28 and 16 for the SW and NE nuclei, respectively. A ratio of indicates a highly absorbed source (), whereas is a signature of a relatively unobscured (Type 1) AGN (Bassani et al., 1999). This result adds compelling evidence that the Fe K line detected in the XMM spectrum of Mrk 266 originates from the SW (Seyfert 2) nucleus. Although Mrk 266 SW is a strong candidate for containing a Compton-thick X-ray source, observations at higher energies and greater sensitivity are required for confirmation.
5.4. Star Clusters Photometry (§3.6)
| SC | R.A. | Dec | |||||||
|---|---|---|---|---|---|---|---|---|---|
| ss.ss | mm ss.s | mag | mag | mag | mag | mag | mag | mag | |
| (1) | (2) | (3) | (4) | (5) | (6) | (7) | (8) | (9) | (10) |
| 001 | 17.19 | 16 32.4 | 21.45 | 0.03 | -14.16 | 21.11 | 0.05 | 0.31 | 0.06 |
| 002 | 17.35 | 16 31.9 | 21.52 | 0.04 | -14.09 | 19.48 | 0.04 | 2.01 | 0.06 |
| 003 | 17.14 | 16 33.9 | 22.50 | 0.04 | -13.11 | 21.25 | 0.08 | 1.22 | 0.09 |
| 004 | 17.35 | 16 30.9 | 22.91 | 0.13 | -12.70 | 21.20 | 0.08 | 1.68 | 0.15 |
| 005 | 18.40 | 16 43.8 | 23.07 | 0.01 | -12.54 | 22.47 | 0.03 | 0.57 | 0.03 |
| 006 | 17.39 | 16 30.9 | 23.08 | 0.07 | -12.53 | 21.21 | 0.05 | 1.84 | 0.09 |
| 007 | 17.16 | 16 36.8 | 23.14 | 0.05 | -12.47 | 22.34 | 0.09 | 0.77 | 0.10 |
| 008 | 17.17 | 16 36.5 | 23.24 | 0.06 | -12.37 | 22.58 | 0.08 | 0.63 | 0.10 |
| 009 | 17.72 | 16 34.1 | 23.53 | 0.02 | -12.08 | 22.83 | 0.03 | 0.67 | 0.04 |
| 010 | 17.02 | 16 36.6 | 23.54 | 0.09 | -12.07 | 22.49 | 0.13 | 1.02 | 0.16 |
| 011 | 17.08 | 16 34.7 | 23.63 | 0.04 | -11.98 | 20.91 | 0.02 | 2.69 | 0.04 |
| 012 | 16.96 | 16 32.0 | 23.84 | 0.09 | -11.77 | 23.17 | 0.20 | 0.64 | 0.22 |
| 013 | 16.15 | 16 39.9 | 23.97 | 0.01 | -11.64 | 22.65 | 0.01 | 1.29 | 0.01 |
| 014 | 16.79 | 16 44.4 | 24.00 | 0.03 | -11.61 | 23.24 | 0.04 | 0.73 | 0.05 |
| 015 | 16.83 | 16 39.2 | 24.09 | 0.10 | -11.52 | 23.87 | 0.16 | 0.19 | 0.19 |
| 016 | 17.68 | 16 38.4 | 24.20 | 0.04 | -11.41 | 23.37 | 0.16 | 0.80 | 0.16 |
| 017 | 17.45 | 16 28.8 | 24.23 | 0.13 | -11.38 | 22.76 | 0.14 | 1.44 | 0.19 |
| 018 | 18.64 | 16 44.5 | 24.28 | 0.06 | -11.33 | 23.80 | 0.07 | 0.45 | 0.09 |
| 019 | 17.06 | 16 31.9 | 24.30 | 0.15 | -11.31 | 23.23 | 0.22 | 1.04 | 0.27 |
| 020 | 16.80 | 16 36.2 | 24.40 | 0.07 | -11.21 | 23.45 | 0.13 | 0.92 | 0.15 |
| 021 | 16.91 | 16 45.6 | 24.54 | 0.03 | -11.07 | 23.82 | 0.04 | 0.69 | 0.05 |
| 022 | 16.71 | 16 40.7 | 24.60 | 0.03 | -11.01 | 23.74 | 0.04 | 0.83 | 0.05 |
| 023 | 18.16 | 16 42.3 | 24.71 | 0.07 | -10.90 | 25.32 | 0.81 | -0.64 | 0.81 |
| 024 | 17.22 | 16 35.2 | 24.72 | 0.08 | -10.89 | 22.91 | 0.12 | 1.78 | 0.14 |
| 025 | 16.62 | 16 45.5 | 24.73 | 0.04 | -10.88 | 23.74 | 0.04 | 0.96 | 0.06 |
| 026 | 17.27 | 16 27.4 | 24.74 | 0.11 | -10.87 | 23.43 | 0.16 | 1.28 | 0.19 |
| 027 | 17.29 | 16 28.4 | 24.76 | 0.26 | -10.85 | 23.47 | 0.32 | 1.26 | 0.41 |
| 028 | 17.57 | 16 42.1 | 24.83 | 0.19 | -10.78 | 23.83 | 0.19 | 0.97 | 0.27 |
| 029 | 17.19 | 16 30.1 | 24.85 | 0.12 | -10.76 | 25.81 | 1.05 | -0.99 | 1.06 |
| 030 | 16.32 | 16 41.0 | 24.86 | 0.02 | -10.75 | 22.23 | 0.01 | 2.60 | 0.02 |
| 031 | 16.77 | 16 45.2 | 24.91 | 0.04 | -10.70 | 24.22 | 0.06 | 0.66 | 0.07 |
| 032 | 16.97 | 16 44.4 | 24.92 | 0.07 | -10.69 | 23.74 | 0.05 | 1.15 | 0.09 |
| 033 | 17.09 | 16 37.9 | 24.92 | 0.15 | -10.69 | 23.32 | 0.16 | 1.57 | 0.22 |
| 034 | 16.53 | 16 31.3 | 24.94 | 0.03 | -10.67 | 23.81 | 0.04 | 1.10 | 0.05 |
| 035 | 17.23 | 16 40.6 | 24.95 | 0.08 | -10.66 | 24.73 | 0.22 | 0.19 | 0.23 |
| 036 | 18.48 | 16 45.2 | 24.97 | 0.05 | -10.64 | 24.43 | 0.07 | 0.51 | 0.09 |
| 037 | 18.45 | 16 36.6 | 25.00 | 0.08 | -10.61 | 24.33 | 0.21 | 0.64 | 0.22 |
| 038 | 18.69 | 16 44.3 | 25.00 | 0.07 | -10.61 | 24.62 | 0.13 | 0.35 | 0.15 |
| 039 | 17.94 | 16 31.3 | 25.05 | 0.06 | -10.56 | 24.07 | 0.07 | 0.95 | 0.09 |
| 040 | 18.38 | 16 45.9 | 25.12 | 0.04 | -10.49 | 24.27 | 0.08 | 0.82 | 0.09 |
| 041 | 16.76 | 16 45.6 | 25.13 | 0.07 | -10.48 | 24.64 | 0.11 | 0.46 | 0.13 |
| 042 | 18.47 | 17 04.5 | 25.14 | 0.03 | -10.47 | 24.17 | 0.03 | 0.94 | 0.04 |
| 043 | 18.73 | 16 44.9 | 25.16 | 0.11 | -10.45 | 24.10 | 0.11 | 1.03 | 0.16 |
| 044 | 16.97 | 16 43.0 | 25.19 | 0.07 | -10.42 | 24.11 | 0.08 | 1.05 | 0.11 |
| 045 | 16.70 | 16 37.2 | 25.20 | 0.13 | -10.41 | 24.57 | 0.25 | 0.60 | 0.28 |
| 046 | 16.92 | 16 42.2 | 25.24 | 0.06 | -10.37 | 24.46 | 0.07 | 0.75 | 0.09 |
| 047 | 17.21 | 16 24.6 | 25.28 | 0.04 | -10.33 | 24.63 | 0.06 | 0.62 | 0.07 |
| 048 | 16.77 | 16 38.7 | 25.32 | 0.14 | -10.29 | 24.72 | 0.31 | 0.57 | 0.34 |
| 049 | 17.16 | 16 28.1 | 25.34 | 0.28 | -10.27 | 24.01 | 0.34 | 1.30 | 0.44 |
| 050 | 17.22 | 16 26.0 | 25.35 | 0.07 | -10.26 | 24.30 | 0.08 | 1.02 | 0.11 |
| 051 | 16.42 | 16 30.9 | 25.36 | 0.05 | -10.25 | 23.23 | 0.03 | 2.10 | 0.06 |
| 052 | 18.32 | 16 43.7 | 25.36 | 0.09 | -10.25 | 24.48 | 0.22 | 0.85 | 0.24 |
| 053 | 17.20 | 16 43.2 | 25.36 | 0.06 | -10.25 | 24.24 | 0.10 | 1.09 | 0.12 |
| 054 | 17.00 | 16 34.6 | 25.38 | 0.22 | -10.23 | 24.57 | 0.58 | 0.78 | 0.62 |
| 055 | 18.57 | 16 51.2 | 25.39 | 0.04 | -10.22 | 24.32 | 0.03 | 1.04 | 0.05 |
| 056 | 18.56 | 16 44.9 | 25.42 | 0.07 | -10.19 | 24.91 | 0.10 | 0.48 | 0.12 |
| 057 | 16.77 | 16 32.1 | 25.48 | 0.27 | -10.13 | 24.40 | 0.33 | 1.05 | 0.43 |
| 058 | 18.66 | 16 45.6 | 25.48 | 0.13 | -10.13 | 24.41 | 0.11 | 1.04 | 0.17 |
| 059 | 17.13 | 16 44.7 | 25.50 | 0.06 | -10.11 | 24.80 | 0.10 | 0.67 | 0.12 |
| 060 | 15.85 | 16 42.5 | 25.50 | 0.04 | -10.11 | 24.53 | 0.04 | 0.94 | 0.06 |
| 061 | 18.77 | 16 42.3 | 25.51 | 0.08 | -10.10 | 24.97 | 0.12 | 0.51 | 0.14 |
| 062 | 16.20 | 16 33.6 | 25.53 | 0.04 | -10.08 | 24.37 | 0.03 | 1.13 | 0.05 |
| 063 | 18.41 | 16 37.7 | 25.53 | 0.09 | -10.08 | 24.57 | 0.20 | 0.93 | 0.22 |
| 064 | 16.72 | 16 35.3 | 25.53 | 0.18 | -10.08 | 23.99 | 0.19 | 1.51 | 0.26 |
| 065 | 18.36 | 16 45.4 | 25.54 | 0.07 | -10.07 | 25.06 | 0.16 | 0.45 | 0.17 |
| 066 | 17.00 | 16 43.0 | 25.59 | 0.10 | -10.02 | 24.76 | 0.16 | 0.80 | 0.19 |
| 067 | 17.63 | 16 31.7 | 25.60 | 0.16 | -10.01 | 24.06 | 0.19 | 1.51 | 0.25 |
| 068 | 19.08 | 16 13.2 | 25.62 | 0.04 | -9.99 | 24.03 | 0.02 | 1.56 | 0.04 |
| 069 | 16.63 | 16 46.2 | 25.64 | 0.11 | -9.97 | 24.75 | 0.13 | 0.86 | 0.17 |
| 070 | 17.33 | 16 40.6 | 25.65 | 0.18 | -9.96 | 24.68 | 0.17 | 0.94 | 0.25 |
| 071 | 18.73 | 16 43.8 | 25.65 | 0.22 | -9.96 | 25.84 | 0.51 | -0.22 | 0.56 |
| 072 | 16.64 | 16 38.9 | 25.66 | 0.09 | -9.95 | 24.82 | 0.14 | 0.81 | 0.17 |
| 073 | 16.09 | 16 31.2 | 25.68 | 0.04 | -9.93 | 24.51 | 0.04 | 1.14 | 0.06 |
| 074 | 17.94 | 16 37.0 | 25.70 | 0.10 | -9.91 | 24.86 | 0.30 | 0.81 | 0.32 |
| 075 | 18.06 | 16 35.4 | 25.70 | 0.12 | -9.91 | 25.18 | 0.29 | 0.49 | 0.31 |
| 076 | 15.58 | 16 41.0 | 25.72 | 0.05 | -9.89 | 24.68 | 0.04 | 1.01 | 0.06 |
| 077 | 20.51 | 16 18.3 | 25.77 | 0.05 | -9.84 | 24.57 | 0.04 | 1.17 | 0.06 |
| 078 | 17.70 | 16 34.7 | 25.77 | 0.15 | -9.84 | 25.10 | 0.33 | 0.64 | 0.36 |
| 079 | 18.29 | 16 43.1 | 25.80 | 0.12 | -9.81 | 24.49 | 0.22 | 1.28 | 0.25 |
| 080 | 18.74 | 16 43.6 | 25.82 | 0.20 | -9.79 | 26.29 | 0.62 | -0.50 | 0.65 |
| 081 | 18.50 | 16 48.8 | 25.92 | 0.08 | -9.69 | 25.25 | 0.08 | 0.64 | 0.11 |
| 082 | 16.72 | 16 45.3 | 25.95 | 0.22 | -9.66 | 25.45 | 0.27 | 0.47 | 0.35 |
| 083 | 16.75 | 16 37.9 | 26.02 | 0.25 | -9.59 | 24.63 | 0.19 | 1.36 | 0.31 |
| 084 | 16.50 | 16 46.1 | 26.06 | 0.07 | -9.55 | 24.71 | 0.06 | 1.32 | 0.09 |
| 085 | 17.31 | 16 39.9 | 26.08 | 0.20 | -9.53 | 25.29 | 0.19 | 0.76 | 0.28 |
| 086 | 16.56 | 16 45.3 | 26.08 | 0.12 | -9.53 | 25.45 | 0.20 | 0.60 | 0.23 |
| 087 | 16.86 | 16 45.9 | 26.12 | 0.13 | -9.49 | 25.54 | 0.23 | 0.55 | 0.26 |
| 088 | 18.54 | 16 45.3 | 26.13 | 0.14 | -9.48 | 25.81 | 0.28 | 0.29 | 0.31 |
| 089 | 16.09 | 16 46.2 | 26.17 | 0.09 | -9.44 | 24.96 | 0.07 | 1.18 | 0.11 |
| 090 | 18.01 | 16 28.7 | 26.19 | 0.11 | -9.42 | 24.78 | 0.09 | 1.38 | 0.14 |
| 091 | 16.85 | 16 38.1 | 26.19 | 0.40 | -9.42 | 25.87 | 0.63 | 0.29 | 0.75 |
| 092 | 16.44 | 16 48.2 | 26.20 | 0.08 | -9.41 | 25.42 | 0.11 | 0.75 | 0.14 |
| 093 | 19.64 | 16 13.9 | 26.23 | 0.07 | -9.38 | 25.11 | 0.05 | 1.09 | 0.09 |
| 094 | 17.86 | 16 32.2 | 26.24 | 0.13 | -9.37 | 24.23 | 0.08 | 1.98 | 0.15 |
| 095 | 16.14 | 16 42.6 | 26.27 | 0.09 | -9.34 | 25.22 | 0.09 | 1.02 | 0.13 |
| 096 | 17.20 | 16 26.4 | 26.29 | 0.16 | -9.32 | 26.50 | 0.79 | -0.24 | 0.81 |
| 097 | 19.40 | 16 36.0 | 26.30 | 0.09 | -9.31 | 25.37 | 0.09 | 0.90 | 0.13 |
| 098 | 16.90 | 16 27.0 | 26.30 | 0.18 | -9.31 | 24.45 | 0.12 | 1.82 | 0.22 |
| 099 | 16.73 | 16 35.7 | 26.31 | 0.41 | -9.30 | 24.08 | 0.21 | 2.20 | 0.46 |
| 100 | 18.68 | 16 50.1 | 26.43 | 0.09 | -9.18 | 25.79 | 0.12 | 0.61 | 0.15 |
| 101 | 17.50 | 16 16.2 | 26.46 | 0.09 | -9.15 | 25.47 | 0.08 | 0.96 | 0.12 |
| 102 | 16.45 | 16 28.4 | 26.50 | 0.11 | -9.11 | 26.66 | 0.39 | -0.19 | 0.41 |
| 103 | 15.87 | 16 39.3 | 26.51 | 0.09 | -9.10 | 25.41 | 0.09 | 1.07 | 0.13 |
| 104 | 14.99 | 16 28.8 | 26.53 | 0.09 | -9.08 | 25.14 | 0.07 | 1.36 | 0.11 |
| 105 | 18.08 | 16 17.9 | 26.55 | 0.10 | -9.06 | 25.66 | 0.10 | 0.86 | 0.14 |
| 106 | 20.16 | 16 24.9 | 26.56 | 0.10 | -9.05 | 25.16 | 0.06 | 1.37 | 0.12 |
| 107 | 18.69 | 16 45.9 | 26.56 | 0.36 | -9.05 | 25.34 | 0.27 | 1.19 | 0.45 |
| 108 | 16.44 | 16 35.0 | 26.58 | 0.13 | -9.03 | 25.16 | 0.13 | 1.39 | 0.18 |
| 109 | 17.49 | 16 11.3 | 26.63 | 0.09 | -8.98 | 25.69 | 0.10 | 0.91 | 0.13 |
| 110 | 15.71 | 16 24.7 | 26.63 | 0.10 | -8.98 | 25.49 | 0.09 | 1.11 | 0.13 |
| 111 | 15.77 | 16 44.5 | 26.76 | 0.12 | -8.85 | 24.62 | 0.05 | 2.11 | 0.13 |
| 112 | 17.22 | 16 44.0 | 26.77 | 0.21 | -8.84 | 25.77 | 0.41 | 0.97 | 0.46 |
| 113 | 16.42 | 16 46.4 | 26.85 | 0.16 | -8.76 | 25.87 | 0.19 | 0.95 | 0.25 |
| 114 | 16.04 | 16 21.8 | 26.89 | 0.12 | -8.72 | 26.14 | 0.16 | 0.72 | 0.20 |
| 115 | 16.78 | 16 57.1 | 27.07 | 0.18 | -8.54 | 25.73 | 0.12 | 1.31 | 0.22 |
| 116 | 18.37 | 16 40.5 | 27.12 | 0.88 | -8.49 | 24.25 | 0.28 | 2.84 | 0.92 |
| 117 | 15.93 | 16 50.7 | 27.13 | 0.17 | -8.48 | 25.98 | 0.13 | 1.12 | 0.21 |
| 118 | 15.67 | 16 48.2 | 27.16 | 0.13 | -8.45 | 25.59 | 0.09 | 1.54 | 0.16 |
| 119 | 17.56 | 16 56.9 | 27.23 | 0.22 | -8.38 | 25.73 | 0.13 | 1.47 | 0.26 |
Note. — Column (1): Star cluster (candidate) number. Cols. (2) and (3): J2000 R.A. and Dec of the object. To save space, offsets in seconds of time in R.A. and offsets in arcminutes and arcseconds in Dec are listed. Full coordinates are obtained by adding these values to R.A.=13h38m and Dec=48d (e.g., 13h38m17.19s; 48d16m32.4s). The uncertainty in the coordinates is . The objects can be identified as “Mrk 266 SC” or as “GOALS Jhhmmssss+ddmmsss.” For example: Mrk 266 SC001 = GOALS J13381719+4816324. Col. (4): apparent mag in the HST ACS F435W (B) filter. Col. (5): uncertainty in the B mag. Col. (6): absolute B mag. Col. (7): apparent mag in the HST ACS F814W (I) filter. Col. (8): uncertainty in the I mag. Col. (9): B - I color mag. Col. (10): uncertainty in the B - I color mag. Absolute B mag and B-I colors have been corrected for foreground Galactic extinction using values from Schlegel et al. (1998) as provided by NED: mag; mag. These data have not been corrected for extinction within Mrk 266 (see §3.6.2).
References
- Alton et al. (1999) Alton, P. B., Davies, J. I., & Bianchi, S. 1999, A&A, 343, 51
- Appleton et al. (2006) Appleton, P. N., et al. 2006, ApJ, 639, L51
- Armus et al. (1990) Armus, L., Heckman, T. M., & Miley, G. K. 1990, ApJ, 364, 471
- Armus et al. (2007) Armus, L., et al. 2007, ApJ, 656, 148
- Armus et al. (2009) Armus, L.; Mazzarella, J. M.; Evans, A. S. et al. 2009, PASP, 121, 559
- Arnouts et al. (2007) Arnouts, S., et al. 2007, A&A, 476, 137
- Awaki et al. (1991) Awaki, H., Koyama, K., Inoue, H., & Halpern, J. P. 1991, PASJ, 43, 195
- Ballo et al. (2004) Ballo, L., Braito, V., Della Ceca, R., et al. 2004, ApJ, 600, 634
- Barnes & Hernquist (1996) Barnes, J. E., & Hernquist, L. 1996, ApJ, 471, 115
- Bassani et al. (1999) Bassani, L. et al. 1999, ApJS, 121, 473
- Becker et al. (1991) Becker, R. H., White, R. L., & Edwards, A. L. 1991, ApJS, 75, 1
- Bernard-Salas et al. (2009) Bernard-Salas, J., et al. 2009, ApJS, 184, 230
- Bertin & Arnouts (1996) Bertin, E., & Arnouts, S. 1996, A&AS, 117, 393
- Bianchi et al. (2008) Bianchi, S., et al. 2008, MNRAS, 386, 105
- Bird et al. (2008) Bird, J., Martini, P., & Kaiser, C. 2008, ApJ, 676, 147
- Boroson & Lauer (2009) Boroson, T. A., & Lauer, T. R. 2009, Nature, 458, 53
- Brandl et al. (2006) Brandl, B. R., et al. 2006, ApJ, 653, 1129
- Brassington et al. (2007) Brassington, N. J., Ponman, T. J., & Read, A. M. 2007, MNRAS, 377, 1439
- Bruzual & Charlot (2003) Bruzual, G., & Charlot, S. 2003, MNRAS, 344, 1000
- Bryant & Scoville (1999) Bryant, P. M., & Scoville, N. Z. 1999, AJ, 117, 2632
- Burke-Spolaor (2011) Burke-Spolaor, S. 2011, MNRAS, 410, 2113
- Calzetti et al. (1994) Calzetti, D., Kinney, A. L., & Storchi-Bergmann, T. 1994, ApJ, 429, 582
- Caputi et al. (2007) Caputi, K. I., et al. 2007, ApJ, 660, 97
- Cecil (1988) Cecil, G. 1988, ApJ, 329, 38
- Civano et al. (2010) Civano, F., et al. 2010, ApJ, 717, 209
- Cluver et al. (2010) Cluver, M. E., et al. 2010, ApJ, 710, 248
- Cole et al. (2001) Cole, S., et al. 2001, MNRAS, 326, 255
- Colpi & Dotti (2009) Colpi, M., & Dotti, M. 2009, arXiv:0906.4339
- Comerford et al. (2009) Comerford, J. M., Griffith, R. L., Gerke, B. F., et al. 2009, ApJ, 702, L82
- Condon et al. (1993) Condon, J. J., Helou, G., Sanders, D. B., & Soifer, B. T. 1993, AJ, 105, 1730
- Cooper et al. (2008) Cooper, J. L., Bicknell, G. V., Sutherland, R. S., & Bland-Hawthorn, J. 2008, ApJ, 674, 157
- Cox et al. (2006) Cox, T. J., Jonsson, P., Primack, J. R., & Somerville, R. S. 2006, MNRAS, 373, 1013
- Dasyra et al. (2008) Dasyra, K. M., et al. 2008, ApJ, 674, L9
- Davies et al. (2000) Davies, R., Ward, M., & Sugai, H. 2000, ApJ, 535, 735
- de Propris et al. (1998) de Propris, R., Eisenhardt, P. R., Stanford, S. A., & Dickinson, M. 1998, ApJ, 503, L45
- de Vaucouleurs et al. (1991) de Vaucouleurs, G., et al. 1991, Volume 1-3, XII, Springer-Verlag Berlin Heidelberg New York (RC3)
- Douglas et al. (1996) Douglas, J. N., et al. 1996, AJ, 111, 1945
- Downes & Solomon (1998) Downes, D., & Solomon, P. M. 1998, ApJ, 507, 615
- Draine & Li (2001) Draine, B. T., & Li, A. 2001, ApJ, 551, 807
- Dubinski et al. (1996) Dubinski, J., Mihos, J. C., & Hernquist, L. 1996, ApJ, 462, 576
- Dudik et al. (2007) Dudik, R. P., et al. 2007, ApJ, 664, 71
- Dunne et al. (2000) Dunne, L., Eales, S., Edmunds, M., et al. 2000, MNRAS, 315, 115
- Edelson (1987) Edelson, R. A. 1987, ApJ, 313, 651
- Engel et al. (2010) Engel, H., Davies, R. I., Genzel, R., et al. 2010, A&A, 524, A56
- Evans et al. (2005) Evans, A. S., Mazzarella, J. M., Surace, J. A., Frayer, D. T., Iwasawa, K., & Sanders, D. B. 2005, ApJS, 159, 197
- Fazio et al. (2004) Fazio, G. G., et al. 2004, ApJS, 154, 10
- Ferrarese & Ford (2005) Ferrarese, L., & Ford, H. 2005, Space Science Reviews, 116, 523
- Ford et al. (1985) Ford, H., Crane, P., Jacoby, G., et al. 1985, ApJ, 293, 132
- Gaskell (2010) Gaskell, C. M. 2010, Nature, 463, E1
- Gavazzi et al. (1996) Gavazzi, G., Pierini, D., & Boselli, A. 1996, A&A, 312, 397
- Ghisellini, Haardt & Matt (1994) Ghisellini, G., Haardt, F., & Matt, G. 1994, MNRAS, 267, 743
- Gieles et al. (2006) Gieles, M., et al. 2006, A&A, 450, 129
- Gonzalez-Martin et al. (2006) Gonzalez-Martin, O., et al. 2006, A&A, 460, 45
- Graciá-Carpio et al. (2008) Graciá-Carpio, J., García-Burillo, S., & Planesas, P. 2008, Ap&SS, 313, 331
- Grimes et al. (2005) Grimes, J. P., Heckman, T., Strickland, D., & Ptak, A. 2005, ApJ, 628, 187
- Hales et al. (1990) Hales, S. E. G., et al. 1990, MNRAS, 246, 256
- Heckman et al. (1990) Heckman, T. M., Armus, L., & Miley, G. K. 1990, ApJS, 74, 833
- Hildebrand (1983) Hildebrand, R. H. 1983, QJRAS, 24, 267
- Hinshaw et al. (2009) Hinshaw, G., et al. 2009, ApJS, 180, 225
- Ho (2008) Ho, L. C. 2008, ARA&A, 46, 475
- Hony et al. (2001) Hony, S., Van Kerckhoven, C., et al. 2001, A&A, 370, 1030
- Hopkins et al. (2006) Hopkins, P. F., Hernquist, L., Cox, T. J., et al. 2006, ApJS, 163, 1
- Houck et al. (2004) Houck, J. R., et al. 2004, ApJS, 154, 18
- Howell et al. (2010) Howell, J. H., Armus, L., Mazzarella, J. M., et al. 2010, ApJ, 715, 572
- Huchra (1977) Huchra, J. P. 1977, ApJS, 35, 171
- Hutchings et al. (1988) Hutchings, J. B., Neff, S. G., & van Gorkom, J. H. 1988, AJ, 96, 1227
- Imanishi et al. (2007) Imanishi, M., Nakanishi, K., Tamura, Y., Oi, N., & Kohno, K. 2007, AJ, 134, 2366
- Imanishi et al. (2009) Imanishi, M., Nakanishi, K., Tamura, Y., & Peng, C.-H. 2009, AJ, 137, 3581
- Inami et al. (2010) Inami, H., et al. 2010, AJ, 140, 63
- Ishida (2004) Ishida, C. M. 2004, Ph.D. Thesis, IfA, University of Hawaii
- Ishigaki et al. (2000) Ishigaki, T., et al. 2000, PASJ, 52, 185
- Iwasawa et al. (2005) Iwasawa, K., Crawford, C. S., Fabian, A. C., & Wilman, R. J. 2005, MNRAS, 362, L20
- Iwasawa et al. (2005) Iwasawa, K., Sanders, D. B., Evans, A. S., Trentham, N., Miniutti, G., & Spoon, H. W. W. 2005, MNRAS, 357, 565
- Iwasawa et al. (2009) Iwasawa, K., Sanders, D. B., Evans, A. S., Mazzarella, J. M., Armus, L., & Surace, J. A. 2009, ApJ, 695, L103
- Iwasawa et al. (2011) Iwasawa, K., et al. 2011, A&A, 529, A106
- Jarrett et al. (1999) Jarrett, T. H., et al. 1999, AJ, 118, 2132
- Jiang et al. (2008) Jiang, C. Y., et al. 2008, ApJ, 675, 1095
- Johansson et al. (2009) Johansson, P. H., Burkert, A., & Naab, T. 2009, ApJ, 707, L184
- Karl et al. (2010) Karl, S. J., Naab, T., Johansson, P. H., et al. 2010, ApJ, 715, L88
- Kewley et al. (2006) Kewley, L. J., Groves, B., Kauffmann, G., & Heckman, T. 2006, MNRAS, 372, 961
- Khachikian et al. (2006) Khachikian, E., et al. 2006, MNRAS, 368, 461
- Kim et al. (1995) Kim, D.-C., Sanders, D. B., Veilleux, S., Mazzarella, J. M., & Soifer, B. T. 1995, ApJS, 98, 129
- Kollatschny & Kowatsch (1998) Kollatschny, W., & Kowatsch, P. 1998, A&A, 336, L21
- Komossa et al. (2003) Komossa, S., Burwitz, V., Hasinger, G., Predehl, P., Kaastra, J. S., & Ikebe, Y. 2003, ApJ, 582, L15
- Koss et al. (2012) Koss, M., Mushotzky, R., Treister, E., et al. 2012, ApJ, 746, L22
- Krist (1993) Krist, J. 1993, ADASS II, 52, 536
- Krolik et al. (1994) Krolik, J. H., Madau, P., & Zycki, P. T. 1994, ApJ, 420, L57
- Kuntz et al. (2008) Kuntz, K. D., Harrus, I., McGlynn, T., et al. 2008, PASP, 120, 740
- Lacey et al. (2008) Lacey, C. G., et al. 2008, MNRAS, 385, 1155
- Larsen & Richtler (1999) Larsen, S. S., & Richtler, T. 1999, A&A, 345, 59
- Lauer & Boroson (2009) Lauer, T. R., & Boroson, T. A. 2009, ApJ, 703, 930
- Laurent et al. (2000) Laurent, O., Mirabel, I. F., Charmandaris, V., Gallais, P., et al. 2000, A&A, 359, 887
- Le Floc’h et al. (2005) Le Floc’h, E., et al. 2005, ApJ, 632, 169
- Leipski et al. (2006) Leipski, C., Falcke, H., Bennert, N., Huttemeister, S. 2006, A&A, 455, 161
- Lim (2003) Lim, A. J. 2003, Rev. Mex. A&A Conf. Ser., 15, 131
- Liu et al. (2010) Liu, X., Greene, J. E., Shen, Y., & Strauss, M. A. 2010, ApJ, 715, L30
- Magtesian & Khachikian (1991) Magtesian, A. P., & Khachikian, E. Ye. 1991, Soviet Astronomy Letters, 17, 447
- Marconi & Hunt (2003) Marconi, A., & Hunt, L. K. 2003, ApJ, 589, L21
- Marleau et al. (2007) Marleau, F. R., Fadda, D., Appleton, P. N., Noriega-Crespo, A., Im, M., & Clancy, D. 2007, ApJ, 663, 218
- Marshall et al. (2007) Marshall, J. A., Herter, T. L., Armus, L., Charmandaris, V., et al. 2007, ApJ, 670, 129
- Mason et al. (2001) Mason, K. O., et al. 2001, A&A, 365, L36
- Mazzarella & Boroson (1993) Mazzarella, J. M., & Boroson, T. A. 1993, ApJS, 85, 27
- Mazzarella et al. (1988) Mazzarella, J. M., Gaume, R. A., Aller, H. D., & Hughes, P. A. 1988, ApJ, 333, 168
- Mazzarella et al. (1991a) Mazzarella, J. M., Soifer, B. T., Graham, J. R., Neugebauer, G., Matthews, K., & Gaume, R. A. 1991a, AJ, 102, 1241
- Mazzarella et al. (1991b) Mazzarella, J. M., Bothun, G. D., & Boroson, T. A. 1991b, AJ, 101, 2034
- McCall (2004) McCall, M. L. 2004, AJ, 128, 2144
- Mihos (1999) Mihos, C. 1999, Ap&SS, 266, 195
- Mihos et al. (1998) Mihos, J. C., Dubinski, J., & Hernquist, L. 1998, ApJ, 494, 183
- Mihos & Bothun (1998) Mihos, J. C., & Bothun, G. D. 1998, ApJ, 500, 619
- Mihos & Hernquist (1996) Mihos, J. C., & Hernquist, L. 1996, ApJ, 464, 641
- Mirabel et al. (1998) Mirabel, I. F., et al. 1998, A&A, 333, L1
- Modica et al. (2012) Modica, F., Vavilkin, T., Evans, A. S., et al. 2012, AJ, 143, 16.
- Mould et al. (2000a) Mould, J. R., et al. 2000a, ApJ, 529, 786
- Mould et al. (2000b) Mould, J. R., et al. 2000b, ApJ, 545, 547
- Murphy et al. (1996) Murphy, T. W., Jr., Armus, L., Matthews, K., et al. 1996, AJ, 111, 1025
- Nagar et al. (2003) Nagar, N. M., Wilson, A. S., Falcke, H., et al. 2003, A&A, 409, 115
- Nagar et al. (2005) Nagar, N. M., Falcke, H., & Wilson, A. S. 2005, A&A, 435, 521
- Oesch et al. (2010) Oesch, P. A., Carollo, C. M., Feldmann, R., et al. 2010, ApJ, 714, L47
- Owen et al. (1985) Owen, F. N., O’Dea, C. P., Inoue, M., & Eilek, J. A. 1985, ApJ, 294, L85
- Peeters et al. (2002) Peeters, E., Hony, S., Van Kerckhoven, C., et al. 2002, A&A, 390, 1089
- Peeters et al. (2004) Peeters, E., Spoon, H. W. W., & Tielens, A. G. G. M. 2004, ApJ, 613, 986
- Peng et al. (2002) Peng, C. Y., Ho, L. C., Impey, C. D., & Rix, H.-W. 2002, AJ, 124, 266
- Petrosian, Saakian & Khachikian (1978) Petrosian, A. R., Saakian, K. A., & Khachikian, E. E. 1978, Astrofizika, 14, 69
- Petrosian, Saakian & Khachikian (1979) Petrosian, A. R., Saakian, K. A., & Khachikian, E. E. 1979, Astrofizika, 15, 209
- Petrosian, Saakian & Khachikian (1980) Petrosian, A. R., Saakian, K. A., & Khachikian, E. E. 1980, Astrofizika, 16, 621
- Ptak et al. (2003) Ptak, A., Heckman, T., Levenson, N. A., Weaver, K., & Strickland, D. 2003, ApJ, 592, 782
- Radford et al. (1991) Radford, S. J. E., Downes, D., & Solomon, P. M. 1991, ApJ, 368, L15
- Ramos Almeida et al. (2007) Ramos Almeida, C., Pérez García, A. M., Acosta-Pulido, J. A., & Rodríguez Espinosa, J. M. 2007, AJ, 134, 2006
- Rieke et al. (2004) Rieke, G. H., et al. 2004, ApJS, 154, 25
- Roche & Aitken (1984) Roche, P. F., & Aitken, D. K. 1984, MNRAS, 208, 481
- Rodriguez et al. (2006) Rodriguez, C., Taylor, G. B., Zavala, R. T., Peck, A. B., Pollack, L. K., & Romani, R. W. 2006, ApJ, 646, 49
- Risaliti et al. (2000) Risaliti, G., Gilli, R., Maiolino, R., & Salvati, M. 2000, A&A, 357, 13
- Rush et al. (1996) Rush, B., Malkan, M. A., & Edelson, R. A. 1996, ApJ, 473, 130
- Sanders et al. (1986) Sanders, D. B., Scoville, N. Z., Young, J. S., Soifer, B. T., et al. 1986, ApJ, 305, L45
- Sanders et al. (2003) Sanders, D. B., Mazzarella, J. M., Kim, D.-C., Surace, J. A., & Soifer, B. T. 2003, AJ, 126, 1607 (RBGS)
- Sanders & Mirabel (1996) Sanders, D. B. & Mirabel, I. F. 1996, ARA&A, 34, 749
- Sanders et al. (1988a) Sanders, D. B., Soifer, B. T., Elias, J. H., et al. 1988a, ApJ, 325, 74
- Sanders et al. (1988b) Sanders, D. B., Soifer, B. T., Elias, J. H., et al. 1988b, ApJ, 328, L35
- Sanders et al. (1991) Sanders, D. B., Scoville, N. Z., & Soifer, B. T. 1991, ApJ, 370, 158
- Schlegel et al. (1998) Schlegel, D. J., Finkbeiner, D. P., & Davis, M. 1998, ApJ, 500, 525
- Schweizer (2000) Schweizer, F. 2000, Royal Society of London Philosophical Transactions Series A, 358, 2063
- Schweizer & Seitzer (2007) Schweizer, F., & Seitzer, P. 2007, AJ, 133, 2132
- Skrutskie et al. (2006) Skrutskie, M. F., et al. 2006, AJ, 131, 1163
- Smith et al. (2007) Smith, J. D. T., et al. 2007, PASP, 119, 1133
- Smith et al. (2007) Smith, J. D. T., Draine, B. T., Dale, D. A. et al. 2007, ApJ, 656, 770
- Solomon & Vanden Bout (2005) Solomon, P. M., & Vanden Bout, P. A. 2005, ARA&A, 43, 677
- Spoon et al. (2004) Spoon, H. W. W., et al. 2004, ApJS, 154, 184
- Spoon et al. (2007) Spoon, H. W. W., et al. 2007, ApJ, 654, L49
- Stickel et al. (2004) Stickel, M., Lemke, D., Klaas, U., et al. 2004, A&A, 422, 39
- Sturm et al. (2006) Sturm, E., et al. 2006, ApJ, 653, L13
- Su et al. (2004) Su, K. Y. L., et al. 2004, ApJS, 154, 302
- Surace et al. (1998) Surace, J. A., Sanders, D. B., Vacca, W. D., Veilleux, S., & Mazzarella, J. M. 1998, ApJ, 492, 116
- Tacconi et al. (1999) Tacconi, L. J., et al. 1999, Ap&SS, 266, 157
- Tadhunter (2008) Tadhunter, C. 2008, New Astronomy Review, 52, 227
- Thean et al. (2001) Thean, A. H. C., Gillibrand, T. I., Pedlar, A., & Kukula, M. J. 2001, MNRAS, 327, 369
- Thompson et al. (2005) Thompson, T. A., Quataert, E., & Murray, N. 2005, ApJ, 630, 167
- U et al. (2011) U, Vivian et al. 2011, AJ, submitted
- Ueda et al. (2005) Ueda, Y., Ishisaki, Y., Takahashi, T., et al. 2005, ApJS, 161, 185
- van der Hulst & Hummel (1985) van der Hulst, J. M., & Hummel, E. 1985, A&A, 150, L7
- Veilleux et al. (1995) Veilleux, S., Kim, D.-C., Sanders, D. B., Mazzarella, J. M., & Soifer, B. T. 1995, ApJS, 98, 171
- Veilleux et al. (1999) Veilleux, S., Kim, D.-C., & Sanders, D. B. 1999, ApJ, 522, 113
- Veilleux et al. (2005) Veilleux, S., Cecil, G., & Bland-Hawthorn, J. 2005, ARA&A, 43, 769
- Veilleux (2006) Veilleux, S. 2006, New Astronomy Review, 50, 701
- Veilleux et al. (2009) Veilleux, S., et al. 2009, ApJS, 182, 628
- Wang et al. (1997) Wang, J., Heckman, T. M., Weaver, K. A., & Armus, L. 1997, ApJ, 474, 659
- Watabe et al. (2008) Watabe, Y., Kawakatu, N., & Imanishi, M. 2008, ApJ, 677, 895
- Whitmore et al. (2007) Whitmore, B. C., Chandar, R., & Fall, S. M. 2007, AJ, 133, 1067
- Whitmore et al. (1999) Whitmore, B. C., Zhang, Q., et al. 1999, AJ, 118, 1551
- Whitmore et al. (2010) Whitmore, B. C., et al. 2010, AJ, 140, 75
- Wrobel & Laor (2009) Wrobel, J. M., & Laor, A. 2009, ApJ, 699, L22
- Xu et al. (2010) Xu, C. K., Domingue, D., Cheng, Y-W, et al. 2010, ApJ, 713. 330
- Young et al. (1986) Young, J. S., Schloerb, F. P., Kenney, J. D., & Lord, S. D. 1986, ApJ, 304, 443
- Yuan et al. (2010) Yuan, T.-T., Kewley, L. J., & Sanders, D. B. 2010, ApJ, 709, 884
- Yun et al. (2001) Yun, M. S., Reddy, N. A., & Condon, J. J. 2001, ApJ, 554, 803
- Yun et al. (1994) Yun, M. S., Scoville, N. Z., & Knop, R. A. 1994, ApJ, 430, L109
- Zhu et al. (2003) Zhu, M., Seaquist, E. R., & Kuno, N. 2003, ApJ, 588, 243
- Zhu et al. (2007) Zhu, M., Gao, Y., Seaquist, E. R., & Dunne, L. 2007, AJ, 134, 118