Present address: ]Medical Center, University of Mississippi, Mississippi 39213 Present address: ]SMPS Inc, 417 4th street, Marysville, California 95901 Present address: ] Department of Physics, University of Notre Dame, Indiana 46556 Present address: ]Paul Scherrer Institut, Villigen, Switzerland Present address: ]Helmholtz-Zentrum Dresden-Rossendorf, 01314 Dresden, Germany Present address: ]INFN, Sezione di Catania, I-95123 Catania, Italy Present address: ]Institute of Modern Physics, CAS, Lanzhou 730000, People’s Republic of China
Isospin observables from fragment energy spectra
Abstract
The energy spectra of light charged particles and intermediate mass fragments from 112Sn+112Sn and 124Sn+124Sn collisions at an incident energy of E/A=50 MeV have been measured with a large array of Silicon strip detectors. We used charged particle multiplicities detected in an array with nearly 4 coverage to select data from the central collision events. We study isospin observables analogous to ratios of neutron and proton spectra, including double ratios and yield ratios of t/3He and of asymmetries constructed from fragments with Z=3-8. Using the energy spectra, we can construct these observables as functions of kinetic energy. Most of the fragment asymmetry observables have a large sensitivity to sequential decays.
pacs:
Valid PACS appear hereI Introduction
The nuclear Equation of State (EOS) describes the relation between pressure, density, temperature, and isospin asymmetry for infinite nuclear matter. The EOS has direct implications for fundamental properties of nuclei such as nuclear masses as well as the dynamics in nuclear collisions. It also affects properties of exotic astrophysical objects such as the evolution of supernovae and neutron stars. For aspects of objects with a large neutron excess, such as the crust of neutron stars and the neutron skin of Pb nuclei, understanding the EOS of asymmetric matter is very important.
Theoretical studies have shown that the EOS of asymmetric nuclear matter can be approximately expressed as Li et al. (1997, 2008):
| (1) |
where = is the baryon density, =()/() is the relative neutron excess or asymmetry of the system, and E(, ) is the energy per particle in symmetric nuclear matter. Significant constraints have already been placed on E(, ) at high densities Danielewicz et al. (2002). The bulk symmetry energy is denoted by S(). Its value at normal density, , is known to be in the range of 27-36 MeV Dutra et al. (2012).
Different density dependences of S(), which describes the sensitivity of the EOS to the difference between neutron and proton densities, depend on the nuclear forces used in the calculations Dutra et al. (2012). The experimental constraint on the isospin asymmetry term of the EOS has been poorly determined until recently Tsang et al. (2009); Tsang et al. (2012a). Better knowledge of this term is essential to understand the binding energy Myers and Swiatecki (1969) and the difference between neutron and proton radii in neutron-rich nuclei Brown (2000); Piekarewicz (2004); Tsang et al. (2012b) as well as the internal structure of neutron stars Pethick and Ravenhall (1995); Lattimer and Prakash (2001).
Since the isospin-dependent mean fields are opposite in sign for neutrons and protons, the reaction dynamics of neutrons and protons are affected differently, which leads to possible differences in their yields and energy spectra. The most natural observable to extract information about the asymmetry term of the nuclear EOS in Heavy Ion Collisions Li et al. (2008) is the measurement of emitted neutron and proton spectra. Given the difficulties in extracting good quality neutron spectra Famiano et al. (2006), alternative observables have been suggested including the ratios of mirror charged isotopes such as t/3He Xu et al. (2000); Geraci et al. (2004) or 7Li/7Be pairs and general N/Z Liu et al. (2004); Das et al. (2005); Baran et al. (2002) ratios of the emitted fragment isotopes.
This paper focuses on complementary information to the neutron to proton ratios, using isospin observables constructed from the energy spectra of fragments of the Z=1 to 8 isotopes produced in Sn+Sn collisions. We report a complete overview of measurements of fragment kinetic energies and yield ratios with particular attention to how the N/Z degree of freedom can play a key role in the dynamics of the studied reaction systems. Due to conflicting interpretations of the data obtained from different transport codes, the main goal of this paper is not to compare the data to calculations. Rather, our goal is to describe how the data are obtained, what observables have been measured in the central collisions of Sn isotopes at incident energy of 50 MeV per nucleon, and whether these observables are affected by secondary decays.
We describe the experimental set up in the next Section. Determination of the impact parameters of the Sn+Sn collisions using charged particle multiplicities is described in detail in Section III. For the analysis shown in subsequent sections, a reduced impact parameter cutoff of is chosen for central 112Sn+112Sn and 124Sn+124Sn collisions. In Section IV the fragment energy spectra and mean measured energies of isotopes of all elements up to Z=8 are examined. Section V compares t/3He yield ratios for the two symmetric Sn collision systems and contrasts the data with n/p ratios from a previous experiment Famiano et al. (2006). The average asymmetry N/Z and N/Z constructed from fragments (from Z=3 to Z=8) of each system are examined in Section VI; here we note a difference in the N/Z distributions of the two Sn systems when isotopes of Be are either included or omitted. The findings are summarized in Section VII.
II Experimental Setup
The experiment was performed at the National Superconducting Cyclotron Laboratory at Michigan State University with beams from the K1200 cyclotron. 112Sn+112Sn, 124Sn+112Sn, 112Sn+124Sn, and 124Sn+124Sn collisions were measured by using 50 MeV per nucleon 112Sn and 124Sn beams impinging on 5 mg/cm2 112Sn and 124Sn targets. For central collisions, the results from the two mixed systems, 124Sn+112Sn and 112Sn+124Sn, are similar and the properties of the yields and energy spectra can be interpolated from the heavy 124Sn+124Sn and light 112Sn+112Sn reactions. Unless specified otherwise, only results from the measurements of the symmetric Sn+Sn systems are discussed in this paper.
Isotopically resolved particles with were measured with the Large Area Silicon Strip Detector Array (LASSA) Davin et al. (2001); Wagner et al. (2001), an array consisting of nine telescopes, each comprised of one 65 m thick and one 500 m thick Si strip detector, followed by four 60 mm thick CsI(Tl) detectors. The 5050 mm2 area of each LASSA telescope is divided by the strips of the second silicon detector into 256 (33 mm2) square pixels, providing an angular resolution of about 0.43∘. The LASSA was centered at a polar angle of with respect to the beam axis, providing coverage at polar angles of . At other angles, charged particles were detected in 188 plastic scintillator - CsI(Tl) detectors of the Michigan State University Miniball and Washington University Miniwall array de Souza et al. (1990); Stracener et al. (1990), which together subtended a range of polar angles of . The Miniball/Miniwall array provided isotopic resolution for H and He nuclei and elemental resolution for intermediate mass fragments (IMF’s) with . The total charged particle multiplicity detected in the two arrays was used for impact parameter determination.
III Impact Parameter Determination
The impact parameter, , of a nucleus-nucleus collision is the distance between the classical straight-line trajectories describing the initial velocities of the two nuclei before their collision. The outcome of a collision depends strongly on the impact parameter; the two nuclei will be violently disrupted for but essentially undisturbed for . This phenomenon is explained by a simple picture wherein the charged particle multiplicity depends on the energy transferred from the relative motion of the nuclei to the internal degrees of freedom in the region where the projectile and target overlap. More charged particles will be emitted in central collisions with a stronger overlap than in peripheral collisions.
Based on the assumption that charged particles decrease monotonously with impact parameter multiplicity, a reduced impact parameter, or , can be calculated from the charged particle multiplicity. The reduced impact parameter, first suggested in ref. Cavata et al. (1990), can be written as:
| (2) |
where is the charged particle multiplicity corresponding to . Here is the relative frequency of events detected with the charged particle multiplicity equal to , and is the average impact parameter corresponding to data taken with minimum bias multiplicity Phair et al. (1992); Kim et al. (1992). The accuracy of this relationship depends on two assumptions: First, the nucleus-nucleus cross section can be well approximated by the geometrical cross section: . This is more precise at relativistic bombarding energies where the multiplicities are larger Cavata et al. (1990) than at a lower bombarding energy of E/A=50 MeV. Eq. 2 is also more precise when one assumes a monotonic correlation between multiplicity and impact parameter without dispersion. At lower energies of E/A50 MeV, however, non-negligible fluctuations in the charged particle multiplicity are expected even for collisions of well-defined impact parameter. Keeping these concerns in mind, we use Eq. 2 and group the events into distinct different bins corresponding to “central”, “mid-central” and “peripheral” collisions Liu (2005). In the following discussions, a central collision bin corresponding to is applied to the data.
In our analysis, the charged particle multiplicity, , consists of all the charged particles detected in the Miniball/Miniwall array and LASSA telescopes. Those detected charged particles not only include the identified particles but also unidentified particles. For the Miniball/Miniwall array, such unidentified particles include heavy fragments that stop in the fast plastic and light particles that punch through the CsI(Tl) crystals. For LASSA telescopes, the unidentified particles include heavy particles that stop in the silicon detectors, light particles that punch through the CsI(Tl), and particles that hit in the gaps between the CsI(Tl) detectors.
In Fig. 1, the probability distributions of the charged particle multiplicity as well as the reduced impact parameters are shown for 112Sn+112Sn (left panels) and 124Sn+124Sn (right panels) reactions. The probability distribution of (top panels) are rather flat between and . For higher , the probability decreases exponentially. Even though the minimum bias data was taken at , we notice that data with (open points in the upper panels) suffer efficiency problems as evidenced by the sharp drop of the probability in the distributions of low . Unlike previous studies published on this experiment Liu et al. (2007), we choose as the minimum trigger. Since is calculated using a partial sum from , it can be calculated independently from where the minimum lies.

The bottom panels of Fig. 1 show the reduced impact parameter (closed squares) calculated from the procedure described in Eq. 2. From we obtained the impact parameter using values for obtained from the measured geometric cross section for events with . The cross section for was calculated using the relationship
| (3) |
where is the number of events with , is the number of beam particles, and is the number of target nuclei per unit surface area. Here, was determined to 5% accuracy from measuring the mass and area of the target. The number of events was measured precisely by the Miniball/Miniwall array and LASSA telescopes with statistical uncertainty. The number of beam particles, , was determined from the measured beam current in the Faraday cup at the end of the beam line. Due to the extremely small beam intensities used in this measurement, there may be a systematic uncertainty in the determination of the beam current. Direct counting of the beam particles with a plastic scintillator would be preferable and would provide the desired precision of a few percent at low beam intensities.
We obtained values of =7.51.6 fm for the 112Sn+112Sn reaction and =7.01.4 fm for the 124Sn+124Sn reaction. Given the experimental uncertainties in determining the absolute impact parameter, we assume =7.25 fm for both reactions. In contrast to the uncertainties associated with the absolute values for , information based on the reduced impact parameter, , does not suffer from such uncertainties, but it does depend on the acceptance of the detection apparatus.
IV Fragment Energy Spectra
In this section, we present isotopically resolved energy spectra for fragments emitted at center of mass angles of in central collisions. At these angles, the coverage of the LASSA array is excellent. However, there was no detector coverage at small laboratory angles of which correspond to low energy particles of less than 0.2 MeV per nucleon in the center of mass frame. We estimated the small contributions of these low energy particles. We also remove background counts that arise from particles passing out of the active regions of the telescope without being properly identified and corrected for coincidence summing of two or more particles detected within a single CsI(Tl) crystal Liu (2005).
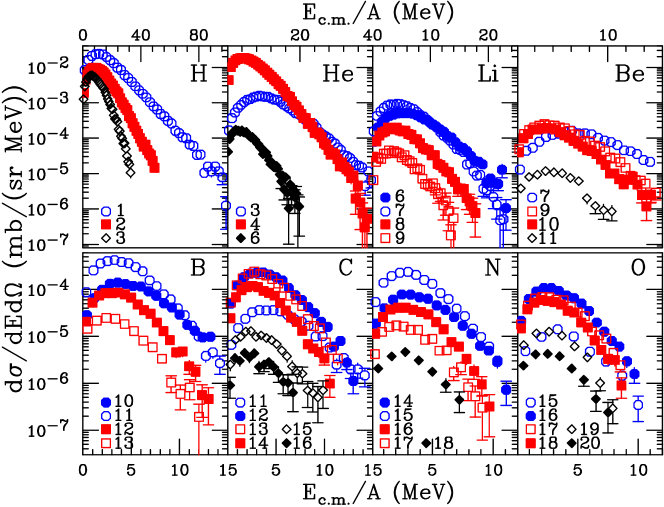
The center of mass energy spectra for isotopes from hydrogen to oxygen emitted in the 112Sn+112Sn reactions are plotted in Fig. 2. Except in the regions at high energies where statistics are poor, the energy spectra are very smooth. The loss of low energy particles due to lack of coverage at very forward angles is almost negligible. In general, the energy spectra drop exponentially with energy and the fragment cross sections drop with increasing charge. The high energy tails of the hydrogen isotopes are truncated due to the 6 cm length of the CsI(Tl) crystals of the LASSA device. The shapes of the corresponding energy spectra for the other Sn+Sn reactions are rather similar and are therefore not shown here.
In Fig. 3 the measured mean energies of the isotopes are shown as a function of the mass number A. All the even Z (Z=2, 4, 6, 8) elements are represented by closed symbols and the odd Z (Z=1, 3, 5, 7) elements by open symbols. (The isotope mean energies for the 112Sn+112Sn reaction, with the exception of 15O, have been published previously Liu et al. (2006).) There is an overall trend of increasing with A. However, the proton-rich (NZ) isotopes display significantly higher kinetic energies than the neutron-rich isotopes, meaning that that the energy spectra for these lighter isotopes have relatively smaller yields near the Coulomb barrier and larger yield at higher energies, leading to a higher apparent spectral temperature. The observation is consistent with the “3He-4He puzzle” Gutbrod et al. (1976); Renshaw et al. (1991); Neubert and Botvina (2000) where the mean kinetic energy of 3He is observed to be anomalously higher than that of 4He.
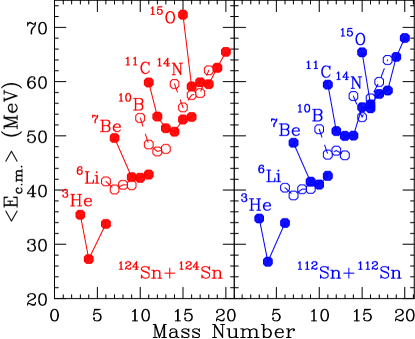
In our data, this “anomalous energy puzzle” extends beyond helium isotopes, up to oxygen. This trend is contrary to the behavior one would expect for emission from a single equilibrated source, where the mean kinetic energies of fragments are expected to increase with mass Liu et al. (2006). The higher kinetic energies of the lighter proton-rich isotopes has been quantitatively explained within the statistical Expanding Emitting Source model Friedman (1990) as a consequence of the low binding energies of the most proton-rich isotopes, such as 3He, 7Be, 10B, 11C and 15O, and the resulting large separation energies for these fragments from the emitting system Liu et al. (2006); Xi et al. (1998). In these calculations, the large separation energies for these proton-rich fragments hinder their emission at later stages in the decay after the emitting system has expanded and cooled by expansion and emission Liu et al. (2006); Xi et al. (1998). The difference between the slopes of weakly bound proton-rich isotopes and their heavier counterparts has been used to extract the cooling curve or freeze-out temperature of hot multi-fragmenting systems Xi et al. (1998); Wang et al. (2005). Fig. 3 shows how this effect influences the total yields for 2Z8 fragments in 112Sn+112Sn (right panel), and 124Sn+124Sn (left panel) reactions. This appears to be a general trend, similarly exhibited by the other two reactions, 124Sn +112Sn and 112Sn+124Sn.
V t/3He ratios
The nuclear symmetry energy has contributions from both kinetic and potential energy. Both reduce the binding energy of systems with either neutron or proton excess. In the mean field limit, this implies that the poorly constrained symmetry mean field potential in a neutron-rich system should be repulsive to neutrons and attractive for protons. One expects, theoretically, that comparisons of neutron and proton observables such as the ratios of neutron and proton energy spectra should give direct information about the corresponding symmetry forces. However, measurements of neutron energies are difficult, requiring time of flight measurements with large, low efficiency scintillation arrays. In the limit of the coalescence approximation, the ratios of triton and 3He spectra would give information similar to that of the n/p measurements Chen et al. (2003); Kohley et al. (2011). Experimentally, it is much more preferable to detect charged particles such as triton and 3He. Even though the present experiment was not designed to optimize the detection of t/3He yield ratios, the data nonetheless can be used to provide insights on future studies aimed to understand these ratios as they have been proposed as a probe to study the density dependence of symmetry energy Li et al. (2008); Chen et al. (2003); Kohley et al. (2011).
In Fig. 4 the center of mass energy spectra are shown for tritons (open and closed circles) and 3He (open and closed squares) emitted in central collisions (). The solid symbols correspond to particles emitted in the neutron-rich 124Sn+124Sn collisions while the open symbols correspond to particles emitted in the neutron-deficient 112Sn+112Sn collisions. More triton particles, which are neutron-rich, are emitted from the 124Sn+124Sn reaction as expected. Similarly, more 3He particles, which are neutron-deficient, are emitted from the 112Sn+112Sn collisions. The shapes of the energy spectra for t and 3He are quite different especially near the Coulomb barrier. As the charge of 3He is twice that of 3H, the Coulomb barrier for 3He is higher than for 3H. This is clearly visible in Fig. 4, which shows that the maxima of the 3He energy spectra are shifted towards larger values.
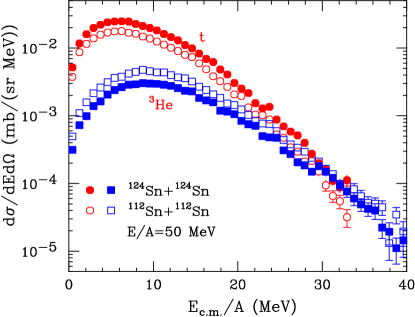
For each isotope, the magnitudes of the differential multiplicities are reaction-dependent, but the shapes of the energy spectra from the 124Sn+124Sn (closed symbols) and 112Sn+112Sn (open symbols) reactions are rather similar. Such similarities are also observed in all the isotopes measured in this work as well as in the 7Li and 7Be spectra measured at E/A=35 MeV incident energy Sun et al. (2010).
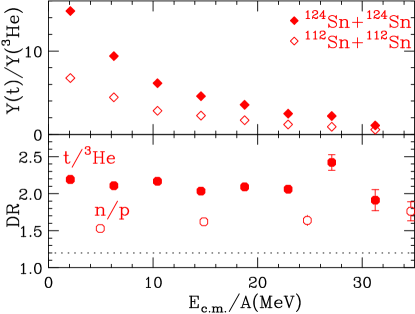
Ratios of spectra can probe the isospin dependence with more sensitivity. The top panel of Fig. 5 shows the yield ratios Y(t)/Y(3He) as a function of kinetic energy per nucleon for 124Sn+124Sn (solid diamonds) and 112Sn+112Sn (open diamonds). As expected, the ratios are larger for the neutron-rich system, 124Sn+124Sn. In both reactions, the Y(t)/Y(3He) ratios decrease rapidly with increasing kinetic energy. This is partly due to the different Coulomb barriers of the 3He and 3H affecting their energy spectra.
Since Sn isotopes are used in both collision systems, the influence of the Coulomb force on the ratios of t/3He spectra should be similar. However, we see a more rapid drop in the single yield ratios obtained from the neutron-rich system of 124Sn+124Sn (solid diamonds) than those obtained from the 112Sn+112Sn system (open diamonds). In a thermal picture, this indicates a larger value of the neutron chemical potential and a smaller value of the proton chemical potential in the neutron-rich 124Sn+124Sn system than in the proton-rich 112Sn+112Sn system. This is qualitatively consistent with effects expected from the symmetry mean field potential.
Similar trends are observed in t/3He ratios obtained in 48Ca+48Ca and 40Ca+40Ca systems at E/A = 80 MeV Chajecki (2012). The large yield ratios at low kinetic energy are larger than the typical values from Boltzmann-Uehling-Uhlenbeck (BUU) models Chen et al. (2003); Li et al. (2008) and values currently predicted by Improved Quantum Molecular Dynamical (ImQMD) model Chajecki (2012). There is no definitive explanation why the large differences in the t/3He yield ratios are not reproduced by transport model, but it may reflect the influence of cluster production. In a hybrid BUU-cluster production approach, Sobotka et al. showed that the inclusion of alpha particles in the exit channel leads to an enhanced asymmetry of the lighter nucleons and clusters such as t and 3He Sobotka et al. (1997). In a similar vein, Natowitz et al. have demonstrated that clusters, such as alpha particles, in the exit channel effectively increase the average symmetry energy in the final state, which will lead to an enhanced contribution of the symmetry potential to the effective chemical potentials that define the ratios of mirror nuclear yield such as t/3He Natowitz et al. (2010). Clearly, the description of cluster production requires more attention to understand the role it plays in such effects.
Following the methodology employed to study the neutron/proton yield ratios in ref. Famiano et al. (2006), a double ratio is constructed as DR(t/3He)= (t/3He)A /(t/3He)B, where A=124Sn+124Sn and B=112Sn+112Sn, and is shown as the solid circles in the bottom panel of Fig. 5. Over the regions with data, up to E/A=30 MeV, the double ratios are relatively flat, with values around 2.1. The experimental values are much larger than the no sensitivity limit at 1.2 dictated by conservation laws.
For completeness, the double ratios DR(n/p) values from ref. Famiano et al. (2006) are shown as open circles in the lower panel of Fig. 5. Interestingly, the DR(t/3He) values are larger than the DR(n/p) values at Ec.m./A30 MeV. This may reflect the large contributions of secondary decay to the neutron and proton spectra at low energies. Study of the n/p ratios using the ImQMD model suggests that to avoid clustering effects, one should use data at higher energies E25 MeV Zhang et al. (2008). Unfortunately the energy spectra for t and 3He clusters drop off exponentially and there are very few statistics beyond 30 MeV per nucleon as shown in the energy spectra. To obtain t and 3He data beyond Ec.m./A=30 MeV, one would need to perform experiments for much longer time, with greater angular coverage, or at much higher incident energy. The differences in the DR(n/p) and DR(t/3He) ratios suggest that the yield ratios of mirror nuclei such as t/3He cannot be equated to the neutron/proton yield ratios without theoretical understandings of cluster formation and reaction dynamics, as well as their dependence on symmetry energy.
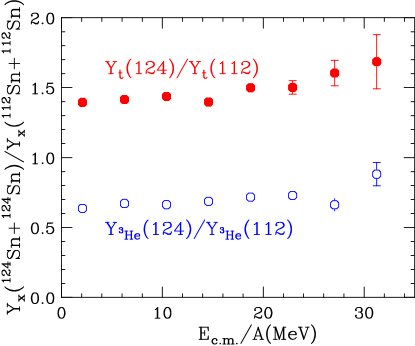
To reduce the uncertainty due to the Coulomb and other pre-equilibrium effects and due to the possible efficiency problems in detecting different particles, we plot the yield ratios of an isotope from the two different reactions (124Sn+124Sn, 112Sn+112Sn) instead of plotting the mirror ratios for single reactions. The triton yield ratios (solid circles) and 3He yield ratios (open circles) are shown in Fig. 6. The average values of the triton ratios are 1.5; one expects that the neutron-rich tritons would be emitted in greater quantities from the neutron-rich 124Sn+124Sn reaction system. The opposite is true for the neutron-deficient 3He isotopes, which have ratio values around 0.7.
Both ratios seem to increase slightly with energy. Whether this continues to higher Ec.m. cannot be answered with this data set, but could be more easily explored in experiments at higher incident energies. The corresponding ratios for the neutron-rich nuclei of (N-Z)=1 isotopes such as 7Li, 11B and 15N (not shown) are nearly the same at around 1.1, slightly lower than the values for triton ratios shown in Fig. 6. For the corresponding neutron-deficient mirror isotopes of (N-Z) = -1 such as 7Be, 11C and 15O (not shown) the measured ratios are around 0.6, similar to the 3He ratios. The observation of constant ratios is consistent with isoscaling Geraci et al. (2004); Tsang et al. (2001). The measured energy spectra of these heavy fragments do not extend much beyond E/A=12 MeV. Thus they do not shed light on the trend of the ratios as a function of energy or in the high energy region where the results can be better compared to the free neutron or proton observables.
VI fragment asymmetry
More recently the average asymmetry, , values of fragments of a given Z have been proposed as observables that are complementary to the free nucleon yield ratios of Y(n)/Y(p) in providing information about symmetry energy Colonna et al. (2008). This quantity is calculated as a weighted sum over yields measured in the angular domain as follows:
| (4) |
Here, is the yield of fragments of charge Z and neutron number observed experimentally in this angular domain. Some of the results shown in Fig. 7 have been published in Das et al. (2005); Liu et al. (2004). We include a more thorough discussion on this observable for completeness in view of the next new asymmetry observable, N/Z, and to reexamine its virtues and limitations in placing constraints on the symmetry energy.
The average asymmetry is shown in Fig. 7 as a function of the fragment charge number Z. As expected, the values are larger for the more neutron-rich system (solid circles). However, the observed values of the fragments for the neutron-rich system are much lower than the initial N/Z value of the projectile and target, =1.48 (solid horizontal line near the top of the figure). For the neutron-deficient system, the fragment values (open circles) lie much closer to the value of 1.24 (dashed horizontal line). The observed trends can be explained in statistical fragmentation models that include sequential decays Das et al. (2005).
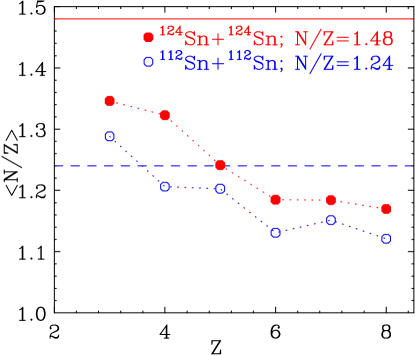
Since the energy spectra are exponential in shape, the values mostly reflect the N/Z values of the low-energy fragments. The general trend of the N/Z values is similar for the two reactions except for Z=4. Because 8Be is unstable and decays into two alpha particles, it is not detected in the experiment. The effect of 8Be will be discussed in more detail later in this section.
In a recent study using the Stochastic Mean Field (SMF) model, Colonna et al. simulated the Sn reactions studied here and suggested the construction of the observable N/Z as a function of the fragment kinetic energies as an observable to study isospin effects and the symmetry energy in heavy ion collisions Colonna et al. (2008). Technically, N/Z is computed as follows:
| (5) |
Here, is the yield of fragments of charge and neutron number observed in this angular domain experimentally. Note that this is equivalent to Eq. 4 in the case when only one element is included in the sums.
The effects of unstable nuclei produced as the primary fragments can be illustrated using the case of Be. In Fig. 8, the N/Z values of the individual elements are plotted as a function of the kinetic energy per nucleon in the center of mass frame. The N/Z values for all elements decrease with kinetic energy. The trends exhibited by the elements are similar except for Be. This reflects the fact that 8Be decays were not included in the measured observable. (In principle, one can identify 8Be but this was not done because the current experiment was not designed to detect 8Be.) Other elements have particle unstable ground and excited state nuclei, but Be is unique in that the N=Z isotope 8Be is strongly produced and strongly fed by secondary decay, but is unstable. Thus, the energy dependence of N/Z drops much more rapidly for Z=4 fragments than for the other elements. The same phenomenon is observed both in 112Sn+112Sn (left panel) and 124Sn+124Sn (right panel) systems. However, the drop is steeper for the 112Sn+112Sn reaction.
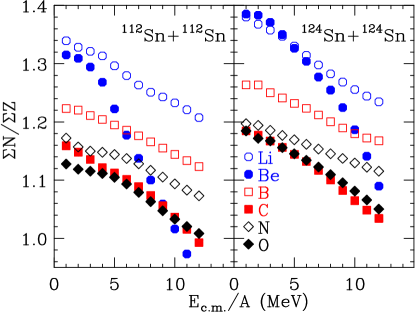
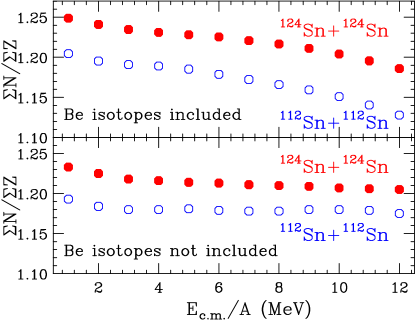
Fig. 9 shows N/Z as a function of the kinetic energy per nucleon for the 124Sn+124Sn (closed circles) and 112Sn+112Sn (open circles) systems. Here, all of the observed isotopes with have been included. As expected, the fragment N/Z values are higher for the neutron-rich 124Sn+124Sn system, but the overall effect is rather small at about 4% higher than the neutron-deficient 112Sn+112Sn system. Furthermore, the trends of the ratios are very sensitive to whether Be isotopes are included in the construction of N/Z, especially at high center of mass energies. When experimentally-measured Be isotopes are included as shown in the top panel, both ratios decrease with energy. However, when Be isotopes are excluded as shown in the bottom panel, N/Z ratios are nearly flat as a function of energy.

Double ratios have been used in comparisons of neutron and proton spectra to remove the influence of effects such as inefficiencies in neutron detection Famiano et al. (2006), so it is natural to explore whether double ratios could correct for the inefficiency in 8Be detection. Unfortunately, it appears that the double ratios, DR(N/Z)=(N/Z)A/(N/Z)B, where A=124Sn+124Sn and B=112Sn+112Sn, are rather sensitive to the inclusion of the Be isotopes. The top panel of Fig. 10 shows that the experimental double ratios increase with the kinetic energy beyond E/A4 MeV when detected Be isotopes are included in the analysis. This increasing trend changes to a slightly decreasing trend when the Be isotopes are excluded (bottom panel). Thus, one needs to accurately model the secondary decay of the isotopically-resolved fragments quantitatively to reproduce the isospin effects of either the single ratios N/Z or the double ratios DR(N/Z)=(N/Z)A/(N/Z)B at the level of a few percent in order to constrain the density dependence of the symmetry energy using this observable. At present, DR(N/Z) predicted by transport calculations depends on the secondary decay models Colonna et al. (2008) and will need much more developmental work on sequential decays before this observable can be used to extract information about symmetry energy.
VII summary
In summary, we have measured the energy spectra of emitted charged particles from Z=1 to Z=8 in central collisions of Sn isotopes at E/A=50 MeV incident energy. The average kinetic energies of the proton-rich as well as N=Z isotopes such as 3He, 7Be, 10B, 11C, 14N, and 15O are higher than those of their corresponding neutron-rich isotopes, an effect often described as the “3He puzzle”. We note that this trend has been quantitatively reproduced by the statistical Expanding Emitting Source model, where it was shown to stem from the suppression of the emission of weakly bound proton-rich isotopes during the later stages of the decay after the system has expanded and cooled. We construct yield ratios such as Y(t)/Y(3He) as a function of kinetic energy. These ratios are not the same as the Y(n)/Y(p) at low kinetic energy, E/A25 MeV. To minimize the contributions from Coulomb effects, sequential decays, and cluster formation, measurements of the fragment observables with higher statistical accuracies from reactions at higher incident are desirable. The results at high kinetic energies are needed to determine if Y(t)/Y(3He) can indeed be used to substitute Y(n)/Y(p) in the study of the sensitivity to symmetry energy. We also explore average asymetry, , ratios constructed from intermediate mass fragments. Sequential decays tend to push the values from very asymmetric systems closer to each other and further from the initial N/Z values of the composite system formed by the projectile and target. The small measured values coupled with the importance of sequential decays in as well as N/Z suggest that more theoretical study is needed to understand these observables and accurate sequential decay models be developed before they can be employed to constrain the density dependence of symmetry energy.
Acknowledgement
This work has been supported by the U.S. National Science Foundation under Grants PHY 060007 (MSU) and the Department of Energy under grant numbers DE-FG02-87ER-40316 (WU) and DE-FG02-88ER-40404 (IU).
References
- Li et al. (1997) B. A. Li, C. M. Ko, and Z. Z. Ren, Phys. Rev. Lett. 78, 1644 (1997).
- Li et al. (2008) B.-A. Li, L.-W. Chen, and C. M. Ko, Physics Reports 464, 113 (2008), and references therein.
- Danielewicz et al. (2002) P. Danielewicz, R. Lacey, and W. G. Lynch, Science 298, 1592 (2002).
- Dutra et al. (2012) M. Dutra, O. Lourenco, J. S. Sa Martins, A. Delfino, J. R. Stone, and P. D. Stevenson, Phys. Rev. C 85, 035201 (2012).
- Tsang et al. (2009) M. B. Tsang, Y. Zhang, P. Danielewicz, M. Famiano, Z. Li, W. G. Lynch, and A. W. Steiner, Phys. Rev. Lett. 102, 122701 (2009).
- Tsang et al. (2012a) M. B. Tsang et al., Phys. Rev. C 86, 015803 (2012a).
- Myers and Swiatecki (1969) W. D. Myers and W. J. Swiatecki, Annals of Physics 55, 395 (1969).
- Brown (2000) B. A. Brown, Phys. Rev. Lett. 85, 5296 (2000).
- Piekarewicz (2004) J. Piekarewicz, Phys. Rev. C 69, 041301 (2004).
- Tsang et al. (2012b) M. B. Tsang et al., arXiv 1204.0466 (2012b).
- Pethick and Ravenhall (1995) C. J. Pethick and D. G. Ravenhall, Annu. Rev. Nucl. Part. Sci. 45, 429 (1995).
- Lattimer and Prakash (2001) J. M. Lattimer and M. Prakash, Astro. Phys. J 550, 426 (2001).
- Famiano et al. (2006) M. A. Famiano et al., Phys. Rev. Lett. 97, 052701 (2006).
- Xu et al. (2000) H. S. Xu et al., Phys. Rev. Lett. 85, 716 (2000).
- Geraci et al. (2004) E. Geraci et al., Nucl. Phys. A 732, 173 (2004).
- Liu et al. (2004) T. X. Liu et al., Phys. Rev. C 69, 014603 (2004).
- Das et al. (2005) C. B. Das, S. Das Gupta, W. G. Lynch, A. Z. Mekjian, and M. B. Tsang, Phys. Rep. 406, 1 (2005).
- Baran et al. (2002) V. Baran, M. Colonna, M. Di Toro, V. Greco, M. Zielinska-Pfabe, and H. H. Wolter, Nucl. Phys. A 703, 603 (2002).
- Davin et al. (2001) B. Davin et al., Nucl. Instrum. Methods Phys. Res. A 473, 302 (2001).
- Wagner et al. (2001) A. Wagner et al., Nucl. Instrum. Methods Phys. Res. A 456, 290 (2001).
- de Souza et al. (1990) R. T. de Souza et al., Nucl. Instrum. Methods Phys. Res. A 295, 109 (1990).
- Stracener et al. (1990) D. W. Stracener, D. G. Sarantites, L. G. Sobotka, J. Elson, J. T. Hood, Z. Majka, V. Abenante, A. Chbihi, and C. Hensl, Nucl. Instrum. Methods Phys. Res. A 294, 485 (1990).
- Cavata et al. (1990) C. Cavata, M. Demoulins, J. Gosset, M. C. Lemaire, D. L’Hôte, J. Poitou, and O. Valette, Phys. Rev. C 42, 1760 (1990).
- Phair et al. (1992) L. Phair et al., Nucl. Phys. A 548, 489 (1992).
- Kim et al. (1992) Y. D. Kim et al., Phys. Rev. C 45, 338 (1992).
- Liu (2005) T. X. Liu, Ph.D. thesis, Michigan State University (2005).
- Liu et al. (2007) T. X. Liu et al., Phys. Rev. C 76, 034603 (2007).
- Liu et al. (2006) T. X. Liu et al., Euro. Phys. Lett. 74, 806 (2006).
- Gutbrod et al. (1976) H. H. Gutbrod, A. Sandoval, P. J. Johansen, A. M. Poskanzer, J. Gosset, W. G. Meyer, G. D. Westfall, and R. Stock, Phys. Rev. Lett. 37, 667 (1976).
- Renshaw et al. (1991) E. Renshaw, S. J. Yennello, K. Kwiatkowski, R. Planeta, L. W. Woo, and V. E. Viola, Phys. Rev. C 44, 2618 (1991).
- Neubert and Botvina (2000) W. Neubert and A. S. Botvina, Eur. Phys. J. A 7, 101 (2000).
- Friedman (1990) W. A. Friedman, Phys. Rev. C 42, 667 (1990).
- Xi et al. (1998) H. Xi et al., Phys. Rev. C 57, R462 (1998).
- Wang et al. (2005) J. C. Wang et al., Phys. Rev. C 72, 024603 (2005).
- Chen et al. (2003) L.-W. Chen, C. M. Ko, and B.-A. Li, Nucl. Phys. A 729, 809 (2003).
- Kohley et al. (2011) Z. Kohley et al., Phys. Rev. C 83, 044601 (2011).
- Sun et al. (2010) Z. Y. Sun et al., Phys. Rev. C 82, 051603 (2010).
- Chajecki (2012) Z. Chajecki, private communication (2012).
- Sobotka et al. (1997) L. G. Sobotka, J. F. Dempsey, R. J. Charity, and P. Danielewicz, Phys. Rev. C 55, 2109 (1997).
- Natowitz et al. (2010) J. B. Natowitz et al., Phys. Rev. Lett. 104, 202501 (2010).
- Zhang et al. (2008) Y. X. Zhang, P. Danielewicz, M. Famiano, Z. Li, W. Lynch, and M. Tsang, Phys. Lett. B 664, 145 (2008).
- Tsang et al. (2001) M. B. Tsang, W. A. Friedman, C. K. Gelbke, W. G. Lynch, G. Verde, and H. Xu, Phys. Rev. Lett. 86, 5023 (2001).
- Colonna et al. (2008) M. Colonna, V. Baran, M. Di Toro, and H. H. Wolter, Phys. Rev. C 78, 064618 (2008).