On the role of feedback in shaping the cosmic abundance and clustering of neutral atomic hydrogen in galaxies
Abstract
We investigate the impact of feedback – from supernovae (SNe), active galactic nuclei (AGN) and a photo-ionizing background at high redshifts – on the neutral atomic hydrogen (HI) mass function, the band luminosity function, and the spatial clustering of these galaxies at =0. We use a version of the semi-analytical galaxy formation model GALFORM that calculates self-consistently the amount of HI in a galaxy as a function of cosmic time and links its star formation rate to its mass of molecular hydrogen (H2). We find that a systematic increase or decrease in the strength of SNe feedback leads to a systematic decrease or increase in the amplitudes of the luminosity and HI mass functions, but has little influence on their overall shapes. Varying the strength of AGN feedback influences only the numbers of the brightest or most HI massive galaxies, while the impact of varying the strength of photo-ionization feedback is restricted to changing the numbers of the faintest or least HI massive galaxies. Our results suggest that the HI mass function is a more sensitive probe of the consequences of cosmological reionization for galaxy formation than the luminosity function. We find that increasing the strength of any of the modes of feedback acts to weaken the clustering strength of galaxies, regardless of their HI-richness. In contrast, weaker AGN feedback has little effect on the clustering strength whereas weaker SNe feedback increases the clustering strength of HI-poor galaxies more strongly than HI-rich galaxies. These results indicate that forthcoming HI surveys on next generation radio telescopes such as the Square Kilometre Array and its pathfinders will be exploited most fruitfully as part of multiwavelength survey campaigns.
keywords:
galaxies: formation – evolution – large-scale structure of the Universe – radio lines: galaxies1 Introduction
Neutral hydrogen, both atomic (HI) and molecular (H2), plays a fundamental role in galaxy formation, principally as the raw material from which stars are made. The amount of neutral hydrogen in a galaxy at any given time reflects the complex interplay between processes that either deplete it, such as supernovae, or replenish it, such as gas cooling from hot atmospheres surrounding galaxies and by mergers with other gas-rich galaxies. By quantifying the properties of HI in galaxies and noting how these properties vary with galaxy morphology and environment, we can glean insights into the physics of galaxy formation and test predictions of theoretical models.
Most of what we know about the HI properties of galaxies comes from surveys of the nearby Universe () such as HIPASS (HI Parkes All-Sky Survey; see Meyer et al., 2004) and ALFALFA (Arecibo Legacy Fast ALFA Survey; see Giovanelli et al., 2005). Such surveys have revealed that HI-rich galaxies tend to be late-type (e.g. Kilborn et al., 2002; Evoli et al., 2011), but it is common for early-type field galaxies to host HI (e.g. Serra et al., 2012); that the HI mass function is well described by a Schechter function (e.g. Zwaan et al., 2003; Martin et al., 2010) but its shape depends on environment (e.g. Zwaan et al., 2005; Springob et al., 2005; Kilborn et al., 2009); and that HI-rich galaxies are among the most weakly clustered galaxies known (e.g. Meyer et al., 2007; Basilakos et al., 2007; Passmoor et al., 2011). However, knowledge of the HI properties of galaxies will improve many-fold over the coming decade with the advent of next generation HI galaxy surveys on ASKAP (cf. Johnston et al., 2008), MeerKAT (cf. Jonas, 2007)) and ultimately the SKA itself (e.g. Baugh et al., 2004; Blake et al., 2004; Power et al., 2010; Abdalla et al., 2010; Kim et al., 2011).
Future galaxy surveys on the SKA and its pathfinders are expected to revolutionize our view of the HI Universe and so it is timely to ask precisely what these surveys can teach us about the physical processes that drive galaxy formation. In this paper we focus on feedback – from stars in the form of winds driven by supernovae (SNe), from accreting super-massive black holes in the form of active galactic nuclei (AGN) heating, and from a photo-ionizing background in the early Universe – and evaluate how the global properties of HI in galaxies such as the HI mass function, which quantifies the number density of galaxies of a given HI mass, and the 2-point correlation function and halo occupation distributions (HODs; e.g. Kim et al., 2011), which quantify spatial clustering, are shaped by different sources of feedback.
In galaxy formation models, the strengths of these processes and the interplay between them have been traditionally set by examining the predictions of the galaxy luminosity function in the band, so we will also study how this statistic changes. To do this, we use the version of the semi-analytical galaxy formation model GALFORM of Cole et al. (2000) as it has been developed by Lagos et al. (2011a); this calculates self-consistently the HI properties of galaxies by splitting their interstellar media (ISM) into HI and H2 phases using the empirical relations of Blitz & Rosolowsky (2006) and Leroy et al. (2008), and links star formation in galaxies not to their cold gas masses, as assumed in previous models (cf. Cole et al., 2000; Baugh, 2006), but to their H2 masses, as suggested by recent observations (e.g. Bigiel et al., 2008). As shown in Lagos et al. (2011b), this model reproduces the observed HI mass function at =0, accurately reproducing its amplitude and shape at intermediate and low HI masses.
This is particularly interesting because we expect feedback to influence the global properties of galaxies selected either by their stellar mass or light. Previous studies have shown that SNe are pivotal in fixing the amplitude and slope of the luminosity function (e.g. Cole et al., 2000; Benson et al., 2003) while AGN heating suppresses the formation of massive galaxies and dictates the form of the bright end (cf. Bower et al., 2006; Croton et al., 2006). In contrast, the influence of SNe and AGN on the HIMF appears more subtle. For example, Power et al. (2010) found that galaxy formation models that included or excluded AGN heating (such as De Lucia & Blaizot 2007 and Baugh et al. 2005 respectively) predict HI mass functions that reproduce equally well the observed data. The HI mass function offers the possibility of placing stronger constraints on the strength of feedback in semi-analytical models, which previously used only the optical properties of galaxies (e.g. Benson et al., 2003; Bower et al., 2010). At the same time, the variation of clustering strength with galaxy properties provides us with important clues about the physics of galaxy formation. Any discrepancy between observational measurements of clustering and the predictions of galaxy formation models indicates the need to improve the models, either by refining the modelling of the physical processes included or by considering the addition of further effects (see, for example, Kim et al., 2009).
The structure of the paper is as follows. In §2, we provide a brief overview of the Lagos et al. (2011a) model and describe how the different modes of feedback (SNe, AGN and photo-ionization) are implemented in GALFORM. In §3 we show how the different forms of feedback influence both the galaxy luminosity function in band and the HI mass function, and we deduce using likelihood maximization precisely what information we glean from them. In §4 we investigate how the spatial clustering of HI-poor and HI-rich galaxies are influenced by feedback by inspecting the 2-point correlation function and HODs. Finally, in §5, we summarize our results and discuss their implications for testing the modelling of feedback with forthcoming HI surveys.
2 Modelling
In this section we first briefly give an overview of the version of GALFORM used in this paper (§ 2.1). Because the focus of our paper is on the impact of feedback on the large-scale HI properties of galaxies, we summarize the modes of feedback that are implemented in GALFORM – from SNe (§ 2.2), AGN (§ 2.3) and photo-ionization after cosmological reionization (§ 2.4).
2.1 The GALFORM galaxy formation model
We use the version of GALFORM (cf. Cole et al., 2000) that is described in Lagos et al. (2011a, b) to predict the properties of galaxies forming and evolving in the CDM cosmology adopted for the Millennium Simulation (cf. Springel et al., 2005)111Recall that the cosmological parameters adopted for the Millennium Simulation are the total matter density , the baryon density , the vacuum energy density , the Hubble parameter with =0.73, the primordial scalar spectral index and the fluctuation amplitude .. GALFORM models the key physical processes of galaxy formation, including the gravitationally driven assembly of dark matter halos, radiative cooling of gas and its collapse to form centrifugally supported discs, star formation, and feedback from supernovae (SNe) and active galactic nuclei (AGN).
Lagos et al. (2011a) extended GALFORM by modelling the splitting of cold gas in the interstellar medium (ISM) into its HI and H2 components and by linking explicitly star formation to the amount of H2 present in a galaxy. Lagos et al. (2011b) compared the model predictions obtained using empirically and theoretically derived star formation laws (cf. Blitz & Rosolowsky, 2006; Krumholz et al., 2009) with a variety of observations (e.g. the HI mass function, 12CO (1-0) luminosity function, and correlations between the ratio H2/HI and stellar and cold gas masses) and found that the empirical law of Blitz & Rosolowsky (2006) (see also Leroy et al. 2008) is favoured by these data. This law is of the form
| (1) |
where and are the surface densities of the star formation rate (SFR) and total cold gas mass respectively, is the inverse of the SF timescale for the molecular gas and is the molecular to total gas mass surface density ratio. Importantly for the work we present in this paper, Lagos et al. (2011b) showed that the Blitz & Rosolowsky (2006) law is able to reproduce the HI mass function at =0 at intermediate and low HI masses. This is because it suppresses star formation in lower mass galaxies, thereby reducing SNe feedback and allowing these galaxies to retain larger gas reservoirs. Note that we use the Lagos et al. (2011b) as the default model in this paper.
2.2 Supernovae (SNe) Feedback
SNe act to reheat cold gas and eject it from the galaxy disc at a rate
| (2) |
where is the instantaneous star formation rate and regulates feedback efficiency,
| (3) |
Here and are adjustable parameters that govern the strength of the SNe feedback (cf. Cole et al., 2000) and is the circular velocity of the galactic disc; the values in the default Lagos et al. (2011b) model are =485 km/s and =3.2. We expect SNe feedback to be most effective in low-mass dark matter halos because gas is expelled efficiently from their shallow potential wells. From Eq 3, the mass loading of the SNe wind is largest in such halos and this suppresses the formation of faint, low-mass galaxies and ensures that the faint end of the galaxy luminosity function is recovered by GALFORM, in good agreement with observational estimates (e.g. Blanton et al., 2001; Norberg et al., 2002).
2.3 AGN feedback
SNe feedback is less effective in large circular velocity halos (according to Eq 3). The gas ejected from low mass halos can potentially cool and turn into stars in more massive halos, generally leading to the formation of too many massive galaxies. In the absence of strong feedback in massive dark matter halos, GALFORM predicts an overabundance of bright galaxies and a galaxy luminosity function whose bright end slope is too steep (cf. Benson et al., 2003). For this reason, Bower et al. (2006) extended GALFORM to include AGN feedback, which suppresses cooling flows in massive halos. Physically this occurs because AGN are fuelled by super-massive black holes that grow by luminous accretion.
In GALFORM AGN feedback is modelled by assuming that the hot gaseous atmospheres surrounding massive galaxies are in quasi-hydrostatic equilibrium when the cooling time at the cooling radius, , exceeds a multiple of the free-fall time at the cooling radius, , i.e.
| (4) |
where is a free parameter that regulates the strength of AGN feedback222We note that Eq 2 of Bower et al. (2006) contains a typographical error.; increasing means that AGN feedback becomes effective in lower mass dark matter halos. We adopt a value of =0.58, which is the default in the Lagos et al. (2011b) model. We define the cooling time at halocentric radius as
| (5) |
where , and are the gas density, temperature and metallicity respectively, is the cooling function333We use the tabulated cooling functions of Sutherland & Dopita (1993)., is the mean molecular weight, the proton mass and is Boltzmann’s constant. We define the free-fall time at halocentric radius by
| (6) |
where is the total mass (baryonic and dark matter) interior to . The cooling radius, , is the radius at which matches the age of the halo, which is obtained from the halo merger history.
We note that the model predicts that generally black holes gain most of their mass by accretion of gas driven to the centre of the galaxy via disc instabilities (cf. Fanidakis et al., 2011). Accretion of gas that cools from the hot atmosphere is relatively unimportant until late times, when the growth rate of the black hole scales as , where is the luminosity of the cooling gas and is the speed of light.
2.4 Photo-ionization feedback
Photo-ionization is predicted to have a dramatic impact on star formation in low-mass galaxies. This is because the presence of a photo-ionizing background both modifies the net cooling rate of gas in halos by removing the “hydrogen peak” in the cooling curve (cf. Fig. 1 of Benson et al., 2002) and increases the temperature of the intergalactic medium (IGM) such that its thermal pressure prevents gravitational collapse of baryons onto low-mass halos (e.g. Efstathiou, 1992; Okamoto et al., 2008). As a result, only those low-mass halos that contained cold gas prior to re-ionization can form stars (e.g. Hoeft et al., 2006). GALFORM includes the Benson et al. (2002) prescription for suppressing the cooling of halo gas onto the galaxy – this occurs if the host halo’s circular velocity lies below a threshold at redshift . The values in the default Lagos et al. (2011b) model are =30 km/s and . The default is in good agreement with the results of hydrodynamical simulations by Hoeft et al. (2006) and Okamoto et al. (2008).
3 The Galaxy Luminosity Function and HI Mass Function
In this section we investigate how the galaxy luminosity function in
band and the HI mass function at =0 are influenced by
feedback from supernovae (SNe), active galactic nuclei (AGN) and
a photo-ionizing background. We use Monte Carlo halo merger trees generated
using the algorithm described in Parkinson
et al. (2008) to predict galaxy
properties. The Monte Carlo trees are tuned to match -body merger trees
extracted from the Millennium Simulation. Note that we express HI masses in
units of rather than , the mass unit
used in simulations. This ensures that the observational units (which depend
upon the square of the luminosity distance) are matched, but it introduces an
explicit dependence on the dimensionless Hubble parameter, for which we assume
the value of =0.73 used in the Millennium simulation. We refer the reader
to § 2.1 of Lagos et al. (2011b) for further discussion of this approach.
Intuitively, we expect SNe feedback to be particularly damaging in low-mass galaxies because gas is expelled easily from their shallow potential wells and so star formation is shut down. In contrast, SNe feedback is ineffective in high-mass galaxies, which reside at the centres of massive dark matter halos with deep potential wells; here a far more energetic source of feedback, namely AGN heating, is required, which acts to suppress the formation of very massive bright galaxies. The photo-ionizing background suppresses the collapse of gas onto low mass dark matter halos, thereby preventing galaxies from forming. The influence of these distinct processes on the galaxy luminosity function is straightforward to predict – photo-ionization and SNe feedback will govern the amplitude and shape of the faint end, while AGN heating dictates the amplitude and shape of the bright end. Predicting their impact on the HI mass function is less straightforward – as noted in Lagos et al. (2011b), the most HI-rich galaxies are likely to be low-mass systems, in which case the imprint of SNe feedback may span the mass function, whereas the influence of AGN heating may be negligible.
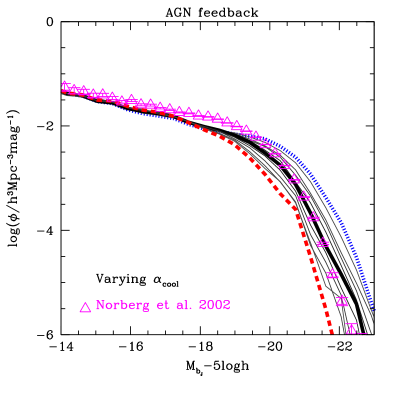
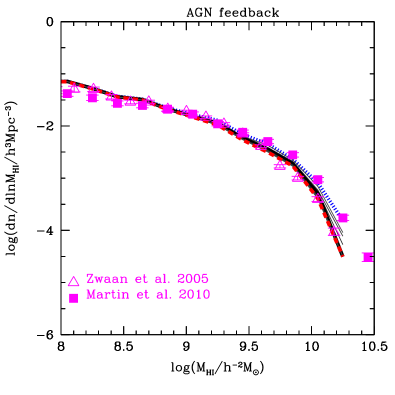
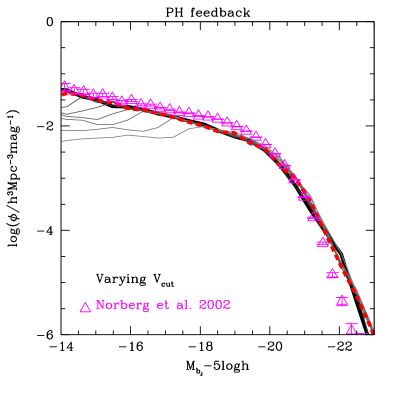
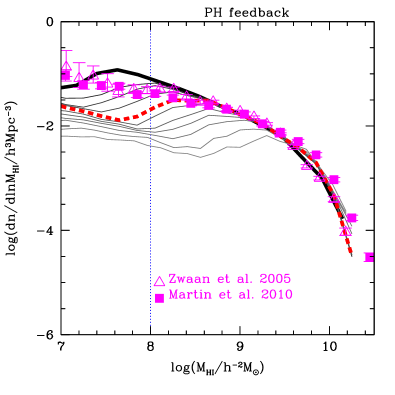
We investigate these ideas in Fig 1, in which we explore the impact of SNe driven winds (upper panels), AGN heating (middle panels) and a photo-ionizing background (lower panels) on the galaxy luminosity function in band (left panels) and HI mass function (right panels) at =0. For comparison we plot the band galaxy luminosity function (open triangles) estimated from the 2 degree Field Galaxy Redshift Survey (2dFGRS) by Norberg et al. (2002) in the left panels, and the HI mass functions deduced from the HIPASS (open triangles) and ALFALFA (filled squares) surveys by Zwaan et al. (2005) and Martin et al. (2010) respectively.
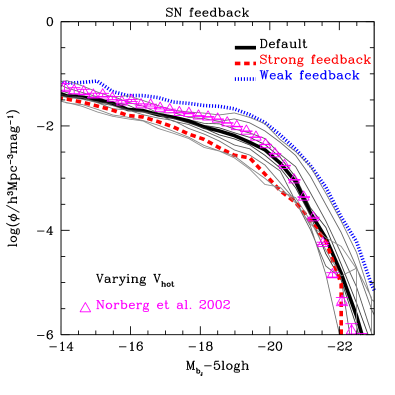
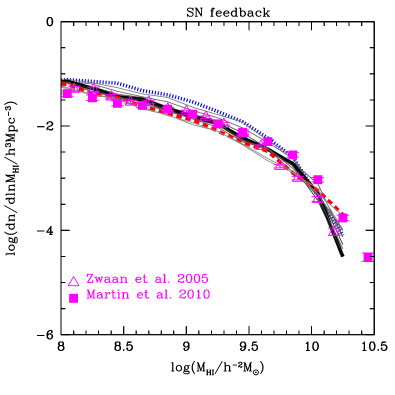
Impact of SNe feedback:
We vary the parameter , which governs the mass ejection rate, , assuming a fixed value of , between (less effective) and (more effective); recall its default value is 485 km/s. By varying we are in essence changing the mass of the system in which SNe feedback is effective. On the other hand varying would result in the same galaxies being affected by SNe, but with different mass loading in the winds of reheated material. The upper panels indicate that varying in this way leads to systematic and measurable offsets in both the luminosity function and HI mass function – stronger (weaker) SNe feedback decreases (increases) the number of galaxies of a given luminosity (by 0.5-1 dex) or HI mass (by 0.5 dex). Interestingly, weaker feedback leaves the shape of the luminosity and HI mass functions broadly unaffected, whereas stronger feedback leads to slightly steeper slopes at the faint/low-mass and bright/high mass ends. Red dashed and blue dotted curves correspond to models with strong ( and weak ( feedback; we use these as reference models in § 4, where we examine the clustering of HI-rich and HI-poor galaxies.
Impact of AGN feedback:
Here we vary the parameter between ; recall its fiducial value is . Increasing decreases the halo mass at which AGN heating starts to become effective. The middle panels of Fig 1 demonstrate that AGN heating has little influence beyond the bright end of the galaxy luminosity function or the high-mass end of the HI mass function, regulating both the sharpness of the transition between faint/bright and low/high mass galaxies and the position at which it occurs. The number of bright galaxies is very sensitive to the strength of AGN feedback, varying by as much as a factor of 100 for the most luminous systems. Interestingly AGN feedback also affects the numbers of galaxies with high HI masses, but the effect is only apparent in the cases of weakest feedback. Red dashed and blue dotted curves correspond to models with strong () and weak () AGN feedback, which, as before, we use as reference models in § 4.
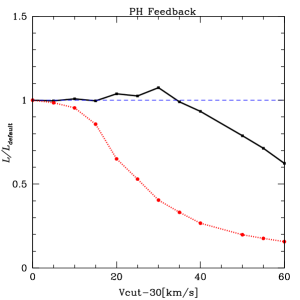
Impact of Photo-ionization:
Two parameters, and , govern photo-ionization in the model. We find that , the redshift at which reionization occurs, has little influence on either the galaxy luminosity function or HI mass function at =0 – varying between , the range suggested by measurements of polarisation in the cosmic microwave background radiation and the Gunn-Peterson effect in distant quasars (e.g. Greiner et al., 2009; Komatsu et al., 2011), produce luminosity and HI mass functions that are indistinguishable, to within the line width. For this reason we concentrate on , which we vary between . The minimum progenitor mass we consider is to explore low values (see also HI mass function in figure. 1 which has lower HI mass limit than other cases of HI mass function, indicated by the vertical dotted line). Increasing suppresses cooling in all halos with circular velocities at and its impact is most pronounced at the faint end of the galaxy luminosity function and the low-mass end of the HI mass function. The red dashed curve corresponds to a model with strong (50) photoionization feedback, which we use as a reference model in § 4.
Constraints on Galaxy Formation Models:
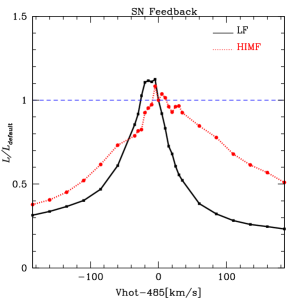
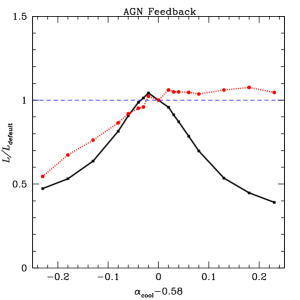
What information can we glean from the galaxy luminosity and HI mass functions about the various modes of feedback? We investigate this using the galaxy luminosity function of Norberg et al. (2002) and the HI mass function of Zwaan et al. (2005). Although the Martin et al. (2010) ALFALFA mass function extends to lower HI masses, it has more limited sky coverage than the Zwaan et al. (2005) HIPASS mass function and so is more susceptible to the effects of cosmic variance. We quantify the constraints offered by the observational data by calculating the ratio of likelihoods for each models with respect to default model,
| (7) |
Here we sum over the difference in values of the observational data () and the predictions () for each model and compare with the sum over this difference for the default model. Our results are plotted in Fig 2, where solid (dotted) curves indicate how varies with SNe, AGN and photo-ionization feedback strength (left, middle and right panels) for the galaxy luminosity function (HI mass function).
Formally, the models give a poor fit to the observational data. There are several reasons for this. Firstly, the parameters we vary are physical, not statistical, and affect the predictions of the model in a complex way, due to the interplay between different physical processes. With a parametric functional form, such as the Schechter function, the consequences of changing a parameter are transparent. Secondly, GALFORM predicts a whole range of galaxy properties, and the luminosity function or HI mass function represent just one way of describing the population of model galaxies. The parameters of the default model were chosen as a compromise in reproducing a variety of observational data, not just the luminosity function or mass function. If we chose to fit the data considered here in isolation, with complete disregard for any other dataset, it would be possible to improve the fits. Nevertheless, it is not clear that we would obtain a formally acceptable fit. Again, the reason for this is that GALFORM is a physical model rather than a parametric fitting formula. The shortcomings of the model could be encoded in a ”model discrepancy” that broadens the errors in a fit (see Bower et al. 2010 for a more formal approach to this). Finally, the observational errors do not include all of the contributions (e.g. sample variance) and exclude systematics (e.g. the k-correction in the case of the luminosity function). The key point we aim to get across from this plot is the shape of the curves: How rapidly do we move away from the quality of the fit in the default model on varying the parameter? If the value of varies rapidly on comparing the model predictions to a particular dataset, then that dataset could in principle provide a tighter constraint on the parameter value.
We find that the galaxy luminosity function shows a strong dependence on the strength of SNe feedback and a moderate dependence on the strength of AGN feedback, with a narrow range of preferred values close to their default values; the HI mass function offers a weak constraint on SNe feedback and no constraint on AGN feedback. In contrast the HI mass function is sensitive to the strength of the photo-ionizing background, and indicates that values of larger than can be ruled out.
Smaller values of appear to have the same likelihood, but this can be understood as an artifact of the effective resolution of our merger trees. We use Monte Carlo merger trees to explore the impact of varying , as this allows us to vary the mass resolution of the progenitor halos to ensure that we can resolve the halos which would be affected by the choice of this parameter. The minimum progenitor mass we consider is . We can obtain tighter constraints on the minimum value of by using Monte Carlo trees with higher effective resolution, but we defer this to a forthcoming paper. Our results suggest that the HI mass function, measured at =0, can provide an important constraint on the minimum halo mass that contributed to reionization, and complements estimates estimates of the minimum halo mass based on high redshift observations (e.g. Choudhury et al., 2008; Srbinovsky & Wyithe, 2010; Muñoz & Loeb, 2011)
4 Spatial Clustering of HI in Galaxies
We now examine how feedback influences the spatial distribution of HI galaxies, which we quantify using the 2-point correlation function and the halo occupation distribution (hereafter HOD; cf. Benson et al., 2000; Peacock & Smith, 2000; Berlind & Weinberg, 2002). The clustering predictions for -band selected samples were studied in Kim et al. (2009). The HOD gives the mean number of galaxies as a function of halo mass, assuming pre-defined selection criteria (e.g. colour, cold gas mass), and can be separated into contributions from central galaxies and their satellites. It is an output from the semi-analytical model. HODs for optically selected samples of galaxies have been studied extensively and are typically parameterized as step functions, which represent central galaxies, and power-law components, which represent satellites (e.g. Peacock & Smith, 2000; Berlind & Weinberg, 2002). In contrast, relatively few studies have been made of HODs for HI selected samples of galaxies (e.g. Wyithe & Brown, 2010; Marín et al., 2010; Kim et al., 2011) but they indicate that parameterizations of the kind adopted for optically selected galaxy samples need to be modified for HI selected samples (cf. Kim et al., 2011).
Note that we use -body halo merger trees drawn from the Millennium
Simulation to obtain the spatial information required to study clustering.
The resolution limit of the Millennium Simulation imposes a limit on the halo
mass that we can reliably resolve of , which in
turn sets a limit of on the HI mass
that we can track.
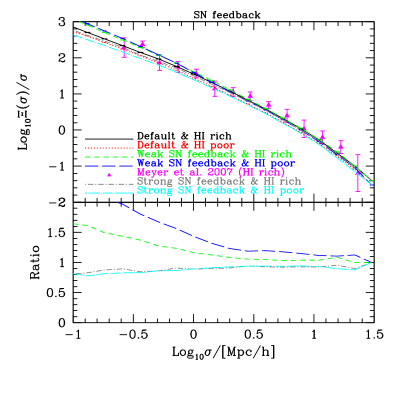
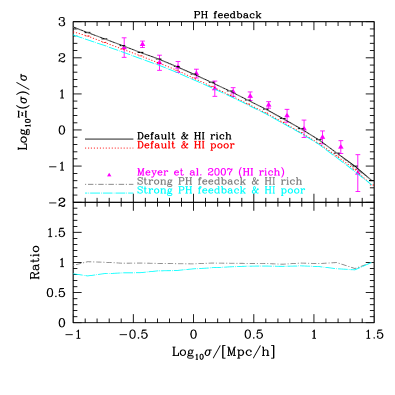
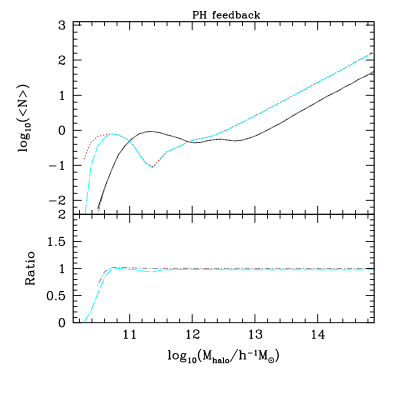
In Fig 3 we explore the impact of SNe driven winds (upper panels), AGN heating (middle panels) and photo-ionization (lower panels) on the 2-point correlation function (left panels) and the HOD (right panels) at =0. In the top part of each panel we plot the relevant statistic for galaxies selected according to their high or low HI mass, while in the bottom part we plot the ratio of the statistic with respect to its value in the default model for galaxies of the same HI richness. Here we define HI-rich galaxies to have while HI-poor galaxies have . For clarity, we concentrate on the typical weak and strong feedback models (blue and red curves respectively) that we considered in Fig 1. This is necessary because we expect environmental effects to become apparent when we measure clustering properties, and we wish to disentangle the effects of environment from feedback. We show also the 2-point correlation function of gas rich galaxies at =0 measured from the HIPASS survey, presented in Meyer et al. (2007), and the predictions for the 2-point correlation function and the HOD in the default model, which is in good agreement with the HIPASS result.
Impact of SNe feedback:
The default model predicts that HI-rich galaxies (black solid curve) should be more strongly clustered than HI-poor galaxies (red dotted curve), which we show in the top left panel. Here we see also that strong SNe feedback has negligible impact on the clustering strength at large separations of both HI-rich and HI-poor galaxies (dotted-dashed and dashed curves respectively), but it influences the clustering strength of both HI-rich and HI-poor galaxies at separations (short dashed curve). Reducing the strength of SNe feedback leads both HI-poor and HI-rich galaxies to cluster more strongly at small separations – for HI-rich (HI-poor) galaxies. Fig. 3 shows that the clustering amplitude of both HI-poor and HI-rich samples becomes similar – as can be most easily seen in the lower panel, which shows the ratio of the clustering with respect to that of the corresponding HI sample in the default model. This trend can be understood by inspecting Figure 3 of Kim et al. (2011), in which the cold gas mass in galaxies is plotted against their host dark matter halo mass. Beyond the mass at which AGN heating stops cooling flows, there is a sudden break in the cold gas mass - halo mass relation and a dramatic increase in the scatter. Above this break in mass, the presence of gas is due to accretion of halos of lower mass, which have their own gas reservoirs, onto the main halo. By reducing the strength of SNe feedback, more gas is able to stay in the cold phase in these progenitors and gas is depleted more slowly in the current host. Because there is a large scatter in galaxy cold gas mass for a given halo mass, there is a shift in the typical host mass for both HI-poor and HI-rich galaxies, leading to an increase in the clustering amplitude.
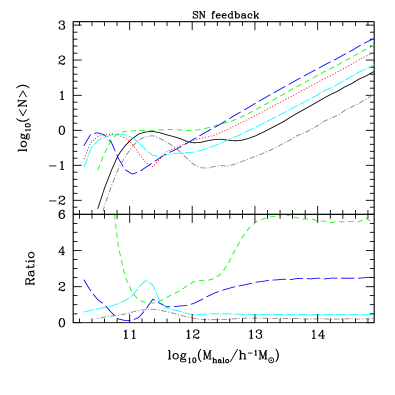
In the top right upper panel we show the predicted HODs as a function of HI richness (dashed and dotted curves) for all galaxies. Thick (thin) curves indicate strong (weak) SNe feedback cases for HI-poor and HI-rich galaxies. As we would expect, stronger SNe feedback leads to fewer galaxies when compared to the weaker feedback case, spanning the full range of halo masses and regardless of the HI richness of the galaxies. In the top right lower panel we plot the ratio of the number of galaxies for the strong and weak SNe feedback cases compared to the default model. Again this reveals that SNe feedback affects the numbers of galaxies regardless of host halo mass, but interestingly it shows that the influence of SNe feedback is greater on the numbers of HI-rich galaxies compared to HI-poor galaxies.
Impact of AGN feedback:
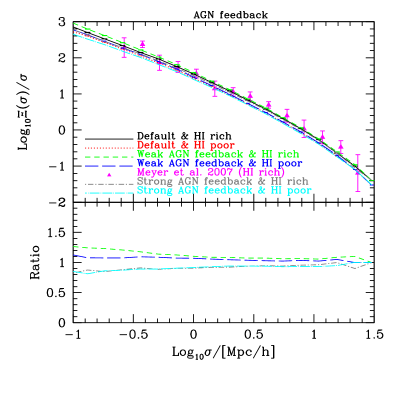
In the middle left panel we show that the clustering of galaxies selected by their HI richness is largely insensitive to the strength of AGN feedback. If AGN feedback is weak, its effect on the clustering strength of HI-poor galaxies is negligible and enhances the clustering of HI-rich galaxies only at small separations. If the AGN feedback is strong, it suppresses the clustering of both HI-rich and HI-poor galaxies to a similar extent.
As before, we show in the middle right upper and lower panels the predicted HODs as a function of HI richness (dashed and dotted curves) for all galaxies, where strong (weak) AGN feedback is indicated by thick (thin) curves. The lower panel shows that AGN feedback affects halos with masses in excess of and that it has a greater impact on the numbers of HI-rich galaxies than HI-poor galaxies.
Impact of Photo-ionization:
Increasing the strength of photo-ionization has negligible impact on the clustering strength of HI-rich galaxies, but leads to an increase in the clustering strength of HI-poor galaxies. This is because increasing the strength of photo-ionization corresponds to an increase in the circular velocity scale of dark matter halos in which galaxies can form.
We show predicted HODs as a function of HI richness (dashed and dotted curves) for all galaxies in the bottom right upper and lower panels. Here we consider only the case of strong photo-ionization feedback because the typical halo mass affected by weak photo-ionization feedback (=30 km/s) drops below the resolution limit of the Millennium Simulation at early times. Thick lines indicate strong photo-ionization feedback whereas thin lines show the default model for HI-poor and HI-rich galaxies. It is readily apparent that photo-ionization feedback has little influence over the HODs of HI-rich galaxies – the strong feedback case is indistinguishable from the default model. The lower panel shows that photo-ionization feedback affects only the lowest mass halos () at =0.

5 Summary
We have used the version of the GALFORM semi-analytical galaxy formation model (cf. Cole et al., 2000) that has been extended by Lagos et al. (2011a) to study how feedback from SNe, AGN and photo-ionization shapes both the galaxy luminosity and HI mass functions, and the spatial clustering of HI galaxies. The advantage of the Lagos et al. (2011a) model is that it is one of the first to predict explicitly and in a self-consistent manner how much HI should reside in a galaxy at a given time (see also Fu et al., 2010) and it has reproduced successfully the observed HI mass function at low-to-intermediate masses (cf. Lagos et al., 2011b). The main results of our study can be summarised as follows;
Feedback from SNe regulates the amplitude and shape of both the galaxy luminosity function and the HI mass function. The effect is systematic, with more (less) efficient SNe feedback leading to fewer (more) galaxies of a given luminosity or HI mass. It also regulates the amplitude of the 2-point correlation function of HI-rich galaxies at small separations and the numbers of galaxies per halo mass as quantified by the HOD, regardless of their HI richness.
Feedback from AGN has little effect on either the faint-to-intermediate luminosity end of the galaxy luminosity function or low-to-intermediate mass end of the HI mass function – its impact is strongest for the brightest galaxies, as previous studies have argued (e.g. Croton et al., 2006; Bower et al., 2006), but it also affects the number of highest HI mass galaxies. A similar result has been reported by Fabello et al. (2011), and it also helps to explain the cold gas mass-halo mass relation presented in Fig. 3 of Kim et al. (2011) for the Bower et al. (2006) model. In contrast, its impact on the clustering of HI galaxies is minor or negligible.
Feedback from photo-ionization is most pronounced for the faintest and most HI-poor galaxies. The redshift at which reionization occurs is not important – but the mass scale, as measured by , is, and its influence is evident in both the shape and amplitude of the faint end of luminosity function and the low-mass end of the HI mass function. Our analysis suggests that the low-to-intermediate mass end of HI mass function offers the potential to constrain the models of photo-ionization. Interestingly, we find that the locally measured HI mass function can constrain the minimum mass of dark matter halos that could have hosted galaxies that contributed to reionization. This complements existing studies of the high redshift Universe that have used, for example, the electron scattering optical depth (e.g. Choudhury et al., 2008), the Lyman- forest and (e.g Srbinovsky & Wyithe, 2010) and the UV luminosity function (e.g. Muñoz & Loeb, 2011) to estimate the minimum halo mass. Our analysis suggests that the circular velocities of halos in which galaxy formation was suppressed cannot be larger than .
Strong modes of feedback, as they are implemented in GALFORM, act to suppress the clustering strength of galaxies, regardless of their HI-richness. HI-poor galaxies cluster more strongly than HI-rich galaxies if the strength of SNe feedback is weakened, whereas there is little change in the clustering of either HI-rich or HI-poor galaxies if the strength of AGN feedback is weakened.
Our study suggests that forthcoming HI galaxy surveys can be most fruitfully exploited scientifically if they are part of a multiwavelength campaign. Such campaigns are being planned; for example, DINGO (Deep Investigation of Neutral Gas Origins) on ASKAP (cf. Meyer, 2009) will probe the galaxy population out to and will be combined the GAMA (Galaxy And Mass Assembly) survey (cf. Driver et al., 2011). These data-sets will allow us to study not only the HI properties of galaxies that host AGN or young starbursts, but also the effects of environment and evolution with redshift.
Acknowledgements
HSK is supported by a Super-Science Fellowship from the Australian Research Council. CP thanks warmly Danail Obreschkow, Martin Meyer and Aaron Robotham for helpful discussions. This work was supported by a STFC rolling grant at Durham. The calculations for this paper were performed on the ICC Cosmology Machine, which is part of the DiRAC Facility jointly funded by the STFC, the Large Facilities Capital Fund of BIS, and Durham University. Part of the research presented in this paper was undertaken as part of the Survey Simulation Pipeline (SSimPL; http://www.astronomy.swin.edu.au/SSimPL/). The Centre for All-Sky Astrophysics is an Australian Research Council Centre of Excellence, funded by grant CE11E0090.
References
- Abdalla et al. (2010) Abdalla, F. B., Blake, C., & Rawlings, S. 2010, MNRAS, 401, 743
- Basilakos et al. (2007) Basilakos, S., Plionis, M., Kovač, K., & Voglis, N. 2007, MNRAS, 378, 301
- Baugh et al. (2004) Baugh C. M., Lacey C. G., Frenk C. S., Benson A. J., Cole S., Granato G. L., Silva L. & Bressan A., 2004, New Astronomy Review, 48, 1239
- Baugh et al. (2005) Baugh C. M., Lacey C. G., Frenk C. S., Granato G. L., Silva L., Bressan A., Benson A. J. & Cole S., 2005, MNRAS, 356, 1191
- Baugh (2006) Baugh C. M., 2006, Reports of Progress in Physics, 69, 3101
- Benson et al. (2000) Benson, A. J., Cole, S., Frenk, C. S., Baugh, C. M., & Lacey, C. G. 2000, MNRAS, 311, 793
- Benson et al. (2002) Benson, A. J., Lacey, C. G., Baugh, C. M., Cole, S., & Frenk, C. S. 2002, MNRAS, 333, 156
- Benson et al. (2003) Benson, A. J., Bower, R. G., Frenk, C. S., Lacey, C. G., Baugh, C. M., Cole, S 2003 ApJ, 599, 38
- Berlind & Weinberg (2002) Berlind, A. A., & Weinberg, D. H. 2002, ApJ, 575, 587
- Bigiel et al. (2008) Bigiel, F., Leroy, A., Walter, F., et al. 2008, AJ, 136, 2846
- Blake et al. (2004) Blake C. A., Abdalla F. B., Bridle S. L. & Rawlings S., 2004, New Astronomy Review, 48, 1063
- Blanton et al. (2001) Blanton, M. R., Dalcanton, J., Eisenstein, D., et al. 2001, AJ, 121, 2358
- Blitz & Rosolowsky (2006) Blitz L. & Rosolowsky E. 2006, ApJ, 650, 933
- Bower et al. (2006) Bower R. G., Benson A. J., Malbon R., Helly J. C., Frenk C. S., Baugh C. M., Cole S. & Lacey C. G., 2006, MNRAS, 370, 645
- Bower et al. (2010) Bower, R. G., Vernon, I., Goldstein, M., Benson, A. J., Lacey, C. G., Baugh, C. M., Cole, S., Frenk, C. S. 2010 MNRAS, 407, 2017
- Choudhury et al. (2008) Choudhury, T. R., Ferrara, A., & Gallerani, S. 2008, MNRAS, 385, L58
- Cole et al. (2000) Cole S., Lacey C. G., Baugh C. M. & Frenk C. S., 2000, MNRAS, 319, 168
- Croton et al. (2006) Croton D. J., Springel V., White S. D. M., De Lucia G., Frenk C. S., Gao L., Jenkins A., Kauffmann G., Navarro J. F. & Yoshida N., 2006, MNRAS, 365, 11
- De Lucia & Blaizot (2007) De Lucia, G., & Blaizot, J. 2007, MNRAS, 375, 2
- Driver et al. (2011) Driver, S. P., Hill, D. T., Kelvin, L. S., et al. 2011, MNRAS, 413, 971
- Duffy et al. (2012) Duffy, A. R., Kay, S. T., Battye, R. A., et al. 2012, MNRAS, 420, 2799
- Efstathiou (1992) Efstathiou, G. 1992, MNRAS, 256, 43
- Evoli et al. (2011) Evoli, C., Salucci, P., Lapi, A., & Danese, L. 2011, ApJ, 743, 45
- Fabello et al. (2011) Fabello, S., Kauffmann, G., Catinella, B., et al. 2011, MNRAS, 416, 1739
- Fanidakis et al. (2011) Fanidakis, N., Baugh, C. M., Benson, A. J., et al. 2011, MNRAS, 410, 53
- Fu et al. (2010) Fu, J., Guo, Q., Kauffmann, G., & Krumholz, M. R. 2010, MNRAS, 409, 515
- Giovanelli et al. (2005) Giovanelli, R., Haynes, M. P., Kent, B. R., et al. 2005, AJ, 130, 2598
- Greiner et al. (2009) Greiner J., et al. 2009, ApJ, 693, 1610.
- Hoeft et al. (2006) Hoeft, M., Yepes, G., Gottlöber, S., & Springel, V. 2006, MNRAS, 371, 401
- Johnston et al. (2008) Johnston S. et al., 2008, Experimental Astronomy, 22, 151
- Jonas (2007) Jonas J., 2007, in “From Planets to Dark Energy: the Modern Radio Universe”, October 1-5 2007, The University of Manchester, UK.
- Kilborn et al. (2002) Kilborn, V. A., Webster, R. L., Staveley-Smith, L., et al. 2002, AJ, 124, 690
- Kilborn et al. (2009) Kilborn, V. A., Forbes, D. A., Barnes, D. G., et al. 2009, MNRAS, 400, 1962
- Kim et al. (2009) Kim, H.-S., Baugh, C. M., Cole, S., Frenk, C. S., & Benson, A. J. 2009, MNRAS, 400, 1527
- Kim et al. (2011) Kim, H.-S., Baugh, C. M., Benson, A. J., et al. 2011, MNRAS, 414, 2367
- Krumholz et al. (2009) Krumholz, M. R., McKee, C. F., & Tumlinson, J. 2009, ApJ, 699, 850
- Komatsu et al. (2011) Komatsu E., et al. 2011, ApJS, 192, 18
- Lagos et al. (2011a) Lagos, C. D. P., Lacey, C. G., Baugh, C. M., Bower, R. G., & Benson, A. J. 2011a, MNRAS, 416, 1566
- Lagos et al. (2011b) Lagos, C. D. P., Baugh, C. M., Lacey, C. G., et al. 2011b, MNRAS, 418, 1649
- Leroy et al. (2008) Leroy, A. K., Walter, F., Brinks, E., et al. 2008, AJ, 136, 2782
- Marín et al. (2010) Marín, F. A., Gnedin, N. Y., Seo, H.-J., & Vallinotto, A. 2010, ApJ, 718, 972
- Martin et al. (2010) Martin, A. M., Papastergis, E., Giovanelli, R., et al. 2010, ApJ, 723, 1359
- Meyer et al. (2004) Meyer M. J. et al., 2004, MNRAS, 350, 1195
- Meyer et al. (2007) Meyer, M. J., Zwaan, M. A., Webster, R. L., Brown, M. J. I., & Staveley-Smith, L. 2007, ApJ, 654, 702
- Meyer (2009) Meyer, M. 2009, Panoramic Radio Astronomy: Wide-field 1-2 GHz Research on Galaxy Evolution,
- Muñoz & Loeb (2011) Muñoz, J. A., & Loeb, A. 2011, ApJ, 729, 99
- Norberg et al. (2002) Norberg, P., Baugh, C. M., Hawkins, E., et al. 2002, MNRAS, 336, 907
- Obreschkow & Rawlings (2009) Obreschkow D. & Rawlings S., 2009, MNRAS, 394, 1857
- Obreschkow et al. (2009a) Obreschkow D., Croton D., De Lucia G., Khochfar S. & Rawlings S., 2009a, ApJ, 698, 1467
- Obreschkow et al. (2009b) Obreschkow, D., Heywood, I., Klöckner, H. -R., & Rawlings, S., 2009b, ApJ, 702, 1321
- Okamoto et al. (2008) Okamoto, T., Gao, L., & Theuns, T. 2008, MNRAS, 390, 920
- Parkinson et al. (2008) Parkinson H., Cole S. & Helly J., 2008, MNRAS, 383, 557
- Passmoor et al. (2011) Passmoor, S. S., Cress, C. M., & Faltenbacher, A. 2011, MNRAS, 412, L50
- Peacock & Smith (2000) Peacock, J. A., & Smith, R. E. 2000, MNRAS, 318, 1144
- Power et al. (2010) Power, C., Baugh, C. M., & Lacey, C. G. 2010, MNRAS, 406, 43
- Serra et al. (2012) Serra, P., Oosterloo, T., Morganti, R., et al. 2012, MNRAS, 422, 1835
- Springel et al. (2005) Springel V., White S. D. M., Jenkins A., Frenk C. S., Yoshida N., Gao L., Navarro J., Thacker R., Croton D., Helly J., Peacock J. A., Cole S., Thomas P., Couchman H., Evrard A., Colberg J. & Pearce F., 2005, Nature, 435, 629
- Springob et al. (2005) Springob, C. M., Haynes, M. P., & Giovanelli, R. 2005, ApJ, 621, 215
- Srbinovsky & Wyithe (2010) Srbinovsky, J. A., & Wyithe, J. S. B. 2010, PASA, 27, 110
- Sutherland & Dopita (1993) Sutherland, R. S., & Dopita, M. A. 1993, ApJS, 88, 253
- Verheijen et al. (2008) Verheijen, M. A. W., Oosterloo, T. A., van Cappellen, W. A., et al. 2008, The Evolution of Galaxies Through the Neutral Hydrogen Window, 1035, 265
- Wyithe & Brown (2010) Wyithe, J. S. B., & Brown, M. J. I. 2010, MNRAS, 404, 876
- Zwaan et al. (2003) Zwaan M. A. et al., 2003, AJ, 125, 2842
- Zwaan et al. (2005) Zwaan M. A., Meyer M. J., Staveley-Smith L. & Webster R. L., 2005, MNRAS, 359, L30