1.0
A Massive, Cooling-Flow-Induced Starburst in the Core of a Highly Luminous Galaxy Cluster
Abstract
In the cores of some galaxy clusters the hot intracluster plasma is dense enough that it should cool radiatively in the cluster’s lifetime[1, 2, 3], leading to continuous “cooling flows” of gas sinking towards the cluster center, yet no such cooling flow has been observed. The low observed star formation rates[6, 5] and cool gas masses[6] for these “cool core” clusters suggest that much of the cooling must be offset by astrophysical feedback to prevent the formation of a runaway cooling flow[7, 8, 9, 10]. Here we report X-ray, optical, and infrared observations of the galaxy cluster SPT-CLJ2344-4243[11] at = 0.596. These observations reveal an exceptionally luminous ( erg s-1) galaxy cluster which hosts an extremely strong cooling flow (Ṁcool = 3820 530 M⊙ yr-1). Further, the central galaxy in this cluster appears to be experiencing a massive starburst (740 160 M⊙ yr-1), which suggests that the feedback source responsible for preventing runaway cooling in nearby cool core clusters may not yet be fully established in SPT-CLJ2344-4243. This large star formation rate implies that a significant fraction of the stars in the central galaxy of this cluster may form via accretion of the intracluster medium, rather than the current picture of central galaxies assembling entirely via mergers.
MIT Kavli Institute for Astrophysics and Space Research, Massachusetts Institute of Technology, 77 Massachusetts Avenue, Cambridge, MA 02139
Department of Physics, Harvard University, 17 Oxford Street, Cambridge, MA 02138
Kavli Institute for Cosmological Physics, University of Chicago, 5640 South Ellis Avenue, Chicago, IL 60637
Enrico Fermi Institute, University of Chicago, 5640 South Ellis Avenue, Chicago, IL 60637
Harvard-Smithsonian Center for Astrophysics, 60 Garden Street, Cambridge, MA 02138
Department of Astronomy, University of Maryland, College Park, MD 20742
Astroparticle Physics Laboratory, NASA Goddard Space Flight Center, Code 661, Greenbelt, MD 20771 USA
University of Chicago, 5640 South Ellis Avenue, Chicago, IL 60637
Department of Physics, Ludwig-Maximilians-Universität, Scheinerstr. 1, 81679 München, Germany
Excellence Cluster Universe, Boltzmannstr. 2, 85748 Garching, Germany
Department of Physics, University of Chicago, 5640 South Ellis Avenue, Chicago, IL 60637
Department of Physics and Astronomy, University of Missouri, 5110 Rockhill Road, Kansas City, MO 64110
Department of Astronomy and Astrophysics, University of Chicago, 5640 South Ellis Avenue, Chicago, IL 60637
Argonne National Laboratory, 9700 S. Cass Avenue, Argonne, IL, USA 60439
NIST Quantum Devices Group, 325 Broadway Mailcode 817.03, Boulder, CO, USA 80305
Departamento de Astronomia y Astrosifica, Pontificia Universidad Catolica, Chile
Department of Physics, McGill University, 3600 Rue University, Montreal, Quebec H3A 2T8, Canada
Department of Astronomy and Astrophysics, Pennsylvania State University, 525 Davey Laboratory, University Park, PA 16802
Department of Physics, University of California, Berkeley, CA 94720
Department of Astronomy, University of Florida, Gainesville, FL 32611
Department of Astrophysical and Planetary Sciences and Department of Physics, University of Colorado, Boulder, CO 80309
Department of Space Science, VP62, NASA Marshall Space Flight Center, Huntsville, AL 35812
Department of Physics, University of California, One Shields Avenue, Davis, CA 95616
Physics Division, Lawrence Berkeley National Laboratory, Berkeley, CA 94720
California Institute of Technology, 1200 E. California Blvd., Pasadena, CA 91125
Steward Observatory, University of Arizona, 933 North Cherry Avenue, Tucson, AZ 85721
Department of Physics, University of Michigan, 450 Church Street, Ann Arbor, MI, 48109
Max-Planck-Institut für extraterrestrische Physik, Giessenbachstr. 85748 Garching, Germany
Physics Department, Center for Education and Research in Cosmology and Astrophysics, Case Western Reserve University, Cleveland, OH 44106
Physics Department, University of Minnesota, 116 Church Street S.E., Minneapolis, MN 55455
Space Telescope Science Institute, 3700 San Martin Dr., Baltimore, MD 21218
Liberal Arts Department, School of the Art Institute of Chicago, 112 S Michigan Ave, Chicago, IL 60603
Department of Physics, Yale University, P.O. Box 208210, New Haven, CT 06520-8120
Berkeley Center for Cosmological Physics, Department of Physics, University of California, and Lawrence Berkeley National Labs, Berkeley, CA 94720
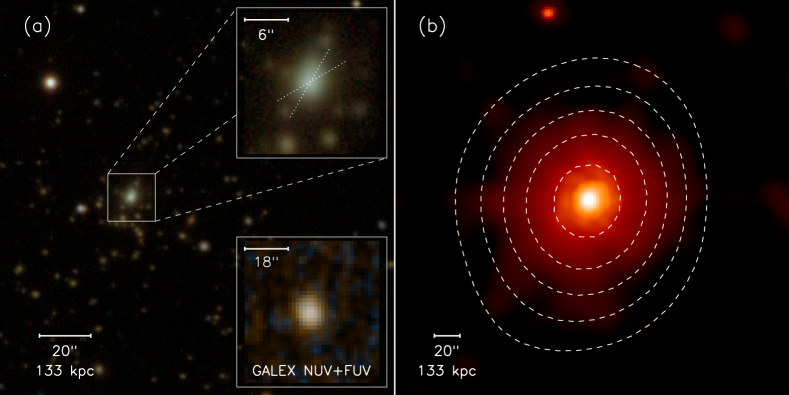
The galaxy cluster SPT-CLJ2344-4243 was discovered by the South Pole Telescope (hereafter SPT[12]) via the Sunyaev-Zel’dovich (SZ) effect, with an initial estimated mass of 16.6 1014 M⊙[11]. These data were supplemented with new broadband optical imaging from the Mosaic II camera on the Blanco 4-m telescope (Figure 1), optical multi-object spectroscopy using GMOS on the Gemini South 8.1-m telescope, optical long-slit spectroscopy using IMACS on the 6.5-m Magellan telescope, near-infrared long-slit spectroscopy using FIRE on the 6.5-m Magellan telescope, mid–far infrared imaging using PACS and SPIRE on the Herschel Space Observatory, and X-ray imaging spectroscopy using the ACIS-I camera on the Chandra X-ray Observatory. Additionally, we have acquired archival near–far UV imaging from the GALEX archives, near–mid infrared imaging from the 2MASS and WISE archives, and 843MHz radio imaging from the SUMSS survey. Further details for these data and their processing can be found in Supplementary Information.
We estimate the mass of SPT-CLJ2344-4243 from the X-ray-measured pressure ( ) of the intracluster medium (ICM), using an externally calibrated pressure-mass (–) relation. The relation was calibrated using a local sample of relaxed clusters from X-ray estimates of the total mass that assumed hydrostatic equilibrium[4]. By iteratively adjusting the value of (where (or ) is the radius for which the enclosed average density is 500 (200) times the critical (average) density of the Universe) such that the – relation is satisfied, we converge on values of = 1.3 Mpc and = 12.6 1014 M⊙. At r200, this corresponds to 25 1014 M⊙, which makes SPT-CLJ2344-4243 amongst the most massive known clusters in the Universe[14, 15]. The GMOS multi-object spectroscopy of 26 galaxies exhibiting only absorption features yielded a robust biweight estimate of the redshift ( = 0.596 0.002) and velocity dispersion (1700 km s-1), the latter being consistent with the picture of an extremely massive cluster. The velocity distribution is consistent with a Gaussian distribution, but the limited number of redshifts does not preclude velocity substructure or multimodality. The smooth X-ray isophotes suggest that the cluster may be relaxed, and while the cluster member velocity distribution is consistent with an undisturbed cluster, the velocity data lack the statistical power to robustly constrain the cluster’s dynamical state.
The integrated rest-frame 2–10 keV X-ray luminosity, = 8.2 1045 erg s-1 within , is greater than any other known cluster in this band. The high central luminosity, which is predominantly cooling radiation, in turn results in a high X-ray cooling rate, as defined by = , where is the mean molecular mass of the ICM. Assuming a cooling radius of 100 kpc (see Supplementary Information), we measure an ICM cooling rate of 3820 530 M⊙ yr-1, making this the strongest cooling flow yet discovered (see Table 1 for comparison to other clusters). The ICM in SPT-CLJ2344-4243 exhibits a significant drop in temperature, accompanied by a rise in the metallicity, in the central 100 kpc, reminiscent of nearby cool core clusters. Furthermore, the short central cooling time ( 1 Gyr), along with the low central entropy (100 keV cm2), resembles nearby “strong” cool cores, such as the Perseus[16] and PKS0745-191[17] clusters. The discovery of a strong cool core at = 0.596 is particularly remarkable as recent X-ray and optical surveys have found a general lack of strong cool cores at 0.4[18, 19, 20], with relatively few exceptions.
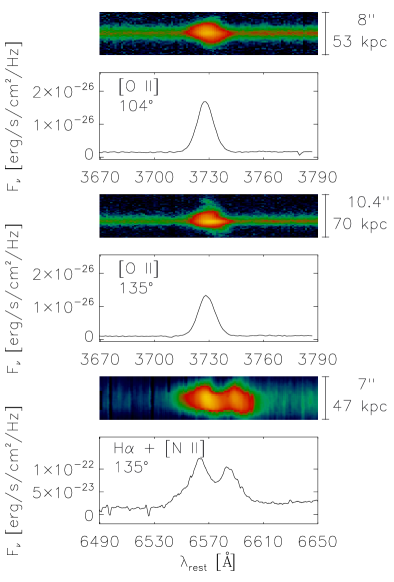
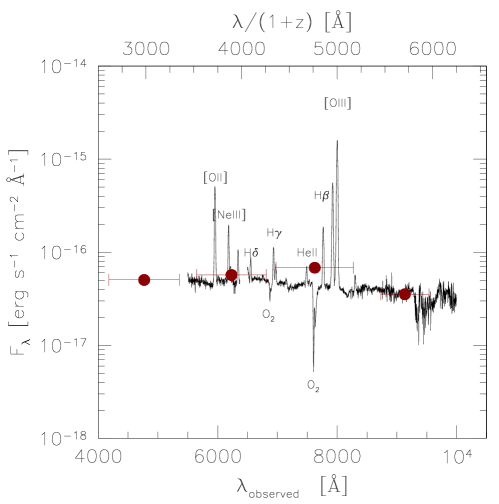
Much like the central galaxies of low- cool core clusters[21, 22, 23], SPT-CLJ2344-4243 exhibits bright, spatially-extended, optical line emission (i.e. [O II], H, [O III], [O I], H, [N II], [S II], etc; Figure 2). We were fortunate to intersect what appears to be an extended filament with one of our randomly-oriented slits, which has a length of 70 kpc. This is similar in extent to the most extended optical filaments in the core of the Perseus cluster[24], and orders of magnitude larger than typical jets in cluster cores (e.g., M87[25]). The diagnostic line ratios [N II]/H, [S II]/H, [O I]/H, [O III]/H, and [O III]/[O II] show evidence for a Seyfert-like AGN in the nucleus of the central galaxy, while at radii 2′′, the optical line ratios resemble those in the star-forming filaments of 0 cool core clusters[16] (see Supplementary Information).
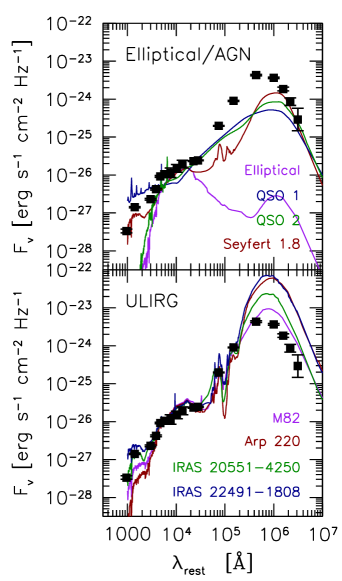
Apart from the exceptionally X-ray high luminosity and central cooling rate, what truly sets this system apart from the majority of nearby galaxy clusters is that there is significant evidence for a dusty starburst in the central galaxy of SPT-CLJ2344-4243. The rest-frame 0.1–500m spectral energy distribution (Figure 3) of the central galaxy most closely resembles that of an ultraluminous, infrared galaxy (ULIRG), which are known for having heavily obscured starbursts (200–1000 M⊙ yr-1) and central AGN. This scenario is corroborated by our observation of significant Balmer reddening ( 0.3) and strong 24–160m emission, combined with signatures of ongoing star formation (near- and far-UV emission, bright nebular emission lines, weak 4000Å break) and a heavily-obscured central AGN ( 0.5, 40 1022 cm-2). Utilizing the full multi-wavelength dataset, which includes X-ray, near–far UV, optical, near–far IR, and radio data, we estimate an extinction-corrected, AGN-subtracted star formation rate of 740 160 M⊙ yr-1, assuming a geometric correction of 45% for the long-slit spectroscopy and an AGN contamination fraction of 40-50% (see Supplementary Information for details).
The presence of extended (70 kpc), morphologically-complex (Figure 2) star-forming filaments coincident with the central galaxy in SPT-CLJ2344-4243 is reminiscent of low- cool core clusters like Perseus and PKS0745-191. However, while these clusters have substantial amounts of star formation (1–20 M⊙ yr-1)[6, 5], this is still orders of magnitude less than predicted by the classical cooling estimates based on the X-ray luminosity (Table 1). This disagreement has become known as the “cooling flow” problem, and it is generally assumed that some form of feedback is responsible for halting the cooling ICM before it reaches the cold phase. SPT-CLJ2344-4243, however, represents an exception to this general trend, of which there are very few[27, 6], where the high star formation rate represents a significant fraction of the massive cooling flow (Table 1). Whatever feedback mechanism is responsible for preventing runaway cooling of the ICM in low-redshift galaxy clusters is clearly operating with a lower efficiency in this system. While the central galaxy hosts an active galactic nucleus (AGN), as evidenced by a hard X-ray point source and strong radio emission (see Supplementary Information), it may be that we are observing this system during a small window in time when the AGN is rapidly feeding off of the cooling flow, but the power output of the AGN has not yet fully coupled to the ICM, and therefore is able to halt a smaller fraction of the total cooling than in typical low-redshift clusters (i.e., Perseus). The fact that systems with such high cooling and star formation rates are not observed at suggests that either this system is entirely unique, or the mechanism which quenches cooling may have been less effective in the early Universe. Further studies of distant, strongly-cooling galaxy clusters are needed to differentiate between these two scenarios.
The high star formation rates inferred from optical line emission and near–far-UV, optical, and mid–far IR continuum emission, combined with the strong signatures of X-ray cooling, suggest that the central galaxy in SPT-CLJ2344-4243 may form a substantial fraction of its stars through an intense, short-lived cooling phase of the intracluster medium. Such strong cooling can not be sustained for a significant amount of time, or both the central galaxy and its supermassive black hole would become too massive, and the central galaxy would have stellar populations considerably younger than those observed in giant elliptical galaxies today. This implies that episodes of strong cooling are short-lived, in contrast to the longer episodes of strong feedback observed in nearby clusters.
References
References
- [1] Lea, S. M., Silk, J., Kellogg, E. & Murray, S. Thermal-Bremsstrahlung Interpretation of Cluster X-Ray Sources. ApJ 184, L105 (1973).
- [2] Cowie, L. L. & Binney, J. Radiative regulation of gas flow within clusters of galaxies - A model for cluster X-ray sources. ApJ 215, 723–732 (1977).
- [3] Fabian, A. C. & Nulsen, P. E. J. Subsonic accretion of cooling gas in clusters of galaxies. MNRAS 180, 479–484 (1977).
- [4] O’Dea, C. P. et al. An Infrared Survey of Brightest Cluster Galaxies. II. Why are Some Brightest Cluster Galaxies Forming Stars? ApJ 681, 1035–1045 (2008). 0803.1772.
- [5] McDonald, M., Veilleux, S., Rupke, D. S. N., Mushotzky, R. & Reynolds, C. Star Formation Efficiency in the Cool Cores of Galaxy Clusters. ApJ 734, 95 (2011). 1104.0665.
- [6] Edge, A. C. The detection of molecular gas in the central galaxies of cooling flow clusters. MNRAS 328, 762–782 (2001). arXiv:astro-ph/0106225.
- [7] McNamara, B. R. & Nulsen, P. E. J. Heating Hot Atmospheres with Active Galactic Nuclei. ARA&A 45, 117–175 (2007). 0709.2152.
- [8] Fabian, A. C. Observational Evidence of AGN Feedback. ArXiv e-prints (2012). 1204.4114.
- [9] Mathews, W. G. Stopping Cooling Flows with Cosmic-Ray Feedback. ApJ 695, L49–L52 (2009). 0903.1135.
- [10] Gómez, P. L., Loken, C., Roettiger, K. & Burns, J. O. Do Cooling Flows Survive Cluster Mergers? ApJ 569, 122–133 (2002).
- [11] Williamson, R. et al. A Sunyaev-Zel’dovich-selected Sample of the Most Massive Galaxy Clusters in the 2500 deg2 South Pole Telescope Survey. ApJ 738, 139 (2011). 1101.1290.
- [12] Carlstrom, J. E. et al. The 10 Meter South Pole Telescope. PASP 123, 568–581 (2011). 0907.4445.
- [13] Vikhlinin, A. et al. Chandra Cluster Cosmology Project. II. Samples and X-Ray Data Reduction. ApJ 692, 1033–1059 (2009). 0805.2207.
- [14] Menanteau, F. et al. The Atacama Cosmology Telescope: ACT-CL J0102-4915 ”El Gordo,” a Massive Merging Cluster at Redshift 0.87. ArXiv e-prints (2011). 1109.0953.
- [15] Foley, R. J. et al. Discovery and Cosmological Implications of SPT-CL J2106-5844, the Most Massive Known Cluster at z1. ApJ 731, 86 (2011). 1101.1286.
- [16] Fabian, A. C. et al. Chandra imaging of the complex X-ray core of the Perseus cluster. MNRAS 318, L65–L68 (2000). arXiv:astro-ph/0007456.
- [17] Allen, S. W., Fabian, A. C. & Kneib, J. P. A combined X-ray and gravitational lensing study of the massive cooling-flow cluster PKS 0745-191. MNRAS 279, 615–635 (1996). arXiv:astro-ph/9506036.
- [18] Vikhlinin, A. et al. Lack of Cooling Flow Clusters at z 0.5. In Böhringer, H., Pratt, G. W., Finoguenov, A. & Schuecker, P. (eds.) Heating versus Cooling in Galaxies and Clusters of Galaxies, 48 (2007). arXiv:astro-ph/0611438.
- [19] Santos, J. S. et al. Searching for cool core clusters at high redshift. A&A 483, 35–47 (2008). 0802.1445.
- [20] McDonald, M. Optical Line Emission in Brightest Cluster Galaxies at 0 z 0.6: Evidence for a Lack of Strong Cool Cores 3.5 Gyr Ago? ApJ 742, L35 (2011). 1110.5904.
- [21] Hu, E. M., Cowie, L. L. & Wang, Z. Long-slit spectroscopy of gas in the cores of X-ray luminous clusters. ApJS 59, 447–498 (1985).
- [22] Heckman, T. M., Baum, S. A., van Breugel, W. J. M. & McCarthy, P. Dynamical, physical, and chemical properties of emission-line nebulae in cooling flows. ApJ 338, 48–77 (1989).
- [23] McDonald, M., Veilleux, S., Rupke, D. S. N. & Mushotzky, R. On the Origin of the Extended H Filaments in Cooling Flow Clusters. ApJ 721, 1262–1283 (2010). 1008.0392.
- [24] Conselice, C. J., Gallagher, J. S., III & Wyse, R. F. G. On the Nature of the NGC 1275 System. AJ 122, 2281–2300 (2001). arXiv:astro-ph/0108019.
- [25] Sparks, W. B., Biretta, J. A. & Macchetto, F. The Jet of M87 at Tenth-Arcsecond Resolution: Optical, Ultraviolet, and Radio Observations. ApJ 473, 254 (1996).
- [26] McDonald, M., Veilleux, S. & Rupke, D. S. N. Optical Spectroscopy of H Filaments in Cool Core Clusters: Kinematics, Reddening, and Sources of Ionization. ApJ 746, 153 (2012). 1111.0006.
- [27] McNamara, B. R. et al. The Starburst in the Abell 1835 Cluster Central Galaxy: A Case Study of Galaxy Formation Regulated by an Outburst from a Supermassive Black Hole. ApJ 648, 164–175 (2006). arXiv:astro-ph/0604044.
- [28] Allen, S. W. The properties of cooling flows in X-ray luminous clusters of galaxies. MNRAS 315, 269–295 (2000). arXiv:astro-ph/0002506.
- [29] Gitti, M. & Schindler, S. XMM-Newton observation of the most X-ray-luminous galaxy cluster RX J1347.5-1145. A&A 427, L9–L12 (2004). arXiv:astro-ph/0409627.
- [30] Polletta, M. et al. Spectral Energy Distributions of Hard X-Ray Selected Active Galactic Nuclei in the XMM-Newton Medium Deep Survey. ApJ 663, 81–102 (2007). arXiv:astro-ph/0703255.
M. McDonald was supported at MIT by NASA through the Chandra X-ray Observatory. The SPT is supported by the National Science Foundation, with partial support provided by the Kavli Foundation, and the Moore Foundation. Support for X-ray analysis was provided by NASA. Work at McGill is supported by NSERC, the CRC program, and CIfAR, and at Harvard by NSF. S. Veilleux acknowledges a Senior NPP Award held at the NASA Goddard Space Flight Center. R. Keisler acknowledges a NASA Hubble Fellowship, B.A. Benson a KICP Fellowship, M. Dobbs an Alfred P. Sloan Research Fellowship, and O. Zahn a BCCP fellowship.
M. McDonald reduced the X-ray and optical long slit spectroscopic data, performed the main analysis, and wrote the paper, with significant assistance from B. Benson, R. Foley, and S. Veilleux, and comments from all other authors. M. Bayliss and J. Ruel reduced multi-slit observations of SPT-CLJ2344-4243 and performed the velocity dispersion analysis. P. Sullivan and R. Simcoe obtained the infrared spectroscopy, and P. Sullivan reduced these data. All other authors (listed alphabetically) have contributed as part of the South Pole Telescope collaboration, by either their involvement with the initial cluster discovery in the SZ and/or multi-wavelength follow-up.
Reprints and permissions information is available at www.nature.com/reprints. The authors declare that they have no competing financial interests. Correspondence and requests for materials should be addressed to M. McDonald (email: mcdonald@space.mit.edu).
| Cluster | z | L2.0-10.0keV | kT | dM/dt | SFR | |
|---|---|---|---|---|---|---|
| [1044 erg/s] | [keV] | [M⊙/yr] | [M⊙/yr] | |||
| Perseus | 0.0179 | 11 | 5.5 | 556 | 37 | 0.07 |
| PKS0745-191 | 0.1028 | 29.5 | 6.71 | 1455 | 20 | 0.01 |
| Zw 3146 | 0.2906 | 36.9 | 6.4 | 2228 | 79 | 0.04 |
| RX J1347.5-1145 | 0.451 | 60 | 10.0 | 1900 | 23 | 0.01 |
| SPT-CLJ2344-4243 | 0.596 | 82 | 13.0 | 3820 530 | 740 160 | 0.19 0.05 |
Supplementary Information
1 Observations, Data Reduction, and Analysis
1.1 X-ray Data:
Our data reduction pipeline was adapted from earlier work[2, 3] and includes the removal of flares, estimation of background from blank sky fields, and calibration using the latest set of corrections. From the cleaned image, an X-ray spectrum was extracted over the energy range 0.5–8.0 keV within an annulus defined as 0.15r500 r r500, excluding point sources, with the initial assumption that r500 = 1.0 Mpc. We fit this spectrum using a combined WABS(MEKAL) model, which accounts for Galactic absorption in the emission spectrum of a hot, diffuse gas. This fit yields a temperature (TX) and gas mass (Mg), which are combined to give the mass proxy YX Mg TX. Assuming the following scaling relation[4]:
| (1) |
we can then infer M500, which leads to a new value of r500 based on its definition:
| (2) |
This process is iterated until changes in are small. From the final estimate of M500, we can extrapolate M200 (which, by convention, uses the average density of the Universe, rather than the critical density) assuming that the dark matter halo has an NFW profile with a concentration following the mass-concentration relation[5]. At this point, we measure TX within the aperture 0.15r500 r r500, and LX and Mg within the aperture 0 r r500, which are used as the final global quantities.
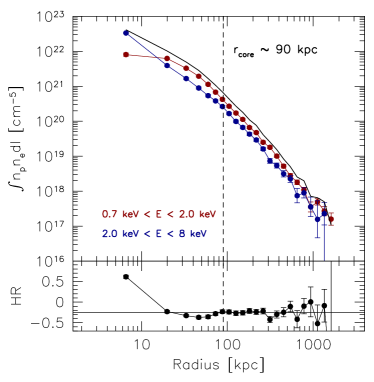
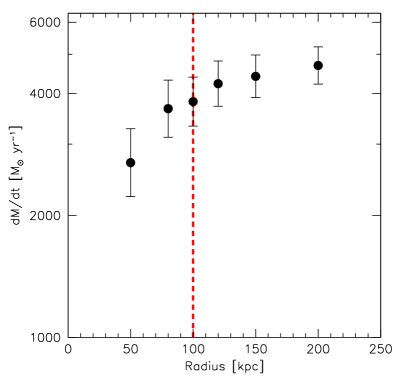
To determine an inner characteristic radius, we compute the hard (2.0–8.0 keV) and soft (0.7–2.0 keV) X-ray surface brightness profiles, as shown in Figure S.1. From this plot, it is clear that the central 10 kpc is dominated by a hard X-ray point source, likely an AGN, and then the hardness ratio reaches a minimum over the range 10–100 kpc, before settling to a roughly constant value from 100–1300 kpc. This inner region with excess soft X-ray emission defines the cool core, with a cooling radius of 100 kpc. Further, the right panel of Figure S.1 shows that the classical cooling rate does not increase substantially by including emission from r 100 kpc, suggesting that the cool core is confined to r 100kpc.
 |
 |
We extracted spectra in the logarithmically-spaced annuli 0 r 100 kpc (cool core), 100 kpc r 450 kpc, and 450 kpc r 1300 kpc in order to determine the gas temperature (TX), electron density (ne), and metallicity (Z) as a function of radius. In the central bin, we masked the inner 1.5′′ in order to remove contributions to the spectrum from the AGN. These spectra were fit with a model combining Galactic absorption (WABS) and hot, diffuse gas (MEKAL). The specific entropy (K = TX n) and cooling time (tcool = 108 Gyr) were also inferred from the model fit to the spectrum in each annulus.

The projected temperature and metallicity profiles show a rise in metallicity accompanied by a dip in temperature in the central 100 kpc, as seen in cool core clusters at z 0. Despite the fact that these data have not been corrected for projection, which means that a significant amount of emission from hot gas at large radius is contributing to the spectrum extracted from the central aperture, the cooling time in the inner 100 kpc is 1 Gyr. This short central cooling time, along with the low (100 keV cm2) central entropy, resembles nearby strong cool cores, such as the Perseus and PKS0745-191 clusters.
The classical cooling rate was estimated from the equation, = , using the total X-ray luminosity and temperature within the central 100 kpc[6]. As shown in Figure S.1, this estimate is relatively insensitive to the choice of radius for r 100 kpc. We find dM/dtclassical = 3820 530 M⊙ yr-1. The available X-ray spectra are of insufficient depth to estimate the cooling rate spectroscopically and thus we are unable to measure the “instantaneous” cooling rate. However, the classical, steady-state, cooling rate is still valuable for comparison to low- clusters and as an upper limit to the “true” cooling rate.
1.2 Infrared Imaging
Snapshot Herschel PACS images were obtained at 70 and 160m with a total exposure time of 30 minutes as part of a Director’s Discretionary Time project (PI: M. Bayliss). In these short exposures, the central galaxy was detected at flux levels of 432 21 mJy and 364 18 mJy, at 70 and 160m, respectively.
Herschel SPIRE maps at 250, 350 and 500m were observed as part of the “Herschel Lensing Survey” (HLS; PI: E. Egami) snapshot program covering 148 SPT clusters. The SPIRE data consists of a single repetition map, with coverage complete to a cluster-centric radius of 5 arcmin. The maps were produced via the standard reduction pipeline HIPE v9.0, the SPIRE Photometer Interactive Analysis (SPIA) package v1.7, and the calibration product v8.1, with improved treatment of the baseline removal (also known as ‘de-striping’).
To characterize the far-IR SED, we fit a blackbody law, modified with a spectral emissivity that varies physically such that the dust opacity reaches unity at frequency [7]:
| (3) |
Here, is the Planck function. We fix the spectral index of the emissivity to , and the critical frequency to THz. The dust temperature and the amplitude are left as free parameters. We exclude photometric data at wavelengths shorter than rest wavelength (including 70, 160, 250, 350, 500 m data from Herschel PACS and SPIRE) so we can fit only to the cold dust component, which should be more free of AGN contamination and better trace the dust heated by star formation. Our best fit gives K and , with .
1.3 Optical Spectroscopy:
Long-slit optical spectra at two different orientations (104∘ and 135∘) with a 1.2′′ slit width were obtained using the IMACS spectrograph on the Baade 6.5m telescope, using the 200 lines/mm grism, which provides 2.0Å/pixel spectral resolution over the wavelength range 3900Å–10000Å. The seeing during these observations was 0.7′′. These spectra were reduced using standard IRAF tasks to remove the bias and overscan, flat field, remove sky lines, and perform wavelength calibration based on arc lamp spectra. The LA Cosmic software[8] was used to mask cosmic rays before combining exposures. Flux calibration was performed by measuring the , , , flux within a 1.2′′1.2′′ box centered on the central galaxy nucleus from the broadband imaging, and forcing the spectrum, extracted from a boxcar with the same spatial and spectral dimensions, to pass through these points. The final reduced spectrum in a 1.2′′1.2′′ extraction region is shown in Figure S.3.
The velocity dispersion for SPT-CLJ2344-4243 is estimated from cluster member galaxy recession velocities that were measured using the Gemini Multi-Object Spectrograph (GMOS) as a part of a large NOAO survey program (PI: C. Stubbs) to measure velocity dispersions for 100 SPT galaxy clusters. Galaxies were prioritized for MOS slits based on proximity to the red-sequence and magnitude. The raw spectra were bias-subtracted, flat-fielded, wavelength calibrated, and mapped to a common mosaic grid using the gemini.gmos IRAF package. The reduced 2D spectral exposures were sky-subtracted, extracted, stacked, and flux calibrated relative to LTT 1788 using custom IDL routines that make use of the XIDL package111http://www.ucolick.org/~xavier/IDL/. Velocity measurements were made using the RVSAO[9] package with the fabtemp97 template. The final histogram of velocities, along with the biweight estimate of the redshift and velocity dispersion, are shown in Figure S.4.

1.4 Near-Infrared Spectroscopy
A near-infrared spectrum of SPT-CLJ2344-4243 was obtained with the Folded-port Infrared Echellette (FIRE) spectrograph at the Magellan Baade telescope in late January, 2012. FIRE delivers spectra between microns in a single-object, cross-dispersed setup[10]. A 10-minute on-target exposure with 0.9′′ seeing produced the data presented in Figure S.5.
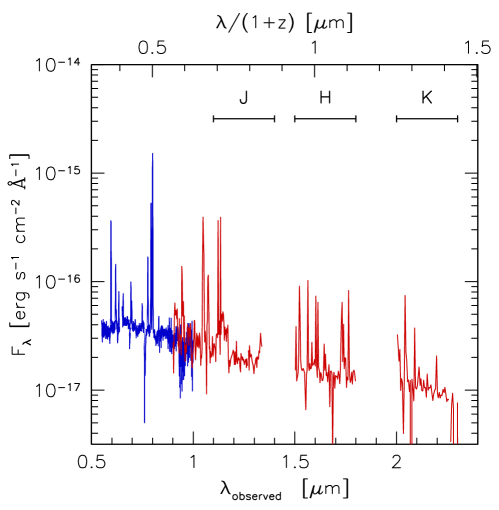
For the extraction of point sources, FIRE’s reduction pipeline (FIREHOSE) nominally creates a 2-dimensional sky model derived from the portions of the slit that are not illuminated by the source. This way, the sky flux is measured simultaneously with the object flux. Since the spatial extent of SPT-CLJ2344-4243 fills FIRE’s -long echelle slit, a separate 10-minute sky exposure had to be obtained and subtracted from the object frame prior to extraction of the spectrum. The variability in the sky over the fifteen minutes between the object and sky exposures can introduce uncertainties into the extracted object spectrum, particularly near hydroxyl (OH) lines. Fortunately, the OH lines subtract with few residuals in the vicinity of the H emission.
Flux calibration was performed by obtaining the spectrum of an A0V star with an airmass, angular position, and observing time as close to the target as possible. Telluric absorption was corrected[11] via the xtellcor procedure released with the spextool pipeline[12].
Since FIRE operates in quasi-Littrow mode, the spectral orders are significantly curved and tilted with respect to the detector’s pixel basis. Hence, producing a spatial by spectral image of SPT-CLJ2344-4243 required a separate boxcar extraction of the object spectrum for each spatial position. A boxcar width of was selected to match the spatial scale of IMACS. Each of the spectral strips produced from these extractions were telluric-corrected with the observation of an AOV standard.
2 Optical Line Ratios
In order to understand the origin of the bright emission lines observed in SPT-CLJ2344-4243, we appeal to a variety of optical emission line ratios which are traditionally used to separate HII regions from AGN of different types[13, 14, 15]. In particular, we can differentiate using line ratios between those typically observed in Seyfert galaxies and low-ionization nuclear emission-line regions (LINERs). In the upper panels of Figure S.6 we show the [O III] 5007/H ratio as a function of [N II] 6583/H, [S II] 6716,6731/H, and [O I] 6300/H for the inner 3′′. We are limited to small radii in these panels due to the small width (6′′) of the FIRE echelle slit. These line ratios confirm that there is a strong AGN in the central region of SPT-CLJ2344-4243, consistent with the hard X-ray and strong radio emission. However, the [O III]/H ratio declines quickly with radius, such that at a distance of 3′′ (20 kpc) from the nucleus of SPT-CLJ2344-4243, the optical line ratios are similar to those measured in the cool filaments of z0 cool core clusters[16]. In the local Universe, these filaments appear to be ionized by a combination of young stars and shocks, producing LINER-like line ratios[16]. In the lower left panel of Figure S.6, we plot [O III] 5007/[O II] 3726,3729 versus [O I] 6300/H, following Kewley et al.(2006). Again, we find that the nucleus has Seyfert-like line ratios, while the extended emission is LINER-like. At all radii, the [O III]/[O II] ratio is below the range quoted in Ho et al.(2005) for AGN (0.1-0.3), further demonstrating that the ionization in the central region comes from a mix of AGN and starburst.
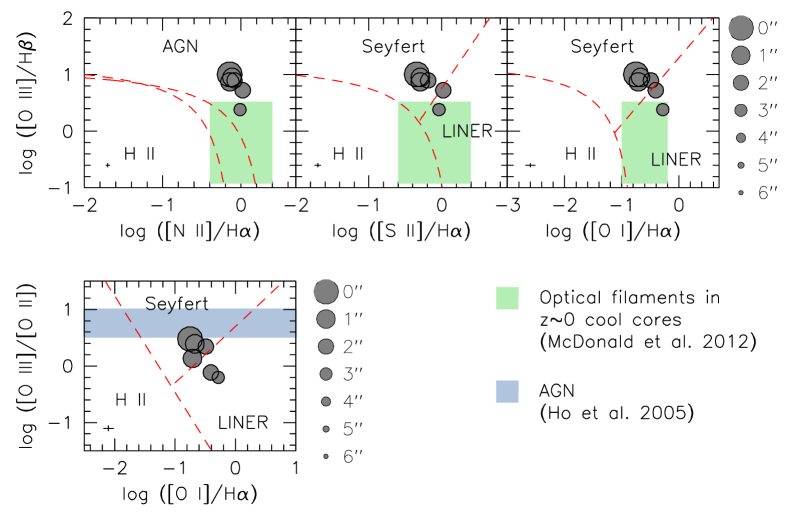
We note that the near-IR spectra have a much smaller slit width (0.6′′ than the optical spectra (1.2′′), which will result in a slight bias to Figure S.6. Since the “nuclear” points from the optical spectra will be sampling large radii than those from the near-IR spectra, we expect the [O III]/H ratio to be biased low at small radii. Using a narrow slit may yield an [O III]/[O II] more consistent with pure AGN (lower left panel of Figure S.6. We stress that the overall trend, with line ratios resembling AGN at small radii and low- emission-line nebulae in cool cores at large radii, would not be caused by the difference in slit widths.
3 Estimating the Star Formation Rate
The broad wavelength coverage of the central galaxy in SPT-CLJ2344-4243 allows for a careful estimate of the star formation rate (SFR) using a variety of different techniques. In order to properly constrain the SFR, we must estimate i) the intrinsic reddening, ii) the contribution to the UV continuum and emission line flux from the central AGN, and iii) the amount of line emission missed by the narrow slit. As an initial estimate, we consider the lower limit case which involves masking the central PSF (removing both the AGN and the central starburst component in the central 1′′), assuming zero intrinsic reddening, and assuming that the slit contains 100% of the extended emission-line flux. Under these assumptions, we calculate a lower limit on the star formation rate from the [O II] line of SFR[OII] 116 M⊙ yr-1. We note that, despite being a lower limit, this is still higher than any of the lower-redshift, strongly-cooling clusters from Table 1.
In order to estimate the amount of intrinsic reddening, we use the relative fluxes of the H, H, and H lines. Assuming case B recombination, we estimate average intrinsic reddening values of E(B-V)γ,β = 0.35 and E(B-V)δ,β = 0.33. Averaging these two values yields our final estimate of the intrinsic reddening of E(B-V) = 0.34. We correct all of our measured line fluxes for this amount of reddening assuming a dust screen model. If, instead, we assumed a mixed dust/emission scenario, the result would imply a larger extinction correction and, thus, a larger inferred star formation rate. Since the emission line gas may be tracing the youngest, most massive stars (e.g., in low-z starburst galaxies), we expect them to be the most highly enshrouded in dust. However, the stars which are producing the strong UV and optical continuum are slightly older and more dispersed than this very young population. This leads to roughly a factor of 50% less extinction in the stellar continuum at H than in the emission line itself[18]. Thus, we correct all broadband optical and UV fluxes assuming a more conservative intrinsic reddening of E(B-V) = 0.17.
Table S.1 lists the SFRs inferred from extinction-corrected H, H, and [O II] emission lines and far-UV, near-UV, optical, and mid–far IR continuum. We assume a Salpeter IMF[19] for all estimates, using the conversions MCha = 0.55MSalp and MKrou = 0.62MSalp. Due to the smaller slit used for the near-IR spectrum, the H-determined SFR is 50% less than the SFR estimated from the [O II] and H emission lines. Excluding this low estimate, we find that 730 M⊙ yr-1, and 1120 M⊙ yr-1. This implies that the slit contains 65% of the total flux from star-forming regions. We find remarkable correspondence between the star formation rates inferred from the rest-frame far-UV (GALEX near-UV), near-UV (IMACS -band), 4000Å break, and WISE 24m emission, suggesting that calibration errors are negligible.
| Method | SFR Estimate | Coverage | Reference | Notes | |
|---|---|---|---|---|---|
| [M⊙ yr-1] | |||||
| H | 426 20 | 0% | Slit | K98 | Small aperture |
| H | 606 40 | 0% | Slit | K98 | |
| O II | 841 75 | 0% | Slit | K04 | |
| FUV | 1401 468 | 0% | Total | RG02 | Implicit Extinction |
| FUV | 1126 105 | 0% | Total | K98,C94 | 50% H/H Extinction |
| NUV | 1132 105 | 0% | Total | K98,C94 | 50% H/H Extinction |
| D4000 | 1960 726 | 0% | Total | B04 | M∗,z = 31012 M⊙ |
| 24m | 1655 711 | 0% | Total | R09 | |
| Far IR | 1642 190 | 0% | Total | K98 | |
| Extended O II | 771 262 | 40 20% | Total∗ | K04 | Inner 1′′ masked |
| O II + O III | 799 232 | 37 18% | Total∗ | K04, H05 | O II/O IIIAGN = 0.2 0.1 |
| FUV + X-ray | 612 207 | 45 17% | Total | K98, C94, E94 | = 1.325 0.075 |
| FIR + X-ray | 774 493 | 51 30% | Total | K98, M11 | |
| Average: | 739 160 | 40-50% | Total∗ | ∗: Assumes that slit contains 65% of total emission | |
To properly remove the contribution from the central AGN to the inferred SFR, we apply four distinct corrections. The first correction, which is the most conservative, involves masking the central 1′′ of the IMACS spectrum. This correction removes both the central AGN and starburst contribution to the total [O II] flux. The second correction, from Ho et al.(2005), assumes that [O II]/[O III]AGN = 0.2 0.1 (see Figure S.6), and that any additional [O II] emission is from ongoing star formation. Our third correction assumes a constant X-ray–UV ratio for the AGN, from Elvis et al.(1994). We model the X-ray spectrum from the central 1.5′′ with a combined plasma and absorbed powerlaw model, allowing an estimate of the unabsorbed X-ray flux from the central AGN, which is then converted to an estimated contribution to the total UV flux. Finally, the last correction employs a scaling relation between the hard X-ray and the total IR luminosity of AGN, from Mullaney et al.(2011), which provides an estimate of AGN contamination in the measured IR luminosity. The results of these four independent methods (Table S.1) yield a range of AGN contamination from 40-50% over a broad range in wavelength.
Combining the above estimates of the intrinsic reddening, the filling-factor of the slit, and the amount of contamination from the central AGN, we find an average SFR of 739 160 M⊙ yr-1. The uncertainty quoted here is a combination of measurement error, along with uncertainty in the amount of intrinsic extinction and the amount of AGN contamination. The relatively small scatter in the SFR estimates from a variety of different methods and wavelengths suggests that this result is robust. However, there are several uncertainties which could conspire to bias this number high. While we expect shocks to contribute to the emission-line spectrum[16], the fact that the IR- and UV-derived SFRs are higher than those from emission line suggests that this contribution is smaller than our uncertainty in the extinction correction. We have assumed case B recombination in estimating the amount of reddening, which may not reflect the true nature of this system. We note, however, that this correction would only change by 2-3% if the reality is closer to case A. Our extinction correction most strongly effects the far-UV data, resulting in a factor of 3.6 correction to the far-UV luminosity. However, we stress that this significant extinction correction is physically motivated, based on the H/H and H/H ratios, the slope of the UV-optical SED, the strong extinction measured in the X-ray, and the strong mid-IR flux. Further, the fact that the empirical SFR estimate from Rosa-Gonzalez et al.(2002) over estimates the SFR compared to our reddening-corrected estimates suggests that our assumption of E(B-V) = 0.17 in the stellar continuum is below average for systems with similar UV luminosity. In order to improve upon the accuracy of this estimate, we require high spatial resolution UV imaging, which is the least sensitive to shocks and would allow us to spatially model and subtract the nuclear component.
The flux in the SPT 1.4 mm data at the position of the BCG is consistent with zero, and a 3 sigma upper limit can be placed at 20.4 mJy. By fitting a range of SEDs to the available data (Figure 3), we estimate the median 1.4 mm flux to be 0.5 mJy, with a 68% confidence interval of 0.2–1.4 mJy, and the median 2.0 mm flux to be 0.1 mJy with a 68% confidence interval of 0.05–0.38 mJy. This level of flux contribution at 2.0 mm would have a negligible effect on SZ flux estimate. We also estimate the contribution to the total X-ray luminosity from the starburst based on scaling relations[27] and find that a starburst of 800 M⊙ yr-1 should have an X-ray luminosity of L2-10keV = 41042 erg s-1, which is less than 0.05% of the total luminosity presented in Table 1. This suggests that the starburst is contributing a negligible fraction of the total X-ray luminosity in the galaxy cluster core.
4 Properties of the Central AGN
The central galaxy in SPT-CLJ2344-4243 appears to host both a strong AGN and a vigorous starburst, both heavily obscured by dust. We summarize the properties of the central AGN in Table S.2. As was mentioned previously, the central point source has high [O III]/H and [O III]/[O II], suggesting a strong Seyfert-like AGN. Consistent with low-redshift cool core clusters, the central galaxy is radio loud (Lν = 1042 erg s-1)[28], with a radio luminosity that is similar to those of BCGs in low-z cool cores (e.g., Abell0780, Abell2052), despite orders of magnitude more cooling. This relatively low radio luminosity compared to the cooling luminosity may explain why this cluster appears to be forming stars at such a large fraction of the classical cooling rate. The hard X-ray luminosity of the AGN (L2-10keV) suggests an accretion rate of = = 58 M⊙ yr-1, assuming a black hole accretion efficiency of = 0.1 and a bolometric correction factor (Lbol/L2-10keV) of 110[29]. This accretion rate represents a small fraction (2%) of the total cooling rate, suggesting that either feedback is preventing the cooling flow from efficiently accreting onto the central black hole, or the bulk of the cool material is in some unobserved phase (e.g., cold molecular gas).
| Lν,radio | 1042 erg s-1 | (843MHz SUMMS survey) |
| L2-10keV | 31045 erg s-1 | (unobscured X-ray luminosity) |
| LIR | 1.51046 erg s-1 | (assume AGN is 40% of total IR flux) |
| Ṁacc | 58 M⊙ yr-1 | (assume Lbol/LX = 110†, = 0.1) |
| AV,AGN | 1.5 mag | (Balmer extinction) |
| nH,AGN | 391022 cm-2 | (X-ray absorption) |
| †: Marconi et al.(2004) |
Based on scaling relations[30] between the total spheroid stellar mass (M∗, assuming the spheroid luminosity is equal to the total luminosity) and black hole mass (MBH), we naively estimate the supermassive black hole in the central galaxy to have a mass of MBH 1.8 1010 M⊙, which is at the high end of masses seen in the cores of massive galaxy clusters. This high mass would imply that the aforementioned accretion rate of 58 M⊙ yr-1 is 15% of the Eddington rate.
References
References
- [1]
- [2] Vikhlinin, A. et al. Chandra Temperature Profiles for a Sample of Nearby Relaxed Galaxy Clusters. ApJ 628, 655–672 (2005). arXiv:astro-ph/0412306.
- [3] Andersson, K. et al. X-Ray Properties of the First Sunyaev-Zel’dovich Effect Selected Galaxy Cluster Sample from the South Pole Telescope. ApJ 738, 48 (2011). 1006.3068.
- [4] Vikhlinin, A. et al. Chandra Cluster Cosmology Project. II. Samples and X-Ray Data Reduction. ApJ 692, 1033–1059 (2009). 0805.2207.
- [5] Duffy, A. R., Schaye, J., Kay, S. T. & Dalla Vecchia, C. Dark matter halo concentrations in the Wilkinson Microwave Anisotropy Probe year 5 cosmology. MNRAS 390, L64–L68 (2008). 0804.2486.
- [6] O’Dea, C. P. et al. An Infrared Survey of Brightest Cluster Galaxies. II. Why are Some Brightest Cluster Galaxies Forming Stars? ApJ 681, 1035–1045 (2008). 0803.1772.
- [7] Blain, A. W., Barnard, V. E. & Chapman, S. C. Submillimetre and far-infrared spectral energy distributions of galaxies: the luminosity-temperature relation and consequences for photometric redshifts. MNRAS 338, 733–744 (2003). arXiv:astro-ph/0209450.
- [8] van Dokkum, P. G. Cosmic-Ray Rejection by Laplacian Edge Detection. PASP 113, 1420–1427 (2001). arXiv:astro-ph/0108003.
- [9] Kurtz, M. J. & Mink, D. J. RVSAO 2.0: Digital Redshifts and Radial Velocities. PASP 110, 934–977 (1998). arXiv:astro-ph/9803252.
- [10] Simcoe, R. A. et al. The FIRE infrared spectrometer at Magellan: construction and commissioning. In Society of Photo-Optical Instrumentation Engineers (SPIE) Conference Series, vol. 7735 of Society of Photo-Optical Instrumentation Engineers (SPIE) Conference Series (2010).
- [11] Vacca, W. D., Cushing, M. C. & Rayner, J. T. A Method of Correcting Near-Infrared Spectra for Telluric Absorption. PASP 115, 389–409 (2003). arXiv:astro-ph/0211255.
- [12] Cushing, M. C., Vacca, W. D. & Rayner, J. T. Spextool: A Spectral Extraction Package for SpeX, a 0.8-5.5 Micron Cross-Dispersed Spectrograph. PASP 116, 362–376 (2004).
- [13] Veilleux, S. & Osterbrock, D. E. Spectral classification of emission-line galaxies. ApJS 63, 295–310 (1987).
- [14] Kewley, L. J., Groves, B., Kauffmann, G. & Heckman, T. The host galaxies and classification of active galactic nuclei. MNRAS 372, 961–976 (2006). arXiv:astro-ph/0605681.
- [15] Trouille, L., Barger, A. J. & Tremonti, C. The OPTX Project. V. Identifying Distant Active Galactic Nuclei. ApJ 742, 46 (2011).
- [16] McDonald, M., Veilleux, S. & Rupke, D. S. N. Optical Spectroscopy of H Filaments in Cool Core Clusters: Kinematics, Reddening, and Sources of Ionization. ApJ 746, 153 (2012). 1111.0006.
- [17] Ho, L. C. [O II] Emission in Quasar Host Galaxies: Evidence for a Suppressed Star Formation Efficiency. ApJ 629, 680–685 (2005). arXiv:astro-ph/0504642.
- [18] Calzetti, D., Kinney, A. L. & Storchi-Bergmann, T. Dust extinction of the stellar continua in starburst galaxies: The ultraviolet and optical extinction law. ApJ 429, 582–601 (1994).
- [19] Salpeter, E. E. The Luminosity Function and Stellar Evolution. ApJ 121, 161–+ (1955).
- [20] Brinchmann, J. et al. The physical properties of star-forming galaxies in the low-redshift Universe. MNRAS 351, 1151–1179 (2004). arXiv:astro-ph/0311060.
- [21] Elvis, M. et al. Atlas of quasar energy distributions. ApJS 95, 1–68 (1994).
- [22] Kennicutt, R. C., Jr. Star Formation in Galaxies Along the Hubble Sequence. ARA&A 36, 189–232 (1998). arXiv:astro-ph/9807187.
- [23] Kewley, L. J., Geller, M. J. & Jansen, R. A. [O II] as a Star Formation Rate Indicator. AJ 127, 2002–2030 (2004). arXiv:astro-ph/0401172.
- [24] Mullaney, J. R., Alexander, D. M., Goulding, A. D. & Hickox, R. C. Defining the intrinsic AGN infrared spectral energy distribution and measuring its contribution to the infrared output of composite galaxies. MNRAS 414, 1082–1110 (2011). 1102.1425.
- [25] Rieke, G. H. et al. Determining Star Formation Rates for Infrared Galaxies. ApJ 692, 556–573 (2009). 0810.4150.
- [26] Rosa-González, D., Terlevich, E. & Terlevich, R. An empirical calibration of star formation rate estimators. MNRAS 332, 283–295 (2002). arXiv:astro-ph/0112556.
- [27] Ranalli, P., Comastri, A. & Setti, G. The 2-10 keV luminosity as a Star Formation Rate indicator. A&A 399, 39–50 (2003). arXiv:astro-ph/0211304.
- [28] Mauch, T. et al. SUMSS: a wide-field radio imaging survey of the southern sky - II. The source catalogue. MNRAS 342, 1117–1130 (2003). arXiv:astro-ph/0303188.
- [29] Marconi, A. et al. Local supermassive black holes, relics of active galactic nuclei and the X-ray background. MNRAS 351, 169–185 (2004). arXiv:astro-ph/0311619.
- [30] Bennert, V. N., Auger, M. W., Treu, T., Woo, J.-H. & Malkan, M. A. A Local Baseline of the Black Hole Mass Scaling Relations for Active Galaxies. I. Methodology and Results of Pilot Study. ApJ 726, 59 (2011). 1008.4602.
- [31] Vasudevan, R. V. & Fabian, A. C. Piecing together the X-ray background: bolometric corrections for active galactic nuclei. MNRAS 381, 1235–1251 (2007). 0708.4308.