The G-O Rule and Waldmeier Effect in the Variations of the Numbers of Large and Small Sunspot Groups
Abstract
We have analysed the combined Greenwich and Solar Optical Observing Network (SOON) sunspot group data during the period of 1874 – 2011 and determined variations in the annual numbers (counts) of the small (maximum area millionth of solar hemisphere, msh), large ( msh), and big ( msh) spot groups. We found that the amplitude of an even-numbered cycle of the number of large groups is smaller than that of its immediately following odd-numbered cycle. This is consistent with the well known Gnevyshev and Ohl rule or G-O rule of solar cycles, generally described by using the Zürich sunspot number (). During cycles 12 – 21 the G-O rule holds good for the variation in the number of small groups also, but it is violated by cycle pair (22, 23) as in the case of . This behavior of the variations in the small groups is largely responsible for the anomalous behavior of in cycle pair (22, 23). It is also found that the amplitude of an odd-numbered cycle of the number of small groups is larger than that of its immediately following even-numbered cycle. This can be called as ‘reverse G-O rule’. In the case of the number of the big groups, both cycle pairs (12, 13) and (22, 23) violated the G-O rule. In many cycles the positions of the peaks of the small, large, and big groups are different and considerably differ with respect to the corresponding positions of the peaks. In the case of cycle 23, the corresponding cycles of the small and large groups are largely symmetric/less asymmetric (Waldmeier effect is weak/absent) with their maxima taking place two years later than that of . The corresponding cycle of the big groups is more asymmetric (strong Waldmeier effect) with its maximum epoch taking place at the same time as that of .
1 Introduction
Studies on variations in solar activity are important for understanding the mechanism behind the solar activity and solar cycle, and also for predicting the level of activity [Hathaway (2009), Petrovay (2010)]. The properties of solar cycle are generally described by the Zürich or international sunspot number, , where is a correction factor for the observer, is the number of identified sunspot groups, and is the number of individual sunspots. Several other solar activity indices well correlate with [Hathaway and Wilson (2004)]. However, there are noticeable differences in the epochs of the peaks of and other activity indices in some solar cycles (, see \inlineciterr08 and references therein). It seems there are also considerable differences between the epochs of the maxima of sunspot cycles and the corresponding cyclic variations in the sunspot field strength [Pevtsov et al. (2011)]. It is believed that the area of a sunspot or a sunspot group has a better physical significance than because the area is a better measure (proxy) of solar magnetic flux than [Dikpati and Gilman (2006)]; an area of 130 msh (millionths of solar hemisphere; 1 msh km2) corresponds approximately to Mx (maxwell) [Wang and Sheeley (1989)]. There exists a high correlation between solar cycle variations of and sunspot area [Hathaway, Wilson, and Reichmann (2002), Hathaway and Wilson (2004)]. There are some minor but noticeable differences in the variations of and sunspot group area. \inlinecitedgt08 reported that the well-known Waldmeier effect (inverse relationship between the rise time and the amplitude of a cycle) does not exist in the case of sunspot area. The epochs of the maxima of some cycles of sunspot number and sunspot area are different. For example, in case of cycle 23, the epoch of maximum of the sunspot number was in 2000, whereas the maximum of the sunspot area was in 2002 [Ramesh (2010), Javaraiah (2012)].
The sunspot cycles are numbered in chronological order from the cycle that started from the year 1755, and are known as Waldmeier cycle numbers. Many characteristics of sunspot cycles are known (see \opencitehw04). Usually the time series is used to reveal most of the characteristics of the solar cycle. However, Hoyt and Schatten (1988a, 1988b) devised a number index based solely on the number of observed sunspot groups. The group sunspot number, , gives a more complete and longer data set than Hathaway, Wilson, and Reichmann (2002); Hathaway and Wilson (2004), but the time series ended in 1995. None of the characteristics of the solar cycle is fully understood so far. One of the most prominent and fundamental characteristics is the differences in the amplitudes and the lengths of different solar cycles. According to the well-known Gnevyshev-Ohl rule Gnevyshev and Ohl (1948) or G-O rule, the amplitude of an odd-numbered cycle is higher than that of the preceding even-numbered cycle. However, there are instances of violation of this rule, viz, cycle pairs (4, 5), (8, 9), and (22, 23). So far no plausible method is available to predict the violation of the G-O rule (except that it may be possible from the epochs of the retrograde motion of the Sun about the solar system barycenter, as suggested by \inlinecitejj05). Using the data on sunspot groups during the period 1879 – 2004, \inlinecitejbu05a found that the solar equatorial rotation rate during an odd–numbered sunspot cycle correlates well with the equatorial rotation rate of the preceding even–numbered sunspot cycle, which is similar to the G-O rule in sunspot activity. They also found that the latitudinal gradient of solar rotation during an even–numbered cycle correlates well with that of the preceding odd–numbered cycles. These results seem to imply that the G-O rule is related to the basic mechanism of solar activity and solar cycle.
Typical sizes of sunspots range from 10 to msh. Although single sunspots are common, the majority of sunspots belong to sunspot groups. Sunspot groups are often large and complex. It is generally believed that large sunspot groups also live long. In fact, there is a rule of proportionality between the maximum area () of a sunspot group and its life time () (first noticed by \inlinecitegne38 and formulated by \inlinecitewald55; see also \opencitepvd97): . However, the relationship between the area and the life time of sunspot groups may be exponential rather than linear Javaraiah (2003a). Properties such as the rotation rate, meridional motion, tilt angle, etc., of sunspots and sunspot groups depend on their life time and size as well as their age (, \opencitewar65, 1966; \opencitehgg84; \opencitebal86; \opencitejg97; \opencitejj99; \opencitesiva07). Studies on these properties of sunspot groups may provide information on the subsurface dynamics of the Sun (, \opencitehow96; \opencitejg97; \opencitekmh02; \opencitesiva03, 2007, 2010). Therefore, the studies on the variations in the numbers (counts) of sunspots and sunspot groups in different sizes look to be important for understanding the basic mechanism of solar activity and solar cycle, and also the relationship between sunspots and other activity indices (, \opencitekilc11; \opencitecl12). In the present paper we have analyzed the sunspot group data during the period 1874 – 2011 and studied the variations in the annual numbers of sunspot groups of different sizes. Particularly we have concentrated on the G-O rule and the Waldmeier effect in the variations of small and large sunspot groups, and their implications.
In the next section we will describe the data and the method of analysis. In Section 3 we will describe the results and in Section 4 we will present conclusions and a brief discussion.
2 Data and Analysis
Here we have used Greenwich and Solar Optical Observing Network (SOON) sunspot group data during the period of May 1874 to May 2011 (taken from http://solarscience.msfc.nasa.gov/greenwch.shtml). These data include the observation time (the Greenwich data contain the date with the fraction of a day, in the SOON data the fraction is rounded to 0.5 day), heliographic latitude () and longitude (), central meridian distance (CMD), and corrected umbra and whole-spot areas (in msh), etc., of sunspot groups for each day of observation. The positions of the groups are geometrical positions of the centers of the groups. The Greenwich data (May 1874 to December 1976) have been compiled from the majority of the white light photographs which were secured at the Royal Greenwich Observatory and at the Royal Observatory, Cape of Good Hope. The gaps in their observations were filled with photographs from other observatories, including the Kodaikanal Observatory, India. The SOON data (January 1977 to May 2011) include measurements made by the United States Air Force (USAF) based on sunspot drawings obtained by a network of the observatories in Boulder, Hawaii, and so on. David Hathaway scrutinized the Greenwich and SOON data and produced a reliable continuous data series from 1874 up to date. In case of SOON data, we increased area by a factor of 1.4. David Hathaway found this correction was necessary to have a combined homogeneous Greenwich and SOON data (see the aforementioned web-site of David Hathaway). The combined Greenwich and SOON sunspot group data are the largest available, reliable data that include the positions and areas of sunspot groups.
If , ,…, denote the areas (corrected for the foreshortening effect) of all the sunspots in a sunspot group observed at times , ,…, during the life time of the sunspot group (days), then the maximum area is defined as ), where . We have used here only the sunspot groups which had days. On the basis of values we have classified sunspot groups into three classes as follows: small sunspot groups (SSGs: msh), large sunspot groups (LSGs: msh), and big sunspot groups (BSGs: msh). We used the data on only those sunspot groups whose birth and death occurred within a disc passage. That is, we have not used the sunspot groups whose central meridian distance in any day of their respective life times. This reduces the foreshortening effect and helps to obtain the maximum area of a sunspot group unambiguously. Each appearance of a recurrent group is treated as an independent group. Thus, days. We determined the numbers (counts) NSGs, NLGs, and NBGs of SSGs, LSGs and BSGs, respectively, for each year during the period 1874 – 2011.
3 Results
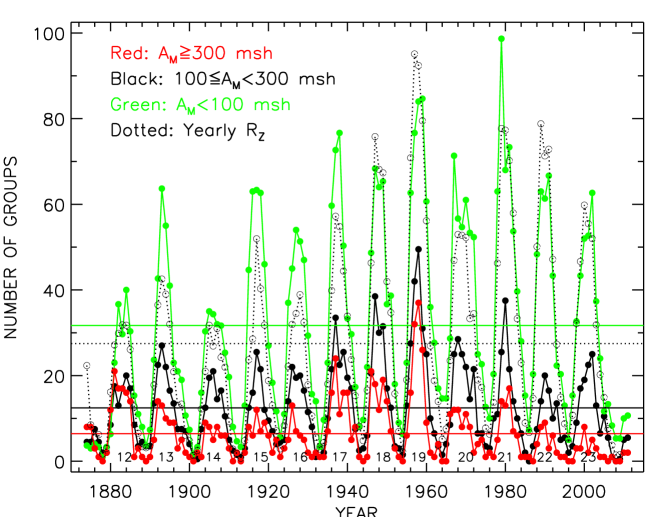
Figure 1 shows the variations in the annual NSGs, NLGs, and NBGs during the period 1874 – 2011. In the same figure we have also shown the variation of annual taken from the website, ftp://ftp.ngdc.noaa.gov/STP/SOLAR_DATA/SUNSPOT_NUMBERS/INTERNATIONAL/yearly/YEAR.PLT). As can be seen in this figure, each of these parameters shows the 11-year period solar cycle variation. Further, there is an indication that as the size of the group decreases its counts increase. That is, in most of the time the curve of NLGs is above the curve of NBGs and the curve of NSGs is above that of NLGs. This is consistent with the well-known result that the smallest regions dominate the global flux emergence rate (\opencitezirin87). At the epoch of the maximum of cycle 21 the NSGs is largest, , there the NSGs is larger than even the NSGs is at the epoch of the maximum of the largest solar cycle, 19. Recently, \inlinecitekilc11 analyzed the Rome Observatory sunspot group data for solar cycles 20 and 21 and Learmonth Solar Observatory data for cycles 22 and 23. By using the Zurich classification of the sunspot groups, these authors found that in cycle 23 the number of large sunspot groups is higher when compared to those for cycle 22. A similar tendency can be seen in Figure 1, i.e., the peak in NLGs of cycle 22 is smaller than the corresponding peak of cycle 23 (the peak in NBGs of cycle 22 is only slightly larger than that of cycle 23). Hence, the aforementioned result that was found by \inlinecitekilc11 is confirmed here. In fact, in this figure one can see that the amplitude of an even–numbered cycle seen in NLGs is smaller than that of its immediately following odd–numbered cycle. This relationship of even- and odd–numbered cycles is consistent with the well-known G-O rule of modulation in the amplitudes of solar cycles. In the case of cycle pair (22, 23) violated this rule, but in the case of NLGs cycle pair (22, 23) satisfied it. The behavior of NSGs is similar to the behavior of . However, in the case of the former we can see another striking systematic behavior that did not exist in the case of the latter. That is, the amplitude of an odd–numbered cycle in NSGs is larger than that of its immediately following even–numbered cycle, a behavior that is opposite to the G-O rule. This ‘reverse G-O rule’ indicates that in the case of NSGs the amplitude of the current cycle 24 will be smaller than the previous cycle 23. In the case of NBGs the G-O rule is violated by both cycle pairs (12, 13) and (22, 23) [the amplitude of cycle 22 is only slightly larger (almost equal) than that of cycle 23], but this is not reflected in because in a given time interval NBGs is considerably smaller than NSGs ( gives an equal weight to all sunspots and to all sunspot groups (, \opencitecl12)). The same is true in the case of NLGs during cycles 22 and 23, where violated the G-O rule and NLGs satisfied it. The ‘reveres G-O rule’ does not exist in the amplitude modulations of NLGs and NBGs cycles. However, because of possibly insufficient size of data, it may be cautioned that all the results above are only suggestive rather than compelling.
In Figures 2, 3, and 4 we have compared the variations in the annual NSGs, NLGs, and NBGs, respectively, in different solar cycles. Table 1 shows the positions of the peaks of NSGs, NLGs, and NBGs with respect to the positions of the corresponding peaks of cycles 12 – 23, obtained from Figures 2 – 4. In this table it can be seen that in many cycles the positions of the peaks of NSGs, NLGs, and NBGs are different and they also considerably deviate from the corresponding positions of the peaks. In the case of the largest solar cycle 19, the positions of the peaks of all the three classes of the sunspot groups are the same, , they occurred at one year later than the peak of (a similar behavior is also seen in the amounts (annual rates) of the growth and decay of sunspot groups (\opencitejj12)). A negative value of the position of the peak of a given class of groups implies that the 11-year cycle of this class of groups is more asymmetric (strong Waldmeier effect) than the corresponding cycle of . In the case of cycle 23, the corresponding cycles in NSGs and NLGs were largely symmetric (or less asymmetric), namely the Waldmeier effect was weak or absent, and the corresponding cycle in NBGs was more asymmetric (strong Waldmeier effect). The extended declining phase (, beyond the length of a normal cycle) of this long cycle 23 included only small sunspot groups. The occurrence of big groups stopped much earlier, in 2004. \inlinecitekilc11 found that the numbers of small and large sunspot groups show similar time variations during cycle 22, and cycles 20, 21, and 23 show different behavior. Namely, the peak of NSGs was during the first maximum of and that NLGS was at the second maximum of . In Table 1 it can be seen that this result is applicable only to cycle 21. It may be suggested that small sunspot groups substantially contributed to the second peak in of cycle 23. Thus, the aforementioned result in \inlinecitekilc11 is not confirmed in the present analysis.
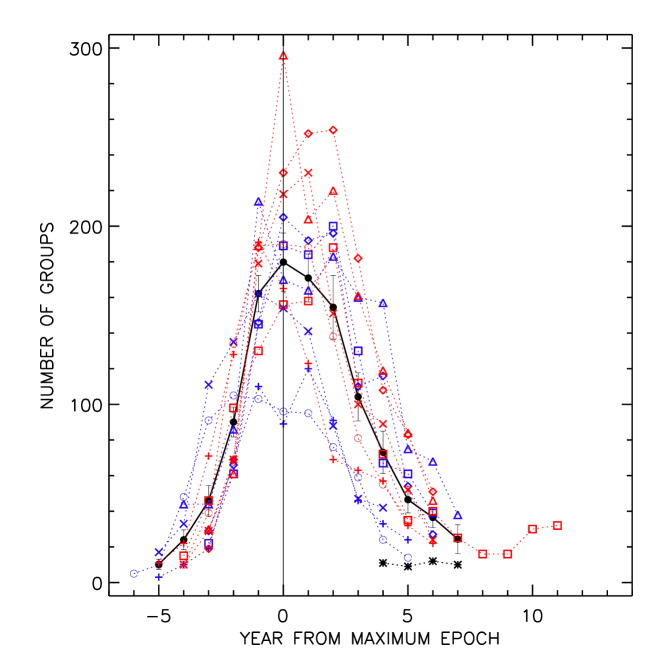
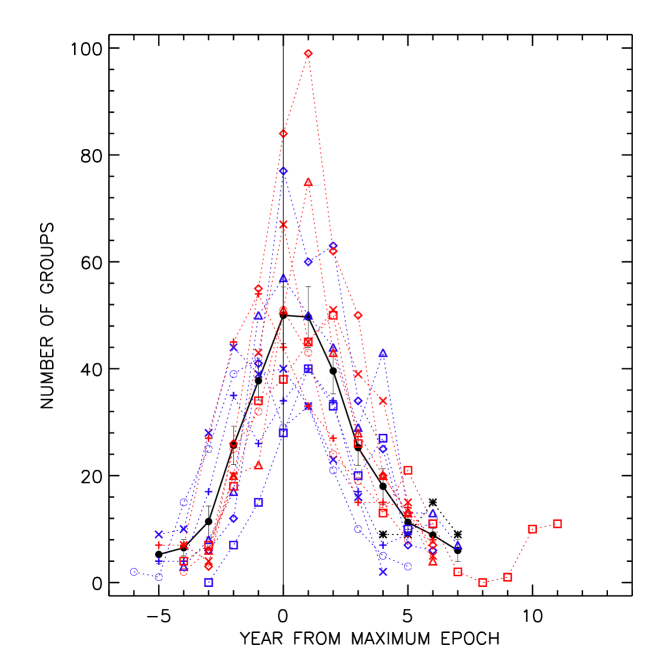
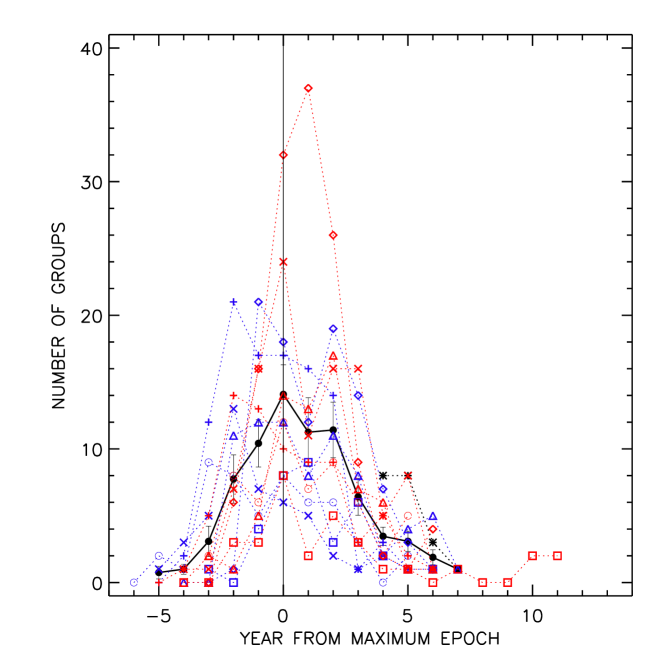
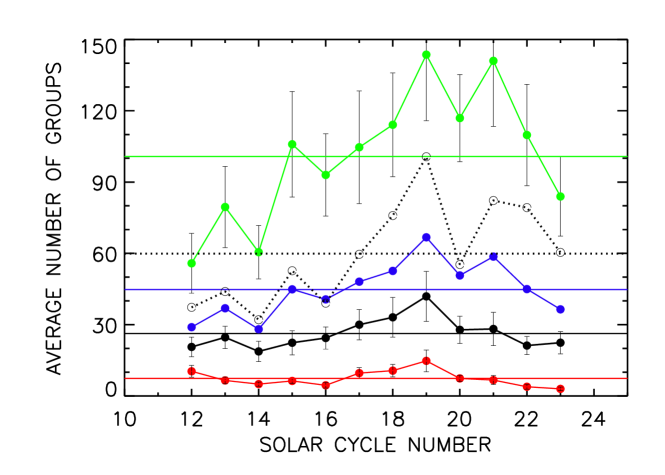
Figure 5 shows the cycle-to-cycle variations in the annual NSGs, NLGs, and NBGs averaged over each cycle. In the same figure we have also shown the cycle-to-cycle variation in the amplitude (, the largest value of smoothed monthly mean sunspot numbers in each cycle). The values of are taken from the website, ftp://ftp.ngdc.noaa.gov/STP/SOLAR_DATA/SUNSPOT_NUMBERS. As can be seen in this figure, the patterns of the long-term variations in the average annual NSGs, NLGs, and NBGs are similar to that of . The long-term trend indicates that these quantities, particularly NSGs, continue to decline for a few more cycles. It may be suggested that the long-term variation shows the largest amplitude in the case of NSGs and its period is also long (180 years) in this case. The NBGs seems to have a 90-year cycle with minimum at cycle 16 and the maxima at cycles 12 and 19. There was a downward trend in NSGs from cycle 21. This indicates that NSGs would be small in cycle 24 and even in cycle 25. Since in any cycle (or its sub-interval) the SSGs are majority, we can suggest that the amplitude of cycle 24 in will be smaller than that of cycle 23. This is consistent with a low amplitude predicted for cycle 24 Javaraiah (2008); Ramesh and Bhagya Lakshmi (2012).
4 Conclusions and Discussion
From the above analyses of a large data set on sunspot groups the following conclusions can be drawn:
-
1.
The amplitude of an even–numbered cycle of NLGs is smaller than that of its immediately following odd–numbered cycle. This is consistent with the well-known G-O rule of solar cycles. Obviously, the amplitude of cycle 22 of NLGs is smaller than that of cycle 23. This is in line with the conclusion drawn by \inlinecitekilc11.
-
2.
NSGs also satisfies the even–odd cycle rule, but cycle pair (22, 23) violated the G-O rule, i.e., in this cycle pair the behavior of NSGs is similar to that of . It is also found that the amplitude of an odd–numbered cycle of NSGs is larger than that of its immediately following even–numbered cycle. This can be called as a ‘reverse G-O rule’.
-
3.
In the case of NBGs, cycle pairs (12, 13) and (22, 23) show similar behavior, i.e., both violated the even-odd cycle rule. The violation of the G-O rule in NBGs is not reflected in because contributions from NBGs to are relatively small.
-
4.
In many cycles the positions of the peaks of NSGs, NLGs, and NBGs are different, and they also deviate considerably from the corresponding peak positions of . In the case of cycle 23, the maxima of NSGs and NLGs are at 2002, whereas the maximum of NBGs is at 2000, , at the same epoch of the maximum of . The corresponding cycles in NSGs and NLGs are largely symmetric or less asymmetric (the Waldmeier effect is weak or absent), and the corresponding cycle in NBGs is more asymmetric (strong Waldmeier effect).
-
5.
The amplitude of the long-term variation is large in the case of NSGs, and its period ( 180 years) is also long in this case. An approximate 90-year cycle is seen in NBGs. The long-term trend in the number of small groups implies that the current cycle 24 is weak.
The studies of rotation rates of sunspot groups of different life times and sizes indicated that the magnetic structures of small and large/big groups anchor near the surface (near 0.95, here is the radius of the Sun) and relatively deeper layers (even reach near to the base of the convection zone) of the Sun’s convection zone, respectively (\opencitejg97; \opencitekmh02; \opencitesiva03, 2004). Such a study also suggested that small sunspot groups may be the fragmented or the branched parts of the large/big sunspot groups Javaraiah (2003a). In other words, large/big sunspot groups may be the products of a deep dynamo mechanism, whereas small sunspot groups may be the product of a surface dynamo mechanism. Thus, our conclusions 1 and 2 above imply that the G-O rule represents a deep rooted global property of the solar cycle. Because of their large numbers the small sunspot groups mainly contributed to the behavior of cycle pair (22, 23) to violate the G-O rule. That is, the violation of the G-O rule in may be largely related to the surface (local) dynamo, for which convection and meridional flows may have major roles (cancellation of magnetic flux). The ‘reverse G-O rule’ found in the variation of the number of small groups (conclusion 2 above) is also related to the surface (local) dynamo mechanism.
The existence of approximate 90-year and 180-year periodicities has been known in sunspot activity. In the present analysis they are seen (visualized) in the variations of the numbers of large/big sunspot groups and of small sunspot groups, respectively (conclusion 5 above), suggesting that the former and latter are related to the dynamics of the deeper and the near-surface layers, respectively.
A ‘reverse G-O rule’ Javaraiah, Bertello, and Ulrich (2005a) and a 90-year periodicity Javaraiah (2003b); Javaraiah, Bertello, and Ulrich (2005b) were also found in the latitude gradient of solar rotation determined from the sunspot group data. Conclusions 2 and 5 above indicate that rotations of small and big sunspot groups largely contribute to the reverse G-O rule and the 90-year periodicity of the latitude gradient, respectively. Conclusion 2 above also indicates that in terms of the number of SSGs the amplitude of the current cycle 24 will be smaller than that of the previous cycle 23.
The maximum in of solar cycle is not smooth sometimes. Two or more peaks can be identified during the solar maxima and are called Gnevyshev peaks, because this splitting of activity was identified for the first time by Gnevyshev (1967, 1977). The time interval between these peaks, where the level of activity is relatively low, is known as the Gnevyshev gap (see the review by \opencitesto03). \inlinecitegopal03 found that during cycle 23 the occurrence rate of coronal mass ejections (CMEs) peaked two years after the maximum epoch (2000) of this cycle. \inlinecitedet04 reported that not only but also all other activity indices, including facular area, F10.7 flux, etc., show a double peak structure near the maximum of solar cycle 23, and these have the highest peak in the year 2002. \inlinecitekbr10 showed that the occurrence peak of CMEs is close to the peak of the sunspot group area. More powerful flares seem to occur after the maximum epoch of and the maximum of the annual number of X-class flares took place close to 2002 Tan (2011). \inlinecitejj12 found that the amounts (annual rates) of growth and decay of magnetic flux in sunspot groups in a given time interval (year) correlate well with the amount of magnetic flux available in that interval. Hence, they have claimed that the solar cycle variation in the decay of sunspot groups has a substantial contribution to the solar cycle variations in the solar energetic phenomena and the total solar irradiance (TSI). \inlinecitekilc11 suggested that the excess of large sunspot groups during the declining phase of cycle 23 is responsible for the occurrence rate of CMEs and other activity indices to reach their maxima in the year 2002. Our results (conclusion 2 above) indicate that there is a considerable contribution from the small sunspot groups concerning the two–year delay in the maximum of CME occurrence rate and other activity indices/energetic phenomena. That is, as suggested in \inlinecitejj12, TSI and solar energetic phenomena such as flares and CMEs seem to be largely related to the more evolved flux of sunspot groups.
\acknowledgementsname
The author thanks Dr. K. B. Ramesh for reading the manuscript and for discussion/suggestions, and the Editor in Chief Professor Takashi Sakurai for useful comments and suggestions.
References
- Balthasar, Vázquez, and Wöhl (1986) Balthasar, H., Vázquez, M., Wöhl, H.: 1986, Astron. Astrophys. 155, 87.
- Clette and Lefèvre (2012) Clette, F., Lefèvre, L.: 2012, J. Space Weather Space Clim. 2, A06.
- de Toma et al. (2004) de Toma, G., White, O.R., Chapman, G.A., Walton, S.R., Preminger, D.G., Cookson,A.M.: 2004, Astrophys. J. 609, 1140.
- Dikpati and Gilman (2006) Dikpati, M., Gilman, P.A.: 2006, Astrophys. J. 649, 498.
- Dikpati, Gilman, and de Toma (2008) Dikpati, M., Gilman, P.A., de Toma, G.: 2008, Astrophys. J. Lett. 673, L99.
- Gnevyshev (1938) Gnevyshev, M.N.: 1938, Pulkovo Obs. Circ. 24, 37.
- Gnevyshev (1967) Gnevyshev, M.N.: 1967, Solar Phys. 1, 107.
- Gnevyshev (1977) Gnevyshev, M.N.: 1977, Solar Phys. 51, 175.
- Gnevyshev and Ohl (1948) Gnevyshev, M.N., Ohl, A.I.: 1948, Astron. Zh 25, 18.
- Gopalswamy et al. (2003) Gopalswamy, N., Lara, A., Yashiro, S., Nunes, S., Howard, R.A.,: 2003, In: Wilson, A. (ed.) Solar Variability as an Input to the Earth’s Environment, ESA SP-535, 403.
- Hathaway (2009) Hathaway, D.H.: 2009, Space Sci. Rev. 144, 401.
- Hathaway and Wilson (2004) Hathaway, D.H., Wilson, R.M.: 2004, Solar Phys. 224, 5.
- Hathaway, Wilson, and Reichmann (2002) Hathaway, D.H., Wilson, R.M., Reichmann, J.: 2002, Solar Phys. 211, 357.
- Hiremath (2002) Hiremath, K.M.: 2002, Astron. Astrophys. 386, 674.
- Howard (1996) Howard, R.F.: 1996, Annu. Rev. Astron. Astrophys. 34, 75.
- Howard, Gilman, and Gilman (1984) Howard, R.F., Gilman, P.A, Gilman, P.I.: 1984, Astrophys. J. 283, 373.
- Hoyt and Schatten (1988a) Hoyt, D.V., Schatten, K.H.: 1998a, Solar Phys. 179, 189.
- Hoyt and Schatten (1988b) Hoyt, D.V., Schatten, K.H.: 1998b, Solar Phys. 181, 491.
- Javaraiah (1999) Javaraiah, J.: 1999, Solar Phys. 189, 289.
- Javaraiah (2003a) Javaraiah, J.: 2003a, In: Pevtsov, A.A., Uitenbroek, H. (eds.), Current Theoretical Models and Future High Resolution Solar Observations: Preparing for ATST, ASP Conf. Ser. 286, 325.
- Javaraiah (2003b) Javaraiah, J.: 2003b, Solar Phys. 212, 23.
- Javaraiah (2005) Javaraiah, J.: 2005, Mon. Not. Roy. Astron. Soc. 362, 1311.
- Javaraiah (2008) Javaraiah, J.: 2008, Solar Phys. 252, 419.
- Javaraiah (2012) Javaraiah, J.: 2012, Astrophys. Space Sci., DOI 10.1007/s10509-011-0932-2, in press (published in online).
- Javaraiah, Bertello, and Ulrich (2005a) Javaraiah, J., Bertello, L., Ulrich, R.K: 2005a, Astrophys. J. 626, 579.
- Javaraiah, Bertello, and Ulrich (2005b) Javaraiah, J., Bertello, L., Ulrich, R.K.: 2005b, Solar Phys. 232, 25.
- Javaraiah and Gokhale (1997) Javaraiah, J., Gokhale, M.H.: 1997, Astron. Astrophys. 327, 795.
- Kilcik et al. (2011) Kilcik, A., Yurchyshyn, V.B., Abramenko, V., Goode, P.R., Ozguc, A., Rozelot, J.P., Cao, W.: 2011, Astrophys. J. 731, 30.
- Petrovay (2010) Petrovay, K.: 2010, Living Rev. Solar Phys. 7, no. 6.
- Petrovay and Van Driel-Gesztelyi (1997) Petrovay, K., Van Driel-Gesztelyi, L.: 1997, Solar Phys. 176, 249.
- Pevtsov et al. (2011) Pevtsov, A.A., Nagovitsyn, Y.A., Tlatov, A.G., Rybak, A.L.: 2011, Astrophys. J. 742, L36.
- Ramesh (2010) Ramesh, K.B.: 2010, Astrophys. J. 712, L77.
- Ramesh and Bhagya Lakshmi (2012) Ramesh, K.B., Bhagya Lakshmi, N.: 2012, Solar Phys. 276, 395.
- Ramesh and Rohini (2008) Ramesh, K.B., Rohini, V.S.: 2008, Astrophys. J. 686, L41.
- Sivaraman et al. (2004) Sivaraman, K.R., Gokhale, M.H.: 2004, Solar Phys. 221, 209.
- Sivaraman et al. (2007) Sivaraman, K.R., Gokhale, M.H., Sivaraman, H., Gupta, S.S., Howard, R.F.: 2007, Astrophys. J. 657, 592.
- Sivaraman et al. (2003) Sivaraman, K.R., Hari, S. Gupta, S.S., Howard, R.F.: 2003, Solar Phys. 214, 65.
- Sivaraman et al. (2010) Sivaraman, K.R., Sivaraman, H., Gupta, S.S., Howard, R.F.: 2010, Solar Phys. 266, 247.
- Storini (2003) Storini, M., Bazilevskaya, G.A., Flükiger, E.O., Krainev, M.B., Makhmutov, V.S., Sladkova, A.I.: 2003, Adv. Space Res. 31, 895.
- Tan (2011) Tan, B.: 2011, Astrophys. Space Sci. 332, 65.
- Waldmeier (1955) Waldmeier, M.: 1955, Ergebnisse und Probleme der Sonnenforschung, 2, Aufl. Akad. Verlagsges., Leipzig.
- Wang and Sheeley (1989) Wang, Y.-M., Sheeley, N.R., Jr.: 1989, Solar Phys., 124, 81.
- Ward (1965) Ward, F.: 1965, Astrophys. J. 141, 534.
- Ward (1966) Ward, F.: 1966, Astrophys. J. 145, 416.
- Zirin (1987) Zirin, H.: 1987, Solar Phys., 110, 101.