1\Yearpublication2012\Yearsubmission2012\Month12\Volume333\Issue1
later
Simultaneous observations of the cataclysmic variable AE Aquarii: temperature and mass of fireballs ††thanks: based on data collected with the telescopes at Bulgarian National Astronomical Observatory Rozhen and Belogradchick Astronomical Observatory.
Abstract
We report simultaneous multicolour observations in 5 bands
of the flickering variability of the cataclysmic variable AE Aqr.
Our aim is to estimate the parameters (colours, temperature, size) of the fireballs that
produce the optical flares.
The observed rise time of the optical flares is in the interval 220 - 440 sec.
We estimate the dereddened colours of the fireballs:
in the range 0.8-1.4, 0.03-0.24, 0.26-0.78.
We find for the fireballs a temperature in the range 10000 - 25000 K, mass (7-90) g,
size (3-7) cm (using a distance of pc).
These values refer to the peak of the flares observed in bands.
The data are available upon request from the authors.
keywords:
stars: individual: AE Aqr – binaries: novae, cataclysmic variables.1 Introduction
AE Aquarii is an 11-12 mag cataclysmic variable, which was discovered in the optical by Zinner (1938) and was first associated with the DQ Her (Intermediate Polar) stars by Patterson (1979).
In the AE Aqr system a K0-K4 IV/V star transfers material through the L1 nozzle toward a magnetic white dwarf. The high-dispersion time-resolved absorption line spectro- scopy by Echevarría et al. (2008) gives the binary parameters as: white dwarf mass , secondary mass , binary separation R⊙, inclination .
The light curve of AE Aqr exhibits large flares and coherent oscillations of about 16 and 33 s in the optical and X-ray (Patterson 1979). It also exhibits radio and millimeter synchrotron emission (e.g. Bookbinder & Lamb 1987; Bastian, Dulk & Chanmugam 1988), and possibly even TeV -rays (Bowden et al. 1992; Meintjes et al. 1992).
It has a long orbital period of 9.88 h (e.g. Casares et al. 1996) and a very short spin period of the white dwarf. On the basis of IUE spectra, Jameson, King & Sherrington (1980) reveal the most extreme CIV/NV ratio of all Cataclysmic Variable stars, probably indicating strong carbon depletion and thus CNO cycling (Mauche, Lee & Kallman 1997). To arrive at such a state, AE Aqr is believed to be a former supersoft X-ray binary, in which the mass transfer rate in the recent past ( yr) has been much higher than its current value (Schenker et al. 2002).
| Telescope | Band | UT | Exp-time | Npts | average | min-max | stdev | err | |
| start-end | [sec] | [mag] | [mag]-[mag] | [mag] | [mag] | ||||
| 2010 Aug 12 | JD2455421 | ||||||||
| 50/70 cm Schmidt | 23:20 - 00:32 | 60,90,120 | 42 | 12.338 | 12.214 - 12.397 | 0.047 | 0.010 | ||
| 60 cm Belogradchick | 23:00 - 00:37 | 40 | 81 | 10.717 | 10.607 - 10.754 | 0.027 | 0.007 | ||
| 2010 Aug 13 | JD2455422 | ||||||||
| 2.0 m RCC | 22:23 - 00:28 | 180 | 19 | 11.577 | 10.985 - 12.335 | 0.336 | 0.025 | ||
| 50/70 cm Schmidt | 21:46 - 00:28 | 60 | 137 | 12.226 | 11.694 - 12.430 | 0.169 | 0.008 | ||
| 2.0 m RCC | 22:23 - 00:28 | 10 | 463 | 11.377 | 10.990 - 11.486 | 0.107 | 0.007 | ||
| 60 cm Belogradchick | 22:00 - 00:28 | 60,40 | 181 | 10.699 | 10.422 - 10.797 | 0.077 | 0.006 | ||
| 60 cm Rozhen | 22:41 - 00:29 | 15 | 388 | 10.177 | 9.987 - 10.261 | 0.052 | 0.007 | ||
| 2010 Aug 14 | JD2455423 | ||||||||
| 2.0 m RCC | 18:57 - 23:43 | 120,180 | 67 | 12.073 | 10.824 - 12.942 | 0.527 | 0.022 | ||
| 50/70 cm Schmidt | 18:44 - 23:44 | 60,120,180 | 245 | 12.186 | 11.672 - 12.450 | 0.144 | 0.011 | ||
| 2.0 m RCC | 18:48 - 23:45 | 10 | 1106 | 11.346 | 11.056 - 11.831 | 0.080 | 0.007 | ||
| 60 cm Belogradchick | 19:32 - 23:46 | 40,60 | 331 | 10.639 | 10.432 - 10.749 | 0.057 | 0.005 | ||
| 60 cm Rozhen | 18:24 - 23:42 | 15 | 1132 | 10.143 | 9.976 - 10.284 | 0.060 | 0.009 | ||
| 2010 Aug 16 | JD2455425 | ||||||||
| 60 cm Rozhen | 18:31 - 19:59 | 120 | 24 | 12.510 | 12.013 - 13.100 | 0.278 | 0.085 | ||
| 60 cm Rozhen | 18:33 - 00:26 | 60,90 | 76 | 12.317 | 12.016 - 12.565 | 0.142 | 0.012 | ||
| 60 cm Belogradchick | 18:54 - 00:27 | 60,180 | 68 | 11.383 | 11.207 - 11.563 | 0.119 | 0.008 | ||
| 60 cm Belogradchick | 18:57 - 00:28 | 40 | 71 | 10.738 | 10.565 - 10.917 | 0.109 | 0.006 | ||
| 60 cm Belogradchick | 18:53 - 00:29 | 40 | 70 | 10.190 | 10.036 - 10.351 | 0.095 | 0.006 | ||
| 2011 Aug 31 | JD2455805 | ||||||||
| 2.0 m RCC | 20:59 - 23:46 | 90,120 | 72 | 11.368 | 9.841 - 12.476 | 0.685 | 0.039 | ||
| 50/70 cm Schmidt | 20:54 - 23:40 | 30 | 270 | 11.777 | 10.767 - 12.339 | 0.376 | 0.032 | ||
| 2.0 m RCC | 20:58 - 23:18 | 5 | 1090 | 11.079 | 10.355 - 11.738 | 0.228 | 0.012 | ||
| 60 cm Rozhen | 20:45 - 23:44 | 10 | 328 | 10.421 | 9.876 - 10.730 | 0.175 | 0.015 | ||
| 60 cm Rozhen | 20:45 - 23:44 | 10 | 327 | 9.950 | 9.546 - 10.195 | 0.129 | 0.015 |
The Balmer emission lines vary both in strength and shape and they are not good tracers of the orbital motion of the white dwarf. This has led to the proposal of the magnetic propeller model (Wynn, King & Horne 1997). The gas stream emerging from the K2V companion star through the inner Lagrangian point L1 encounters a rapidly spinning magnetosphere. The rotating white dwarf in AE Aqr ejects most of the matter transferred from the secondary in the form of blobs (‘fireballs’). Only a small fraction (3%) of the mass flow at the magnetospheric radius eventually accretes on to the surface of the white dwarf, emphasizing the effective magnetospheric propeller process in the system (Oruru & Meintjes 2012).
The white dwarf in AE Aqr is a fast rotator having a spin period s, and spinning down at a rate s s-1 (de Jager et al. 1994; Mauche et al. 2011), corresponding to a spin-down luminosity of erg s-1 (Oruru & Meintjes 2011). A part of the spin-down power is consumed to expel the blobs.
In this paper we present simultaneous multicolour observations in 5 bands of the flares of AE Aqr. The source of the flares is assumed to be the fireballs(blobs). We measure the fluxes emitted by the fireballs, their colours, and calculate their mass, size, temperature and expansion rate.
2 Observations
We observed AE Aqr with 4 telescopes mixing from 2010 August to 2011 August – see Table 1 for details.
All telescopes were equipped with CCD cameras: the 2m RCC telescope of the National Astronomical Observatory Rozhen was equipped with a dual channel focal reducer – in the band a Photometrics CE200A CCD (1024x1024 px, field of view 7.5’x7.5’) has been used, and in the band a VersArray 1330B (512x512 px, 7.5’x7.5’); the 50/70 cm Schmidt telescope was equipped with FLI PL16803 CCD, 4096x4096 px, used 1024 x1024 px, 18’x18’; the 60 cm Rozhen telescope was equipped with a FLI PL09000 CCD with 3056x3056 px and 18’x18’ and the 60 cm Belogradchick telescope was equipped with FLI PL 09000 CCD, 3056x3056 px, 18’x18’.
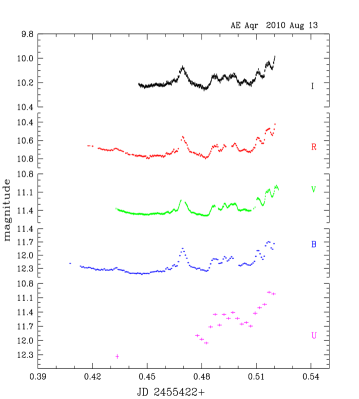
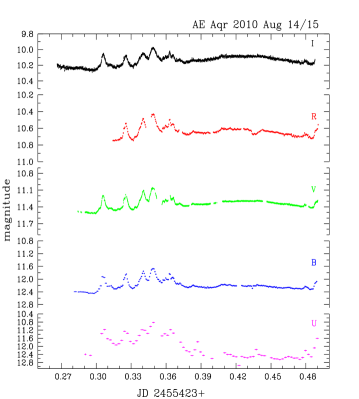
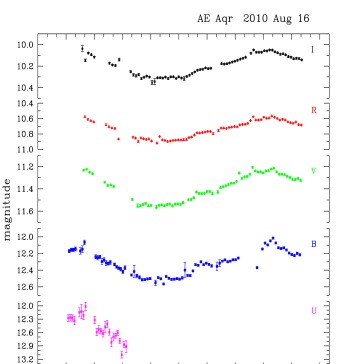
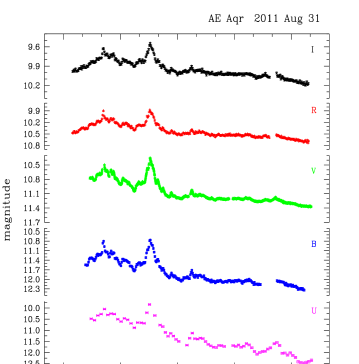
The journal of observations is given in Table 1. For each run we also give the minimum, maximum, and average brightness in the corresponding band, plus the standard deviation of the run. All the CCD images have been bias subtracted, flat fielded, and standard aperture photometry has been performed. The data reduction and aperture photometry are performed with IRAF111 IRAF is distributed by the National Optical Astronomy Observatory, which is operated by the Association for Research in Astronomy, Inc. under cooperative agreement with the National Science Foundation. and have been checked with alternative software packages. The light curves are plotted in Fig.1.


| 20100813 23:40 | 20100814 19:20 | 20100814 19:48 | 20100814 20:10 | 20110831 21:43 | ||
| Quantity | JD 2455422.486 | JD 2455423.305 | JD 2455423.325 | JD 2455423.340 | JD 2455805.405 | |
| rise time [sec] | 26020 | 23025 | 29030 | 44020 | 26030 | |
| FU [ erg cm-2 s-1 Å-1] | 5.85 | 12.28 | 7.63 | 8.32 | 32.8 | |
| FB [ erg cm-2 s-1 Å-1] | 2.65 | 5.21 | 5.11 | 6.30 | 20.4 | |
| FV [ erg cm-2 s-1 Å-1] | 1.81 | 3.53 | 3.26 | 4.09 | 11.5 | |
| FR [ erg cm-2 s-1 Å-1] | 1.75 | — | 2.69 | 3.48 | 9.10 | |
| FI [ erg cm-2 s-1 Å-1] | 1.17 | 2.46 | 1.62 | 2.10 | 4.93 | |
| -1.360.06 | -1.430.03 | -0.930.04 | -0.800.05 | -1.020.07 | ||
| 0.240.03 | 0.230.03 | 0.170.03 | 0.190.03 | 0.030.06 | ||
| 0.470.05 | — | 0.300.03 | 0.330.03 | 0.260.03 | ||
| 0.700.07 | 0.780.03 | 0.420.06 | 0.450.05 | 0.260.06 | ||
| temperature T [K] | 14 5451000 | 27 2921500 | 10 856150 | 9 527100 | 13 395200 | |
| size [ cm] | 3.00.3 | 2.50.3 | 5.30.3 | 7.10.4 | 7.70.4 | |
| mass [ g] | 9.61.5 | 6.81.5 | 39 6 | 7812 | 9715 | |
| expansion velocity [km s-1] | 10510 | 9110 | 193 18 | 18918 | 36730 | |
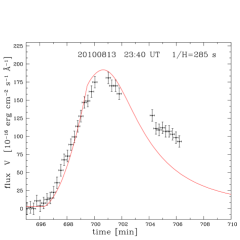
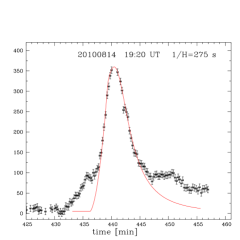
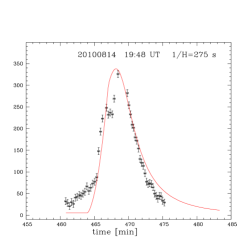
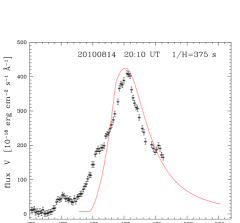
| expansion constant 1/H [s] | 28520 | 27520 | 27520 | 37525 | 21020 | |
| central density [ g cm-3] | 6.4 | 7.8 | 4.7 | 3.9 | 3.8 |
3 Analysis
3.1 Flares of AE Aqr
The light curve of AE Aqr exhibits large flares on time-scales of about 10 minutes, which were first reported by Henize (1949). The first simultaneous multicolour optical photometry was performed by Chincarini & Walker (1981). Later van Paradijs, van Amerongen, & Kraakman (1989), performed five-colour (Walraven system) observation and demonstrated that the flares occur throughout the whole orbital period and estimated the rise time s. Bruch & Grutter (1997) found that the probability for strong flares is phase dependent. Mauche et al. (2011) performed a multiwavelength (TeV -ray, X-ray, UV, optical, and radio) campaign of observations of AE Aqr. They demonstrated that there is a strong correlation in the flux variations between the X-ray, near UV, and optical B and V bands. They also detected a weak negative correlation between X-ray and radio wavebands.
The observed properties of the close binary AE Aqr indicate that the mass transfer in this system operates via the Roche lobe overflow mechanism, but the material transferred from the normal companion is neither accreted onto the surface of the white dwarf nor stored in a disk around its magnetosphere. In terms of our current understanding (Wynn, King & Horne 1997 ), the short time-scale variations or flares can best be explained in terms of a fragmented accretion flow. The accretion from the companion star is fragmented into discrete blobs that interact with the propeller that is the magnetosphere of the spinning white dwarf. These blobs (fireballs) are the reason for the flares. A typical flow pattern is: blobs reach a maximum velocity of km s-1 at closest approach to the white dwarf (1010 cm), and cruise out of the system with a velocity of km s-1. The agreement between the observed H Doppler tomogram of AE Aqr and the predicted one suggests that the blobs remain intact until they pass closest approach and are ejected (Wynn, King & Horne 1997).
3.2 Flux of the flare
Our aim is to measure the parameters (temperature, mass, radius) of the blobs (fireballs). To do this we need to measure the magnitude at the start and at the peak of the flare.
During our first night of observations (2010 Aug 12) we do not detect any flares. The same is true during the fifth night (2010 Aug 16). Only smooth variations due to the orbital modulation are visible. More details about the orbital modulation are given in van Paradijs et al. (1989).
During the second night (2010 August 13) we detect 7 flares (see Fig.1). Among them one has well defined start and peak in bands. During the night of 2010 August 14 there are 5 flares; we are able to measure 3 of them. On the night 2011 August 31 we have one well defined flare. The rise time of these five flares is given in Table 2. The rise time is measured as the time from the beginning of the flare to its peak.
For a few other flares, that are not listed in Table 2, we measure the rise time as follows: flare at 0813 23:15 rise time s, flare at 0813 0:14 s, at 0814 20:21 s. In general, the rise time of the flares is in the range 220 - 440 s.
We calculate the peak flux of the fireball as
| (1) |
where is the maximum flux of the star during the flare and is the flux at the start of the flare. We calculate and for each band, using Bessel (1979) calibration for the fluxes of a zero magnitude star.
In order to estimate the actual flux of the fireball, the observed magnitudes must be corrected for the effects of interstellar extinction. The extinction towards AE Aqr is low. La Dous (1991) found an from the weakness of 2200 Å absorption feature. Bruch (1992) assumed interstellar extinction . The IRSA Galactic Reddening and Extinction Calculator (NASA/IPAC) gives for the interstellar extinction toward AE Aqr a value of and mag. We adopt and an extinction law as given in Cardelli et al. (1989).
The distance to AE Aqr is estimated as pc (Friedjung 1997). Following the latest reduction of the astrometric data as produced by the Hipparcos mission (van Leeuwen 2007) the parallax is mas, which corresponds to a distance of pc. This value is almost equal to the value pc (equivalent to a parallax 12.2 mas) calculated by van Paradijs et al. (1989) on the basis of V-band surface brightness and spectral type.
On the basis of the measured fluxes we calculate the dereddened colours of the fireballs at the peak of the flare and list them in Table 2. The colours are similar to those of the flickering light source in other cataclysmic variables (see Bruch 1992).
3.3 Model of a fireball
Pearson, Horne & Skidmore (2003, 2005) derived analytic expressions for the continuum light curves and spectra of flaring and flickering events that occur over a wide range of astrophysical systems. They compared these results to data taken from the cataclysmic variables AE Aqr, SS Cygni and also from SN 1987A, deriving physical parameters for the material involved. They have shown that the observed flare spectrum and evolution of AE Aqr is reproducible with an isothermal fireball with Population II abundances. Here we transcribe only a part of their equations. The interested reader is referred to their papers for the detailed derivations.
The basic assumptions are: (i) the flares of AE Aqr are due to the appearance and expansion of blobs (fireballs); (ii) the blobs represent spherically symmetric expansion of a Gaussian density profile with radial velocity proportional to the distance from the center of the expansion; (iii) the fireballs are isothermal.
Following Pearson et al. (2005), the dimensionless time is defined as
| (2) |
where is the time of the peak of the flare, is an “expansion constant” setting the speed of the expansion. The dimensionless time is also the expansion factor being the constant of proportionality between the current and peak scale length :
| (3) |
The central density of the fireball is
| (4) |
where M is the total mass involved in the expansion (which we call fireball mass). The speed of expansion at is:
| (5) |
The optical depth parallel to the observer’s line of sight is
| (8) |
where is the impact parameter (the distance from the fireball center perpendicular to the line of sight), is the linear absorption coefficient, is the correction for stimulated emission
| (9) |
is the fireball temperature, is the length-scale (which we call fireball size).
The optical depth on the line of sight through the center of the fireball () is
| (10) |
The emission of the fireball is:
| (11) |
where
| (12) |
is the ”saturation function”, plotted in Fig. 1 of Pearson et al. (2005).
3.4 Parameters of the fireballs
To evaluate the fireball parameters and , we performed the following:
1. We measure , , and calculate (Eq.1) in bands. In Fig.3, we plot the calculated peak fluxes, corrected for the interstellar extinction.
2. Using a black body fit ( routine of IRAF), we calculate the temperature of the fireball.
3. We calculate the size of the fireball at the peak, , using Eq.11 and the peak optical depth (see Eq. 33 of Pearson et al. 2005).
4. We estimate the mass of the fireball using Eq.10. The estimates are done for fireballs with Population II abundances, m-1.
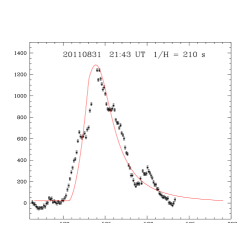
5. Fitting the observed light curves (see Fig.3), we calculate the expansion constant .
The estimated parameters with the corresponding errors are given in Table 2. The observed V band time evolution of the fireballs together with our best fit light curves are plotted in Fig.3. As can be seen in Fig.3, we achieved good agreement with the observed V band light curves of the optical flares using fireballs with a temperature T K and mass g.
The effects of the uncertainty of the distance to the values listed in Table 2 are: a change of the distance from d=86 pc to d=102 pc leads to an increase of with 19%, of – with 53%, of – with 19% , and a decrease of with 8%.
4 Discussion
4.1 Comparison with spectral data
The previous investigations demonstrated that the colour indices of the flares in AE Aqr are close to those of a black body with K (Beskrovnaya et al. 1996). LTE fits to the continuum of a large flare yielded a temperature between K (Welsh, Horne & Oke 1993).
Skidmore et al. (2003) have obtained high quality spectroscopic data on the 10 m Keck telescope for one small flare. They extracted and analyzed the spectrum of this flare, which was later modeled by Pearson et al. (2003) to obtain the fireball parameters. They used a distance of 100 pc. Their parameters recalculated for d=86 pc are M= g, cm, g cm-3, and km s-1. The temperature and expansion constant remain unchanged.
Here we give a comparison of our (summarized in Table 2) with their results:
- temperature: their estimate T=18000 K is well within our range of temperatures 10000 - 25000 K;
- size: their value is bigger but similar to our range cm.
- mass: their estimate is in the lower part of our range g.
- expansion velocity: their value is in the middle of our range 100 - 350 km s-1.
- expansion constant: their value 1/H = 560 s, is higher but similar to our range 210 - 375 s.
- density: their value is lower than our range g cm-3.
We have good agreement with the spectroscopic results of Pearson et al. (2003). As expected their mass and density are lower because they have modeled one smaller flare with amplitude mag, while our flares have larger amplitudes ( mag).
4.2 Mass transfer rate and fireball mass
An estimation of the expected fireball mass can be obtained from the mass accretion rate and typical time between the flares.
Pearson et al. (2003) have estimated that the mass donor in AE Aqr transfers mass at a rate g s-1, using the standard evolutionary equation. From a comparison of simulated and observed H Doppler tomograms, Ikhsanov et al. (2004) provided the mean value of the mass-transfer rate g s-1. For total 18h42min of observations, we detect 14 fireballs in the optical bands which means about 0.75 fireball per hour and expected typical mass of the fireball g.
We calculate the mass of the fireballs in the range g (see Table 2), which agree with the above estimation obtained on the basis of the mass transfer rate. We measure the parameters of the fireballs that produce the most prominent peaks in the optical bands. These are probably the most massive blobs. Smaller blobs producing smaller flares should also exist.
4.3 Fireball vs. magnetosphere size
The mass of the white dwarf in AE Aqr is estimated as . Following mass-radius relation for magnetic white dwarfs (Suh & Mathews 2000) its radius should be cm. It means that the calculated fireball peak size is .
Choi & Yi (2000), estimated the magnetic field of the white dwarf G on basis of the quiescent X-ray and UV emission. It could be as high as G (Ikhsanov et al. 2004 and references therein). Using the range of parameters for the magnetic field and mass transfer rate we calculate the radius of the magnetosphere is , which means that the typical blobs have size less than 40% of the magnetosphere radius.
4.4 Blobs ejected from white dwarfs
There are two other white dwarfs in longer period binary systems, for which blobs are observed and a propeller acting white dwarf is supposed.
RS Oph: High-velocity emission components are observed in the Balmer line wings in the recurrent nova RS Oph (Iijima et al. 1994). The emission components most probably originate in high velocity blobs of matter ejected via a jet mechanism or centrifugally expelled by the white dwarf magnetosphere (Zajczyk et al. 2008). The RS Oph blobs have mass g, velocity range 550 - 2060 km s-1, and month ejection interval (Zamanov et al. 2005). This means similar ejection velocity, times higher mass and 700 times longer ejection interval than the AE Aqr blobs.
CH Cyg: Similar blobs have been observed in 1994 in CH Cyg. The spectroscopy of CH Cyg with time resolution min, reported by Tomov et al. (1996) shows that emission components appeared and disappeared on both sides of the emission. They suggested that these emission components originate in small, short-lived blobs of material ejected in different directions, due to a magnetic propeller state. The blobs have typical ejection timescale 3-5 hours (0.2-0.3 blobs per hour) and velocity up to km s-1. We estimate the mass of the blobs
g.
This means 70 times higher mass,
and times longer ejection interval than the AE Aqr blobs.
It is worth noting that (i) the mass accretion rate in CH Cyg is similar or higher than in AE Aqr - g s-1 (Mikolajewska et al. 1988; Wheatley & Kallman 2006), while in RS Oph it is about 100 times higher ( g s-1, Osborne et al. 2011); (ii) the white dwarfs in symbiotic stars probably rotate much slower ( times), having spin period of the order of 1 hour (Sokoloski & Bildsten 1999, Formiggini & Leibowitz 2009).
We pose the question: are there different mechanisms for a white dwarf to eject blobs or it is the same phenomenon (magnetic propeller), just scaled with the spin period and mass accretion rate?
5 Conclusions
Using 4 telescopes, we performed simultaneous observations in 5 bands of the flare activity of the cataclysmic variable AE Aqr. The main results of our work are:
(1) For a total of 18.7 hours of observations we detected 14 flares. The rise time of the flares is in the range 220-440 s.
(2) For 5 individual fireballs, we calculated the peak fluxes in bands, rise times, colours, and modeled their evolution. At the peaks of the optical emission, the dereddened colours of the fireballs are: in the range 0.8-1.4, 0.03-0.24.
(3) Adopting the model of an isothermically expanding ball of gas, we find for the individual fireballs a temperature in the range 10000 – 25000 K, mass 7-90 g, size 3-7 cm, constant of expansion 1/H = 210 - 370 s-1 (using a distance to AE Aqr of pc and interstellar extinction ). These values refer to the peak of the flares observed in the optical bands.
We also briefly discuss the possible relation of the blobs of AE Aqr with those detected in two symbiotic stars.
Acknowledgments
We acknowledge the partial support by Bulgarian National Science Fund (DO 02-85 and DMU 03/131).
We thank M.F. Bode for an initial reading of the draft manuscript and the referee for useful comments.
This research has made use of the NASA/IPAC Infrared Science Archive, which is operated by the Jet Propulsion Laboratory, California Institute of Technology, under contract with the National Aeronautics and Space Administration.
References
- [Bastian et al.(1988)] Bastian, T. S., Dulk, G. A., & Chanmugam, G. 1988, ApJ, 324, 431
- [Beskrovnaya et al.(1996)] Beskrovnaya, N. G., Ikhsanov, N. R., Bruch, A., & Shakhovskoy, N. M. 1996, A&A, 307, 840
- [Bessell(1979)] Bessell, M. S. 1979, PASP, 91, 589
- [Bookbinder & Lamb(1987)] Bookbinder, J. A., & Lamb, D. Q. 1987, ApJ, 323, L131
- [Bowden et al.(1992)] Bowden, C. C. G., Bradbury, S. M., Chadwick, P. M., et al. 1992, Astroparticle Physics, 1, 47
- [Bruch(1992)] Bruch, A. 1992, A&A, 266, 237
- [Bruch & Grutter(1997)] Bruch, A., & Grutter, M. 1997, AcA, 47, 307
- [Cardelli et al.(1989)] Cardelli, J. A., Clayton, G. C., & Mathis, J. S. 1989, ApJ, 345, 245
- [Casares et al.(1996)] Casares, J., Mouchet, M., Martinez-Pais, I. G., & Harlaftis, E. T. 1996, MNRAS, 282, 182
- [Chincarini & Walker(1981)] Chincarini, G., & Walker, M. F. 1981, A&A, 104, 24
- [Choi & Yi(2000)] Choi, C.-S., & Yi, I. 2000, ApJ, 538, 862
- [de Jager et al.(1994)] de Jager, O. C., Meintjes, P. J., O’Donoghue, D., & Robinson, E. L. 1994, MNRAS, 267, 577
- [Echevarría et al.(2008)] Echevarría, J., Smith, R. C., Costero, R., Zharikov, S., & Michel, R. 2008, MNRAS, 387, 1563
- [Formiggini & Leibowitz(2009)] Formiggini, L., & Leibowitz, E. M. 2009, MNRAS, 396, 1507
- [Friedjung(1997)] Friedjung, M. 1997, New Astronomy, 2, 319
- [Henize(1949)] Henize, K. G. 1949, AJ, 54, 89
- [Iijima et al.(1994)] Iijima, T., Strafella, F., Sabbadin, F., & Bianchini, A. 1994, A&A, 283, 919
- [Ikhsanov et al.(2004)] Ikhsanov, N. R., Neustroev, V. V., & Beskrovnaya, N. G. 2004, A&A, 421, 1131
- [Jameson et al.(1980)] Jameson, R. F., King, A. R., & Sherrington, M. R. 1980, MNRAS, 191, 559
- [La Dous(1991)] La Dous, C. 1991, A&A, 252, 100
- [Mauche et al.(1997)] Mauche, C. W., Lee, Y. P., & Kallman, T. R. 1997, ApJ, 477, 832
- [Mauche et al.(2011)] Mauche, C. W., Abada-Simon, M., Desmurs, J.-F., et al., 2011, arXiv:1111.1190, (Mem. SAIt. 83, in press)
- [Meintjes et al.(1992)] Meintjes, P. J., Raubenheimer, B. C., de Jager, O. C., et al. 1992, ApJ, 401, 325
- [Mikolajewska et al.(1988)] Mikolajewska, J., Selvelli, P. L., & Hack, M. 1988, A&A, 198, 150
- [Oruru & Meintjes(2012)] Oruru, B., & Meintjes, P. J. 2012, MNRAS, 421, 1557
- [Oruru & Meintjes(2011)] Oruru, B., & Meintjes, P. J. 2011, Fast X-ray Timing and Spectroscopy at Extreme Count Rates (HTRS 2011),
- [Osborne et al.(2011)] Osborne, J. P., Page, K. L., Beardmore, A. P., Bode, M. F., Goad, M. R., O’Brien, T. J., Starrfield, S., Rauch, T., et al. 2011, ApJ, 727, 124
- [Patterson(1979)] Patterson, J. 1979, ApJ, 234, 978
- [Pearson et al.(2003)] Pearson, K. J., Horne, K., & Skidmore, W. 2003, MNRAS, 338, 1067
- [Pearson et al.(2005)] Pearson, K. J., Horne, K., & Skidmore, W. 2005, ApJ, 619, 999
- [Schenker et al.(2002)] Schenker, K., King, A. R., Kolb, U., Wynn, G. A., & Zhang, Z. 2002, MNRAS, 337, 1105
- [Skidmore et al.(2003)] Skidmore, W., O’Brien, K., Horne, K., Gomer, R., Oke, J. B., Pearson, K. J. 2003, MNRAS, 338, 1057
- [Sokoloski & Bildsten(1999)] Sokoloski, J. L., & Bildsten, L. 1999, ApJ, 517, 919
- [Suh & Mathews(2000)] Suh, I.-S., & Mathews, G. J. 2000, ApJ, 530, 949
- [Tomov et al.(1996)] Tomov, T., Kolev, D., Munari, U., & Antov, A. 1996, MNRAS, 278, 542
- [van Leeuwen(2007)] van Leeuwen, F. 2007, A& A, 474, 653
- [van Paradijs et al.(1989)] van Paradijs, J., van Amerongen, S., & Kraakman, H. 1989, A&AS, 79, 205
- [Welsh et al.(1993)] Welsh, W. F., Horne, K., & Oke, J. B. 1993, ApJ, 406, 229
- [Wheatley & Kallman(2006)] Wheatley, P. J., & Kallman, T. R. 2006, MNRAS, 372, 1602
- [Wynn et al.(1997)] Wynn, G. A., King, A. R., & Horne, K. 1997, MNRAS, 286, 436
- [Zajczyk et al.(2008)] Zajczyk, A., Tomov, T., Mikolajewski, M., Bull, Ch., Kolev, D., Cikala, M., Georgiev, L., Galazufdinov, G., 2008, RS Ophiuchi (2006) and the Recurrent Nova Phenomenon, 401, 106
- [Zamanov et al.(2005)] Zamanov, R. K., Bode, M. F., Tomov, N. A., & Porter, J. M. 2005, MNRAS, 363, L26
- [Zinner(1938)] Zinner, E. 1938, Astronomische Nachrichten, 265, 345