Origin of the second peak in the cross section of the photoproduction
Abstract
By using a covariant isobar model and the latest experimental data we have analyzed the role of the and resonances in the kaon photoproduction process . Special attention has been paid to the region where the second peak in the cross section is located, i.e. at total c.m. energies around GeV. It is found that this peak originates mostly from the resonance contribution. Although the contribution of the resonance is not negligible, it is much smaller than that of the state. Our finding confirms that the resonance is also important in explaining the beam-recoil double polarization data and , provided that the mass and the width of this resonance are 1871 and 131 MeV, respectively.
pacs:
13.60.Le, 25.20.Lj, 14.20.GkIn 1998 the SAPHIR Collaboration observed for the first time a structure in the cross section of the process at a total c.m. energy GeV Tran:1998qw . This structure was analyzed and interpreted as evidence for a “missing” resonance missing-d13 in the model called Kaon-Maid kaon-maid . In spite of the fact that the inclusion of this resonance significantly improves the agreement between model predictions and experimental data, different interpretations have been also proposed Janssen:2001pe ; MartinezTorres:2009cw . Nevertheless, despite considerable efforts devoted to settle this issue, there has been no solid answer to the question: which resonance or mechanism is responsible for this structure?
Armed with the new generation of kaon photoproduction data from the CLAS Bradford:2005pt ; Bradford:2007 , LEPS Sumihama:2005er ; Hicks_2007 and GRAAL lleres09 ; lleres07 Collaborations, especially the double polarization and data from CLAS Bradford:2007 , the Bonn-Gatchina group reported the result of their coupled-channels partial waves analysis, that the structure should come from the contribution of the resonance Nikonov:2007br . To our knowledge, the possibility of the resonance as the origin of this structure was first pointed out in Ref. missing-d13 . Nevertheless, it was ruled out because the extracted decay width did not agree with the prediction of the constituent quark model capstick94 . The role of this resonance was also briefly discussed in Refs. Janssen:prc ; Mart:2006dk ; Julia-Diaz:2006is and finally in Refs. Nikonov:2007br ; Sarantsev:2005tg . Since most analyses were performed in the framework of partial waves, it is therefore important to check this finding using the same tool as in Kaon-Maid, so that a comparison with Kaon-Maid can be made under the same conditions. Moreover, more precise experimental data mcCracken have been just made available after the Bonn-Gatchina report Nikonov:2007br appeared. Thus, we believe that a more accurate analysis could be expected.
To this end, we consider the standard nucleon resonances in the Particle Data Group (PDG) listing pdg2010 which have masses between the threshold (1.609 GeV) and 2.2 GeV, the same energy range considered in the Kaon-Maid analysis missing-d13 . To simplify the analysis, as well as to make a fair comparison with Kaon-Maid, we limit the resonance spin only up to 3/2. Furthermore, we also include the state, which was found to be important in the photoproduction of , , and Sarantsev:2005tg .
| Parameter | Present work | Kaon-Maid | ||
|---|---|---|---|---|
| A | B | A1 | B1 | |
| (MeV) | 1886 | 2080 | 1976 | 2080 |
| (MeV) | 244 | 450 | 736 | 450 |
| 0.809 | 0.325 | |||
| 0.726 | 0.244 | |||
| (MeV) | 1900 | 1871 | 1900 | 1954 |
| (MeV) | 180 | 131 | 180 | 123 |
| (MeV) | 1952 | 1843 | - | - |
| (MeV) | 413 | 311 | - | - |
| 0.583 | 0.661 | - | - | |
| 3566 | 3566 | 319 | 319 | |
| 2.57 | 2.68 | 2.42 | 3.12 | |
Our covariant isobar model is constructed from the appropriate Feynman diagrams consisting of the background and resonance terms with hadronic form factors inserted in hadronic vertices Haberzettl:1998eq . The background terms consist of the standard -, -, and -channel Born terms along with the and -channel vector mesons. Two hyperon resonances that have been found to be important in reducing the divergence of the Born terms at high energies Janssen:2001pe , the and , are also included. For the resonance terms the model takes the , , , , , , , , and nucleon resonances into account. Their coupling constants were determined from fitting to a database consisting of differential cross section Bradford:2005pt ; mcCracken ; Sumihama:2005er ; Hicks_2007 , recoil polarization Bradford:2005pt ; lleres07 , beam-recoil double polarization Bradford:2007 and lleres09 , as well as photon and target asymmetries lleres07 data. Thus, our present database consists of 3566 data points, whereas Kaon-Maid was only fitted to 319 data points Tran:1998qw .
To investigate the role of the and resonances in the process, we perform two different fits. In the first fit we fix the mass and width of the resonance to their PDG values pdg2010 , i.e. 1900 and 180 MeV, respectively, whereas the mass and width of the state are taken as free parameters. In the second fit, the mass and width of the resonance are considered as free parameters, whereas those of the state are fixed to the PDG values, i.e., 2080 and 450 MeV, respectively. For the sake of brevity, the first (second) fit will be called Model A (B). In all fits the mass and width of the resonance are taken as free parameters.
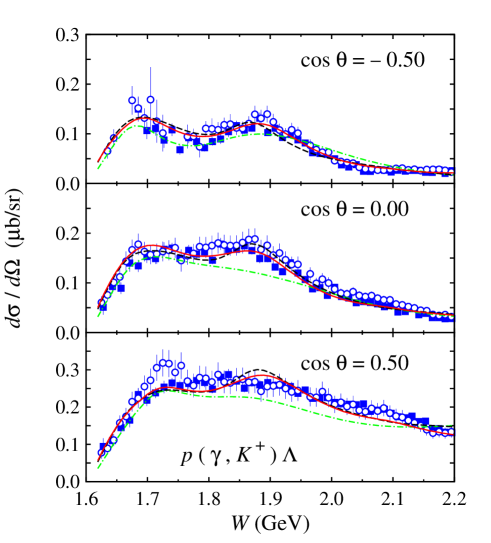
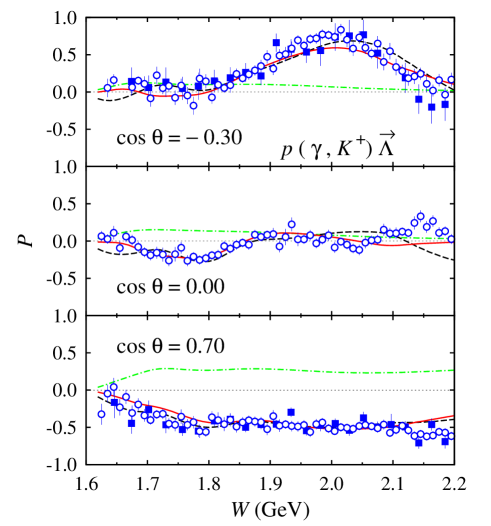
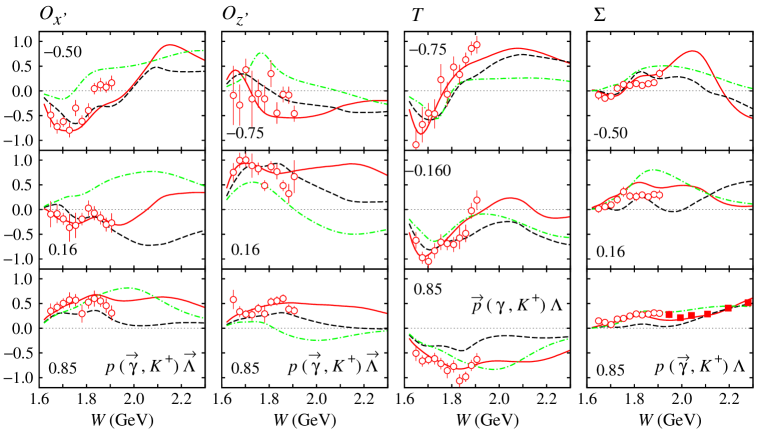
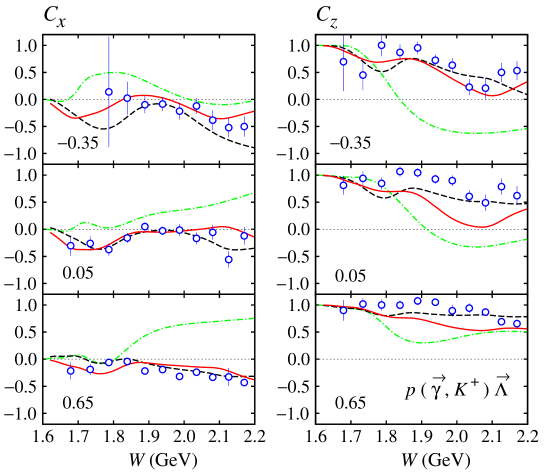
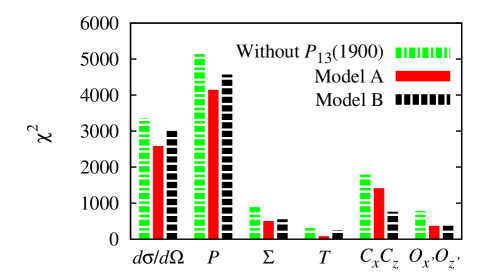
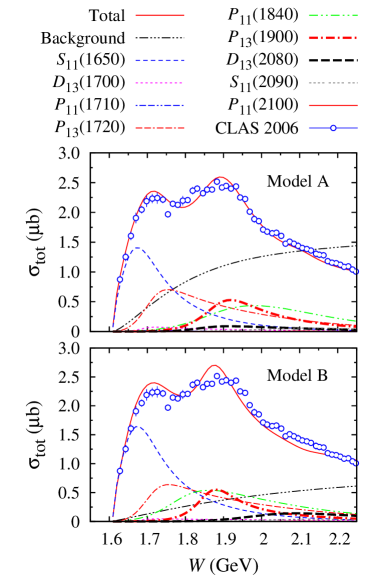
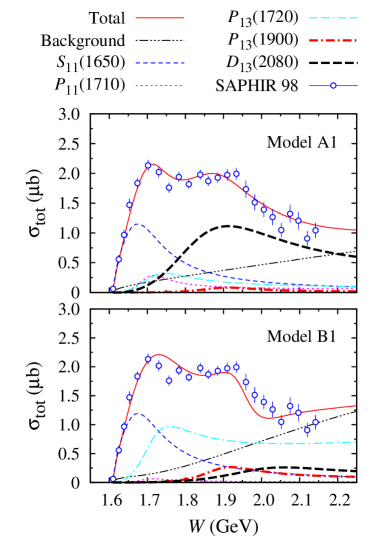
Table 1 shows the parameters of three most important resonances extracted from the fitting process. Obviously, the fitted and masses tend to have values around 1900 MeV. This result might indicate that both and states could significantly contribute in both models. We note that when we exclude the resonance the best obtained is 3.52, which is significantly larger than that obtained from both models.
It has been found that the resonance is quite important in reproducing the and data Nikonov:2007br . In the present analysis we found that without this resonance, the contribution of the from the and data to the total is about 15%. Including this resonance in Model A (B) increases (decreases) this number to 16% (8%). The latter emphasizes the role of the state in explaining the and data, provided that the mass and width of this state are taken as free parameters. Presumably, this is due to the structure shown by the and data at slightly below 1.9 GeV (see Fig. 5), which can be better explained by a resonance rather than a one.
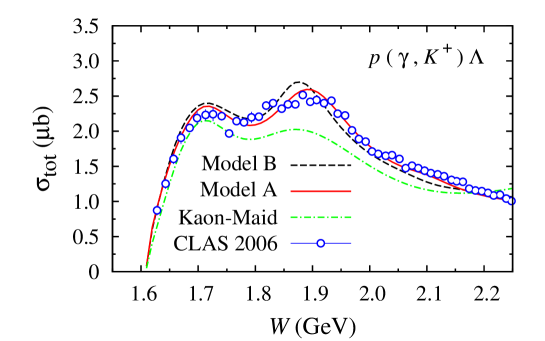
However, it should be remembered that the increase of the contribution after including the resonance in Model A does not mean that the is insignificant in explaining the the and data in this model, since the relative contribution discussed above refers to the total , which is certainly smaller in Model A (i.e. 2.57 as compared to 3.52). This is elucidated by the individual contributions shown in Fig. 6. Without the resonance the and data contributes or equivalent to , where is the number of and data with total c.m. energies up to 2.2 GeV. Including this resonance in Model A (B) results in or . Thus, one could conclude that in both models the role of the state is found to be important in explaining the and data, especially in Model B. However, Fig. 6 also indicates that only the and data prefer Model B, in which the mass is 1871 MeV. Therefore, the second peak in the cross section (as well as other observables except the and ones) prefer a ”different” resonance with a mass of about 1900 MeV (Model A). This is understandable since the position of the peak is located around 1900 MeV. The result also explains the shift of the second peak calculated using Model B from the data, as is obviously seen in Figs. 1 and 7.
The need for two different resonances in order to explain the experimental data around 1900 MeV could indicate the existence of two resonances with masses around 1900 MeV. Indeed, in their recent study the Bonn-Gatchina group Nikonov:2007br found two poles around 1900 MeV, as will be discussed below.
The performance of the two models in explaining experimental data is shown in Figs. 1–5, where we also display predictions of Kaon-Maid for comparison. The underprediction of Kaon-Maid in both total and differential cross sections is understandable, since the SAPHIR 1998 cross sections Tran:1998qw are smaller than the CLAS ones Bradford:2005pt , especially at the second peak around 1.9 GeV. The better agreement of Model A with experimental data can be observed in all but and data, which is directly understood from the individual contributions shown in Fig. 6. In fact, in both total and differential cross sections shown in Figs. 1 and 2 the second peak predicted by Model B seems to be shifted from experimental data, which might lead us to conclude that the second peak originates from the contribution. However, this is not true.
To analyze the individual contributions of nucleon resonances to this process, we plot contributions of each resonance to the total cross section for both models in Fig. 7. Obviously, contributions of the and resonances explain the first peak of the cross section. It is also clear that the resonance does not show up in this figure due to its small coupling to this process. This result corroborates our previous finding that uses the multipoles formalism to describe nucleon resonances Mart:2006dk . The absence of the resonance has been also pointed out in an extended partial-wave analysis of scattering data Arndt:2006bf .
Obviously, Fig. 7 shows that the resonance is responsible for the second peak in both models, whereas contribution of the state at this point is relatively small. This finding is in good agreement with the claim of the Bonn-Gatchina group Nikonov:2007br , which found two poles located at 1870 and 1950 MeV. Clearly, our finding corresponds to the first pole (see the second column of Table 1). Furthermore, our result is also consistent with the previous coupled-channels study Julia-Diaz:2006is and a very recent kaon photo- and electroproduction study based on a single-channel covariant isobar model maxwell . As shown in Table II of Ref. maxwell , the magnitude of the coupling constants is substantially larger than that of the ones. This is valid not only for fitting to photoproduction data, but also for fitting to the combination of photo- and electroproduction data. Since the and resonances have different parities, we have checked the result of Ref. maxwell explicitly and found that the contribution of the state is much larger than that of the state.
It also appears from Table 1 that both models yield different values of the mass. Model B gives a better agreement with Ref. Sarantsev:2005tg , whereas the extracted mass in Model A seems to be too high. Nevertheless, we also note that the later analysis from the Bonn-Gatchina group anisovich-EPJA yields a slightly larger mass range, i.e. 1850-1880 MeV.
If both and masses and widths are simultaneously fitted then we find a result almost similar to Model A, except the mass of the is slightly shifted from 1900 MeV to 1891 MeV. Furthermore, it is also understood that the important role of the in explaining the and data could be interpreted as simulating the final state interactions that are sensitive to the and observables. Therefore, although the present result corroborates the finding of the coupled-channels work of Ref. Nikonov:2007br , a more thorough study using a dynamical coupled-channels approach, which fully takes into account the final state interaction effects, is still required.
The finding presented in this paper is obviously in contrast to the conclusion drawn more than a decade ago on the evidence of the resonance missing-d13 . Perhaps, it is interesting to ask why such a conclusion could be drawn. There are two possible answers to this question. The first one corresponds to the criteria of the ”missing resonance.” In Kaon-Maid the SAPHIR data were fitted to some possible states with masses around 1900 MeV found in a constituent quark model capstick94 , i.e., the , , , and resonances. The extracted masses of these states are found to be , , , and MeV, with the corresponding , and , respectively. However, instead of using the , the relevant ”missing resonance” was determined by matching the corresponding decay width, which can be directly calculated from the extracted coupling constants, with the prediction of the constituent quark model capstick94 . As a result, the state was found to be the most relevant ”missing resonance”.
The second answer is related to experimental data. As discussed above, the use of the ”missing resonance” to describe the SAPHIR data results in , which is substantially larger than the use of the ”missing resonance”. This indicates that to produce the second peak the data prefer an state rather than a state. To further investigate the role of the resonance in the Kaon-Maid model, we refit the original model, but including this state in addition to the state in the fit, and using the same database as in the original model. The relevant extracted parameters are listed in the fourth and fifth columns of Table 1, while the contributions of individual resonances are depicted in Fig. 8. The result indicates that if we allow the mass to vary, while the mass is fixed to 1900 MeV (model A1), then the contribution will dominate the whole cross section and simultaneously build up the second peak. Contribution of the state is found to be tiny. Such a result is clearly still consistent with Kaon-Maid results.
However, a different conclusion would be obtained if we kept the mass fixed at 2080 MeV and varied the mass in the fit (model B1). As shown in Fig. 8, contribution of the state is strongly suppressed now, whereas contribution of the state is only slightly increased. To produce the second peak, contributions of both resonances must be added by a larger background. As a result, the total cross section obtained using this method shows a substantial difference from the previous one, especially at GeV. Therefore, we may conclude that the SAPHIR 1998 data do not prefer a state as a dominant contributor to the second peak in the cross section.
In conclusion we have analyzed the role of and resonances in the photoproduction off a proton, focusing on the second peak in the cross section as well as on the CLAS and data. We found that the peak originates mostly from the resonance. In contrast to Kaon-Maid results, the contribution of the is much smaller, even though its mass was fitted and found to be 1886 MeV, i.e., very close to the position of second peak. The resonance is also found to be important in reproducing the and data. The absence of the contribution in Kaon-Maid is related to the SAPHIR 1998 data, since the corresponding second peak can be best explained by means of the resonance. The present finding does not by any means reject the claim that the second peak could provide evidence for a resonance with MeV. It only shows that the evidence is weak.
This work has been supported in part by the University of Indonesia and the Competence Grant of the Indonesian Ministry of Education and Culture.
References
- (1) M. Q. Tran et al. [SAPHIR Collaboration], Phys. Lett. B 445, 20 (1998). References for older data can be found in the references of this paper.
- (2) T. Mart and C. Bennhold, Phys. Rev. C 61, 012201 (1999).
- (3) Available at the Maid homepage http://www.kph.uni-mainz.de/MAID/kaon/kaonmaid.html. The published versions can be found in: Ref. missing-d13 ; T. Mart, Phys. Rev. C 62, 038201 (2000); C. Bennhold, H. Haberzettl and T. Mart, arXiv:nucl-th/9909022.
- (4) S. Janssen, J. Ryckebusch, W. Van Nespen, D. Debruyne and T. Van Cauteren, Eur. Phys. J. A 11, 105 (2001)
- (5) A. Martinez Torres, K. P. Khemchandani, U. G. Meissner and E. Oset, Eur. Phys. J. A 41, 361 (2009).
- (6) V. A. Nikonov, A. V. Anisovich, E. Klempt, A. V. Sarantsev and U. Thoma, Phys. Lett. B 662, 245 (2008).
- (7) R. Bradford et al. [CLAS Collaboration], Phys. Rev. C 73, 035202 (2006).
- (8) R. Bradford et al. [CLAS Collaboration], Phys. Rev. C 75, 035205 (2007).
- (9) M. Sumihama et al. [LEPS Collaboration], Phys. Rev. C 73, 035214 (2006).
- (10) K. Hicks et al. [LEPS Collaboration], Phys. Rev. C 76, 042201 (2007).
- (11) A. Lleres et al., Eur. Phys. J. A 31, 79 (2007).
- (12) A. Lleres et al., Eur. Phys. J. A 39, 146 (2009).
- (13) S. Capstick and W. Roberts, Phys. Rev. D 49, 4570 (1994).
- (14) T. Mart and A. Sulaksono, Phys. Rev. C 74, 055203 (2006).
- (15) B. Julia-Diaz, B. Saghai, T. S. H. Lee and F. Tabakin, Phys. Rev. C 73, 055204 (2006).
- (16) S. Janssen, J. Ryckebusch, D. Debruyne and T. Van Cauteren, Phys. Rev. C 65, 015201 (2001).
- (17) A. V. Sarantsev, V. A. Nikonov, A. V. Anisovich, E. Klempt and U. Thoma, Eur. Phys. J. A 25, 441 (2005).
- (18) H. Haberzettl, C. Bennhold, T. Mart and T. Feuster, Phys. Rev. C 58, 40 (1998).
- (19) M. E. McCracken et al. [CLAS Collaboration], Phys. Rev. C 81, 025201 (2010).
- (20) K. Nakamura et al., J. Phys. G 37, 075021 (2010).
- (21) R. A. Arndt, W. J. Briscoe, I. I. Strakovsky and R. L. Workman, Phys. Rev. C 74, 045205 (2006).
- (22) O. V. Maxwell, Phys. Rev. C 85, 034611 (2012).
- (23) A. V. Anisovich, E. Klempt, V. A. Nikonov, A. V. Sarantsev, and U. Thoma, Eur. Phys. J. A 47, 27 (2011).