Spin dependent recombination based magnetic resonance spectroscopy of bismuth donor spins in silicon at low magnetic fields
Abstract
Low-field ( mT) magnetic resonance of bismuth (Bi) donors in silicon has been observed by monitoring the change in photoconductivity induced by spin dependent recombination. The spectra at various resonance frequencies show signal intensity distributions drastically different from that observed in conventional electron paramagnetic resonance, attributed to different recombination rates for the forty possible combinations of spin states of a pair of a Bi donor and a paramagnetic recombination center. An excellent tunability of Bi excitation energy for the future coupling with superconducting flux qubits at low fields has been demonstrated.
Among a variety of qubits investigated for the realization of solid-state quantum computers, superconducting qubits are the leading candidates for quantum processors because of their fast operation capabilities ( pulse shorter than 10 ns).Chiorescu et al. (2003) However, the shortcoming of their relatively fast decoherence time needs to be overcome by connecting to memory qubits that can store quantum information throughout the course of computation. This requires memory qubits working under low magnetic field, typically below 10 mT for aluminum superconducting qubits,Cochran and Matpother (1958) since they cannot operate at higher fields.
In this context, the bismuth (Bi) donor in silicon (Si) has attracted much attention recently. Its large hyperfine interaction GHz (Ref. [Feher, 1959]) and the 209Bi nuclear spin give a large zero-field splitting of 7.4 GHz. This splitting is comparable to the typical energy splitting between and states of superconducting flux qubits.Chiorescu et al. (2003); Zhu et al. (2011) Thus, coupling between a Bi spin qubit and a superconducting flux qubit on Si is in principle possible via a microwave photon through a waveguide. A proposal of such an applicationMorley et al. (2010) has prompted extensive research on the Bi donor spins in Si very recently.Morley et al. (2010); George et al. (2010) Starting from the spectroscopic analysis of the electron paramagnetic resonance (EPR),George et al. (2010); Weis et al. (2012) the electron spin relaxation time ,Morley et al. (2010); Belli, Fanciulli, and Abrosimov (2011) decoherence time ,Morley et al. (2010); Belli, Fanciulli, and Abrosimov (2011); Weis et al. (2012) and superhyperfine interaction with nearby 29Si nuclear spins Belli, Fanciulli, and Abrosimov (2011) were investigated. Moreover, the coherent transfer between electron and 209Bi nuclear spinsGeorge et al. (2010) and dynamic nuclear polarization of 209BiMorley et al. (2010); Sekiguchi et al. (2010) were achieved. Yet all of these EPR studies were performed at 9 GHz (around 320 mT) and at 240 GHz (around 8.6 T) excitation frequency.
In this paper we report on low-field ( mT) radio frequency ( MHz) and microwave (8.141 GHz) magnetic resonance, as well as X-band (9 GHz) magnetic resonance, of ion-implanted Bi donors in Si using a highly sensitive, spin dependent recombination based magnetic resonance (SDR-MR) method.Vranch, Henderson, and Pepper (1988); Vlasenko et al. (1995); Laiho, Vlasenko, and Vlasenko (1995); Vlasenko and Vlasenko (1995)
The samples were prepared from highly resistive ( cm), float-zone (FZ) n-type silicon wafers implanted with Bi ions at room temperature with a total fluence of cm-2. The implantation energies are 300 and 550 keV with the doses of and cm-2, respectively. This condition leads to the Bi concentration of about cm-3 in the depth of 90 to 150 nm from the surface. The post-implantation annealing was performed at 650 for 30 min in an evacuated quartz tube. This annealing condition has been shown to achieve the electrical activation of 80 ,Souza and Fichtner (1993); Baron, Shifrin, and Marsh (1969); Weis et al. (2012) thus yielding about Bi donors in a 0.3 cm2 sample area. The SDR-MR spectra were recorded at 16 K with a commercial continuous wave EPR spectrometer (JEOL JES-RE3X) working at X-band (9 GHz microwave) with a homemade coil for radio frequency ( MHz) and microwave (8.141 GHz) irradiation to induce magnetic resonance at low field ( mT). Continuous illumination with a 100-W halogen lamp generates photocarriers in the sample. Magnetic resonance can enhance the spin-dependent recombination, which decreases the density of photocarriers. Then, the absorption of the microwave electric field by the photocarriers is decreased, leading to an enhancement in the Q-factor of the cavity. Thus, the effect of magnetic resonance can be detected simply as the change in the X-band microwave reflection from the cavity. The second derivative of the reflected intensity with respect to the field modulation was recorded as an SDR signal to reduce the broad cyclotron resonance lines and the background change of the sample resistivity during the magnetic field scan. Note that because of our high power (80 mW) saturating excitation, i. e., making the populations of the ground- and excited-states the same, the conventional EPR absorption signal is suppressed. Such saturation is necessary to flip one of the spins in a pair of Bi and defect to induce SDR as we will discuss later.
The spin system of an isolated Bi donor in static magnetic field (electron spin and 209Bi nuclear spin ) can be represented by the spin Hamiltonian:
| (1) |
where and are the Bohr and nuclear magnetons, and (Ref. [Feher, 1959]) and (Ref. [Morley et al., 2010]) are Bi electron and nuclear -factors, respectively. The SDR method requires a coupled pair of electron spins.Kaplan, Solomon, and Mott (1978); Cox et al. (1978); Morishita et al. (2009) In the present study, the partner of the Bi donor electron spin is the electron spin of a deep paramagnetic recombination center (PRC) which is supposed to be created during the implantation process and not completely removed by controlling the annealing conditions.Miksic et al. (2002) We have attempted to identify the symmetry of the deep PRC by tracing the angular dependence of the EPR peaks. However, the peaks were too broad to draw conclusions.
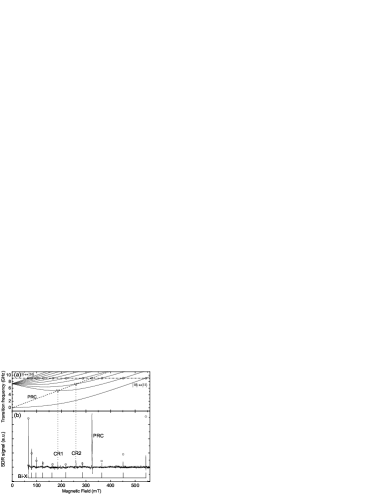
The X-band (9.076 GHz) SDR-MR spectrum measured without radio frequency excitation is presented in Fig. 1(b). The peaks labeled as Bi-X and PRC indicate ten EPR-“allowed” transitions of the Bi donors and one EPR transition of a PRC, respectively, corresponding to the intersections with the 9.076 GHz excitation in Fig. 1(a). Here the EPR transition frequencies of the Bi donor (solid curves)Mohammady, Morley, and Monteiro (2010) were calculated as functions of the static magnetic field using the spin Hamiltonian in Eq. (1) and that of PRC (dashed curve) was calculated as an isotropic, nuclear spin free, paramagnetic center and . The same notation as in Ref. [Mohammady, Morley, and Monteiro, 2010] for labeling Bi eigenstates is used; the labels 1 to 20 in increasing order of energy.
In addition, two lines labeled as CR1 (186 mT) and CR2 (259 mT) arise due not to the resonance with the 9.076 GHz microwave but to cross relaxation (CR) between particular Bi donor transitions and the PRC transitions, in a way very similar to the cross relaxation between phosphorus donors and SL1 centers in Si observed by electrically detected magnetic resonance.Akhtar et al. (2011) This assignment of CR1 and CR2 is further justified in Fig. 2. Even with the decrease in the microwave excitation frequency, the position of these lines remains the same whereas the Bi EPR line positions shift to lower fields. This proves the presence of coupling between the Bi donor and PRC electron spins, which is requisite for the SDR detection method.
We should emphasize that even at the same X-band resonance of the Bi donor, the observed SDR-MR line intensity distribution is clearly different from that observed in the conventional EPR spectra. Morley et al. (2010); George et al. (2010); Mohammady, Morley, and Monteiro (2010); Belli, Fanciulli, and Abrosimov (2011) The intensity differs for the ten different transitions in the present SDR-MR whereas it is practically the same in conventional EPR, reflecting simply the thermal equilibrium population difference between the involved levels. Furthermore, the observed line-dependence of the SDR-MR intensity is distinctively stronger than the line dependence in the EPR transition.Mohammady, Morley, and Monteiro (2010)
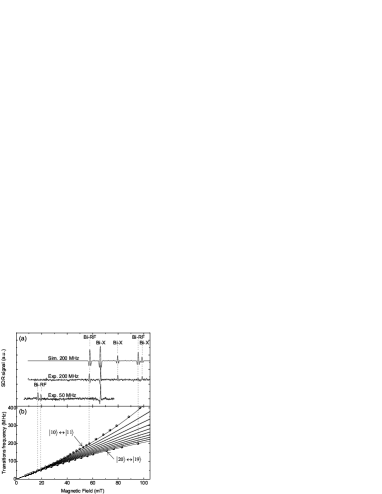
Figure 3(a) shows the SDR-MR spectra probed by the same X-band microwave but with additional radio frequency excitation of 50 or 200 MHz. A simulation of the 200 MHz SDR-MR spectrum based on the SDR model that will be introduced later is also shown. Figure 3(b) shows the observed SDR-MR line positions (solid circles) for radio frequency excitation ranging from 20 to 400 MHz together with the calculated magnetic resonance transition frequencies for the Bi donor (solid curves). All of these simulated Bi magnetic resonance transitions are the 209Bi NMR transitions in the high field limit. While the number of calculated Bi NMR lines in Fig. 3(b) appears ten, all but the lowest- and highest-field lines are nearly-degenerate doublets, i.e., each is composed of two lines separated by exactly twice the nuclear Zeeman splitting energy. Therefore, among the eighteen EPR transitions of the Bi donor excited by these radio frequencies, we observed clearly the two non-degenerate lines labeled as Bi-RF in Fig. 3. The remaining eight doublets are too weak to be observed with the current experimental conditions.

As mentioned above, considering only the EPR transition probabilities Mohammady, Morley, and Monteiro (2010) cannot describe the intensity of SDR-MR. In the following, we shall present a model, based on the SDR model developed in Refs. [Boehme and Lips, 2001, 2003, 2006], to simulate the SDR-MR spectra that are shown in Fig. 1(b) and Fig. 3(a). The SDR signal intensity, measured by probing the microwave intensity reflected by the cavity, is linear to the sample photoconductivity . Its change by magnetic resonance through SDR process can be written as:
| (2) |
where the subscripts and denote the Bi donor and PRC spin states, respectively. and are the recombination rate and population of the specified pair. Here the square bracket represents the change in the population from off-resonance () to saturated magnetic resonance () conditions where is the excitation power. Eq. (2) is valid when the recombination rates can be assumed dominant over the pair generation and dissociation rates as well as the spin-lattice relaxation and spin decoherence rates. Furthermore, if only one transition between two Bi states and is selectively excited, the change in photoconductivity becomes:
| (3) | |||||
Using the rate equations described in Ref. [17], Eq. (3) simplifies to:
| (4) |
The first term of Eq. (4) corresponds to the number of recombining pairs when the resonance is saturated whereas the second and third terms are the off-resonance terms. Thus, a large change in SDR signal should be obtained when either or is much smaller than the other. Finally, to evaluate the recombination rates and , the product state of the Bi donor and the PRC is considered:
| (5) | |||||
In the right-hand side, the Bi state () is represented by the product of the electron () and nuclear spin () states with the total spin -component of is represented on the basis of the electron () and nuclear () spin -component eigenstates. Abragam and Bleaney (1970) Note that there are two different Bi eigenstates for one particular , except for . The mixing angle depends on the Bi state and is a function of the parameters in the Hamiltonian, Eq. (1), as explicitly described in Ref. [Mohammady, Morley, and Monteiro, 2010]. Depending on the state of PRC (, denoted by ), each term in Eq. (5) gives contribution to the recombination rate in terms of spin parallel () or anti-parallel () pair:
| (6) |
| (7) |
Then, only the recombination associated with the pure states, () and (), have single components that are strictly parallel or anti-parallel, while the other states have a mixture of the two components. This, in combination with Eq. (4), is the reason why the highest- and lowest-field lines, which involve the Bi state or , are stronger than the other lines at X-band resonance and exclusively strongest at the radio frequency resonance. We used this model to perform the simulation of the X-band spectrum in Fig. 1(b) and the 200 MHz spectrum in Fig. 3(a). The ratio has led to good agreement with the experiments and is comparable to the recently reported value for the phosphorus donor in Si.Dreher et al. (2012) Note that, for the X-band spectrum we also take into account that an EPR transition line that is “forbidden” in the high-field limit overlaps with each EPR-“allowed” one except for the highest- and lowest-field lines that involve one pure state.Mohammady, Morley, and Monteiro (2010)
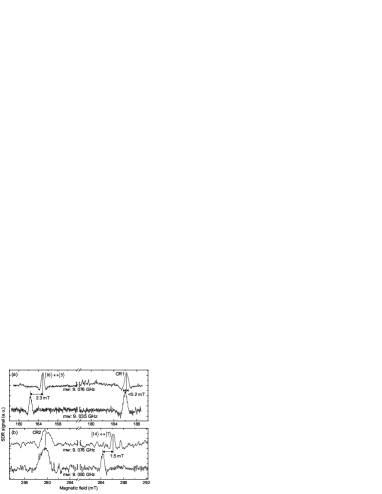
Finally, we shall demonstrate the tunability of such “pure-state” transitions to the energy comparable to the superconducting qubits. As shown in Fig. 4 (a), an additional 8.141 GHz microwave excitation in the same SDR method allows for successful excitation and detection of the EPR transition between Bi and levels at low field ( mT). Although it is preferred to achieve mT for the coupling with the superconducting qubit, Fig. 4 shows clearly the flexibility to tune the energy difference between up and down states of the Bi electron spin. It is also possible to tune the superconducting flux qubit to match the energy between and states with the Bi transition frequency separating and states. The coupling strength between the flux qubit and Bi is expected in the range of kHz.Zhu et al. (2011) Figure 4(b) shows a result of a similar experiment but with two excitation frequencies generated by two coils perpendicular to each other. The second coil was used to irradiate 100-MHz excitation frequency. The Bi-RF and Bi-8 GHz resonance lines are observed together. Hence, this experimental setup allows us to perform SDR-MR with two arbitrary excitation frequencies.
In summary, we have obtained the electron paramagnetic resonance spectra of a small number () of Bi donors in Si at low magnetic field ( mT). The detection was based on the measurement of the sample photoconductivity which changed significantly at the time of resonance due to specific spin-dependent-recombination phenomena. The spin-dependent-recombination process takes place via coupling of the electron spins between Bi donors and nearby paramagnetic recombination centers. The relative intensity of each resonance line has been described well by a spin-dependent-recombination model based on the mixing of Bi donor electron and nuclear spins.
This work was supported in part by Grant-in-Aid for Scientific Research and Project for Developing Innovation Systems by MEXT, FIRST, and JST-EPSRC/SIC (EP/H025952/1).
References
- Chiorescu et al. (2003) I. Chiorescu, Y. Nakamura, C. J. P. M. Harmans, and J. E. Mooij, Science 299, 1869 (2003).
- Cochran and Matpother (1958) J. F. Cochran and D. E. Matpother, Phys. Rev. 111, 132 (1958).
- Feher (1959) G. Feher, Phys. Rev. 114, 1219 (1959).
- Zhu et al. (2011) X. Zhu, S. Saito, A. Kemp, K. Kakuyanago, S. Karimoto, H. Nakano, W. J. Munro, Y. Tokura, M. S. Everitt, K. Nemoto, M. Kasu, N. Mizuochi, and K. Semba, Nature 478, 221 (2011).
- Morley et al. (2010) G. W. Morley, M. Warner, A. M. Stoneham, P. T. Greenland, J. van Tol, C. W. M. Kay, and G. Aeppli, Nature Mat. 9, 725 (2010).
- George et al. (2010) R. E. George, W. Witzel, H. Riemann, N. V. Abrosimov, N. Nötzel, M. L. W. Thewalt, and J. J. L. Morton, Phys. Rev. Lett. 105, 067601 (2010).
- Weis et al. (2012) C. D. Weis, C. C. Lo, V. Lang, A. M. Tyryshkin, R. E. George, K. M. Yu, J. Bokor, S. A. Lyon, J. J. L. Morton, and T. Schenkel, Appl. Phys. Lett. 100, 172104 (2012).
- Belli, Fanciulli, and Abrosimov (2011) M. Belli, M. Fanciulli, and N. Abrosimov, Phys. Rev. B 83, 235204 (2011).
- Sekiguchi et al. (2010) T. Sekiguchi, M. Steger, K. Saeedi, M. L. W. Thewalt, H. Riemann, N. V. Abrosimov, and N. Nötzel, Phys. Rev. Lett. 104, 137402 (2010).
- Vranch, Henderson, and Pepper (1988) R. L. Vranch, B. Henderson, and M. Pepper, Appl. Phys. Lett. 52, 1161 (1988).
- Vlasenko et al. (1995) L. S. Vlasenko, M. P. Vlasenko, T. Gregorkiewicz, and C. A. J. Ammerlaan, Phys. Rev. B 52, 1144 (1995).
- Laiho, Vlasenko, and Vlasenko (1995) R. Laiho, L. S. Vlasenko, and M. P. Vlasenko, Mater. Sci. Forum 196, 517 (1995).
- Vlasenko and Vlasenko (1995) L. S. Vlasenko and M. P. Vlasenko, Mater. Sci. Forum 196, 1537 (1995).
- Souza and Fichtner (1993) J. P. Souza and P. F. P. Fichtner, J. Appl. Phys. 74, 119 (1993).
- Baron, Shifrin, and Marsh (1969) R. Baron, G. A. Shifrin, and O. J. Marsh, J. Appl. Phys. 40, 3702 (1969).
- Kaplan, Solomon, and Mott (1978) D. Kaplan, I. Solomon, and N. F. Mott, J. Phys. (France) Lett. 39, 51 (1978).
- Cox et al. (1978) R. T. Cox, D. Block, A. Herve, R. Picard, C. Santier, and R. Heibig, Solid State Commun. 25, 77 (1978).
- Morishita et al. (2009) H. Morishita, L. S. Vlasenko, H. Tanaka, K. Semba, K. Sawano, Y. Shiraki, M. Eto, and K. M. Itoh, Phys. Rev. B 80, 205206 (2009).
- Miksic et al. (2002) V. Miksic, B. Pivac, B. Rakvin, H. Zorc, F. Corni, R. Tonini, and G. Ottaviani, Nucl. Instr. and Meth. in Phys. Res. B 186, 36 (2002).
- Mohammady, Morley, and Monteiro (2010) M. Mohammady, G. Morley, and T. Monteiro, Phys. Rev. Lett. 105, 067602 (2010).
- Akhtar et al. (2011) W. Akhtar, H. Morishita, K. Sawano, Y. Shiraki, L. S. Vlasenko, and K. M. Itoh, Phys. Rev. B 84, 045204 (2011).
- Boehme and Lips (2001) C. Boehme and K. Lips, Appl. Phys. Lett. 79, 4363 (2001).
- Boehme and Lips (2003) C. Boehme and K. Lips, Phys. Rev. B 68, 245105 (2003).
- Boehme and Lips (2006) C. Boehme and K. Lips, Charge Transport in Disordered Solids, wiley ed., edited by S. Baranovski (2006) pp. 179–219.
- Abragam and Bleaney (1970) A. Abragam and B. Bleaney, Electron Paramagnetic Resonance of Transition ions (Oxford Univ. Press, Oxford, UK, 1970).
- Dreher et al. (2012) L. Dreher, F. Hoehne, M. Stutzmann, and M. S. Brandt, Phys. Rev. Lett. 108, 027602 (2012).