Improving the performance of bright quantum dot single photon sources using amplitude modulation
Abstract
Single epitaxially-grown semiconductor quantum dots have great potential as single photon sources for photonic quantum technologies, though in practice devices often exhibit non-ideal behavior. Here, we demonstrate that amplitude modulation can improve the performance of quantum-dot-based sources. Starting with a bright source consisting of a single quantum dot in a fiber-coupled microdisk cavity, we use synchronized amplitude modulation to temporally filter the emitted light. We observe that the single photon purity, temporal overlap between successive emission events, and indistinguishability can be greatly improved with this technique. As this method can be applied to any triggered single photon source, independent of geometry and after device fabrication, it is a flexible approach to improve the performance of solid-state systems, which often suffer from excess dephasing and multi-photon background emission.
pacs:
78.67.Hc, 42.70.Qs, 42.60.DaSolid-state quantum emitters are potentially bright, stable, and monolithic sources of triggered single photons for scalable photonic quantum information technology Lounis and Orrit (2005); Santori et al. (2010). Source properties which must be optimized for applications include the fraction of photons emitted into a useful optical channel, the repetition rate at which the source is operated, the degree to which multi-photon emission is suppressed, and the extent to which the single photons are identical. One specific solid-state system that has drawn considerable interest is the InAs/GaAs quantum dot (QD) heterostructure. Despite significant development of these sources, achieving good performance with respect to all of the aforementioned parameters can be challenging Shields (2007); Michler (2009). For example, the high refractive index contrast between GaAs and air requires modification of the geometry to prevent most of the QD emission from remaining trapped within the semiconductor. The existence of radiative states within the QD heterostructure that are spectrally resonant with the transition of interest can limit the single photon purity of the emission. Interactions between the excitonic transition and electronic carriers and phonons in the host semiconductor can cause dephasing that prevents the emitted photons from being perfectly indistinguishable.
Researchers have developed a number of tools to address these limitations. Nanofabricated photonic structures can ensure that a significant fraction of the QD emission is collected Pelton et al. (2002); Solomon et al. (2001); Strauf et al. (2007); Claudon et al. (2010); Davanço et al. (2011a). Optical excitation resonant with excited states of the QD can limit multi-photon emission Santori et al. (2004), increase the coherence time, and improve the degree of indistinguishability Santori et al. (2002); Ates et al. (2009); Weiler et al. (2011). Purcell-enhancement of the radiative rate through modification of the QD’s electromagnetic environment Gérard and Gayral (1999) can also produce single photon wavepackets that are more indistinguishable Santori et al. (2002); Varoutsis et al. (2005); Weiler et al. (2011); furthermore, it increases the maximum repetition rate at which the source can be operated.
Here, we describe a different approach to improving the performance of QD single photon sources (SPSs). Rather than influencing the QD radiative dynamics, we instead use temporal filtering through electro-optic amplitude modulation to process and purify the QD emission. Synchronized modulation of single photon wavepackets has recently been demonstrated for both atomic Kolchin et al. (2008); Specht et al. (2009) and QD systems Rakher and Srinivasan (2011), but those works focused primarily on demonstrating that modulation was possible and the variety of wavepacket shapes that it could produce. We begin by demonstrating a bright, fiber-coupled SPS ( overall collection efficiency into the fiber) based on a QD in a microdisk cavity, and then show that the ability to temporally select portions of the emitted signal can lead to large improvements in the purity and indistinguishability of the source. In particular, we demonstrate an improvement in the single photon purity by a factor as high as , enough temporal separation between successive emission events to achieve a 0.5 GHz repetition rate source, and an improvement in the two-photon wavepacket overlap by a factor of . In contrast to other approaches which require modification of the source, this technique can be applied to any existing solid-state triggered SPS, regardless of the device geometry and excitation method (optical or electrical), and can thus be a versatile resource when implementing solid-state SPSs in quantum information applications.
Efficient fiber-coupled single photon source
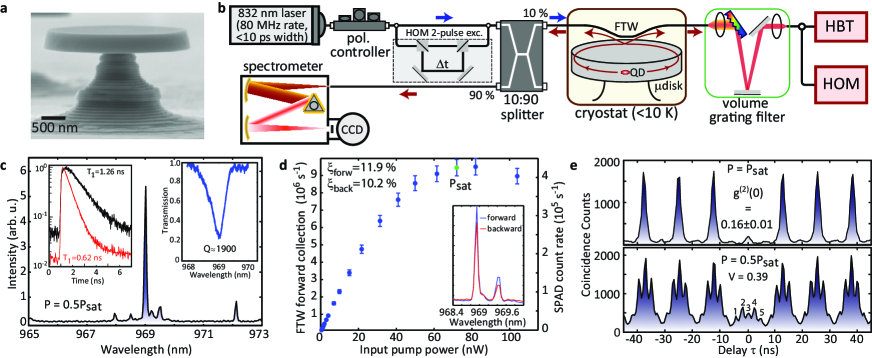
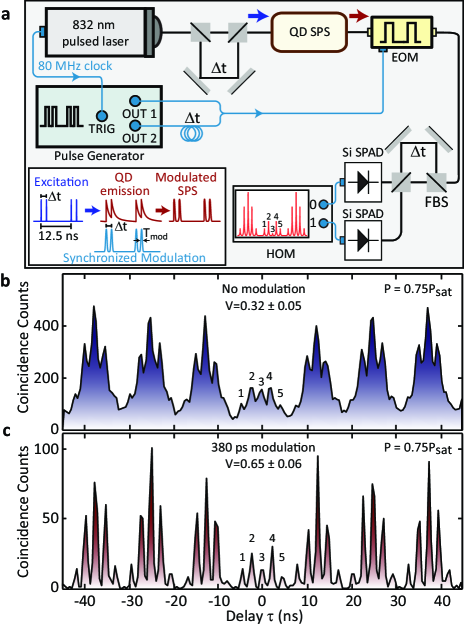
We use a self-assembled InAs QD embedded in a GaAs microdisk cavity (Fig. 1a) as a triggered SPS. Our main objective is to produce a bright source under pulsed excitation. We use relatively small diameter (m) devices to obtain a high QD spontaneous emission coupling fraction into the resonant whispering gallery modes (WGMs) of the microdisk. Efficient outcoupling of the WGMs is achieved using a fiber taper waveguide (FTW), an approach previously used to create fiber-coupled microdisk-quantum-dot lasers Srinivasan et al. (2006) and waveguide SPSs Davanço et al. (2011b). Out-coupling of a WGM through the FTW is quantified by an efficiency , whose value is experimentally determined by measuring the transmission spectrum of the cavity (see Supplementary Information [ref, ]). The overall collection efficiency of photons into each channel of the FTW is , in the limit of unity QD radiative efficiency.
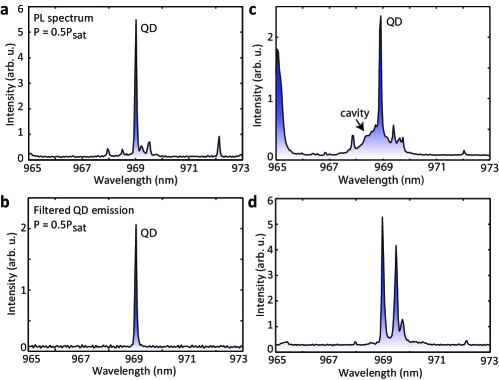
The setup shown in Fig. 1b is used to measure the low-temperature micro-photoluminescence spectrum of a microdisk-QD device shown in Fig. 1c, where a bright excitonic line is observed on top of a broad cavity mode at 969 nm. The relatively low quality factor mode (Q = 1900; see inset transmission spectrum) results in a Purcell factor , as determined by measuring the emission lifetime when the QD is on-resonance with the mode and far-detuned from it (inset to Fig. 1c). The brightness of the QD source is determined through the excitation power-dependent intensity of the filtered signal, which is directly measured with a Si single-photon avalanche diode (SPAD), as shown in Fig. 1d. The right vertical axis is the measured count rate at the detector, while the left axis is the photon count rate coupled to the forward channel of the FTW, factoring in the losses due to spectral filtering, detection efficiency of the SPAD, and the transmission of the FTW (see Supplementary Information). At saturation, a collection efficiency into the forward channel of the FTW is estimated. Ideally, collection into the backward channel will equal that into the forward channel; for this device, we measure a slight reduction (by 14 ) in the backward channel (inset of Fig. 1d), most likely due to asymmetric losses in the setup. This yields for the backward channel, so that if both channels are combined, the overall collection efficiency into the FTW is .
The single-photon nature of the collected QD emission is demonstrated by measuring the second-order photon correlation function using a Hanbury-Brown and Twiss (HBT) setup ref . Even at , the pump power for which the emission is highest, we observe (upper panel of Fig. 1e) a clear suppression of the correlation peak at zero time delay, with . We also characterize the indistinguishability of the single photon emission using a Hong-Ou-Mandel (HOM) interferometer Hong et al. (1987); Santori et al. (2002), where consecutively emitted photons are overlapped on a beamsplitter. As discussed in Ref. Santori et al., 2002 and in the Supplementary Information, the degree of indistinguishability is experimentally related to , where are the areas of the peaks labeled in the lower panel of Fig. 1e. For our QD SPS with at (Fig. 2(d)), can only occur if there is two-photon interference (see Supplementary Information). is observed in Fig. 1e, indicating a degree of indistinguishability that is quantified by the two-photon wavepacket overlap ref .
Since approaches 50 in these devices (half into each of the clockwise and counterclockwise modes), improving the brightness of this source requires an increase in , which is estimated to be 25 in the current devices ref . This would require improved overlap between the FTW and microdisk WGMs, through adjustment of the microdisk and FTW dimensions. While the demonstrated brightness of (22 ) into one (both) channel of the fiber is smaller than the collection into the first optic in recent demonstrations Strauf et al. (2007); Claudon et al. (2010), it has the advantages of being directly fiber-coupled, exhibiting Purcell enhancement with a relatively low value at saturation, and having indistinguishability with a two-photon wavepacket overlap of 39 . The direct fiber coupling allows us to easily interface the bright QD emission with the wide variety of fiber-coupled optoelectronic components available in the 980 nm region. Among these is a fiber-coupled electro-optic amplitude modulator, which we use in the following sections to manipulate the purity, repetition rate, and indistinguishability of the QD SPS.
Improving the purity of the single photon source
A non-zero value of is commonly measured in QD SPSs, and indicates the presence of temporally coincident multi-photon emission (within the timing resolution of the system). Such emission can originate from other spectrally-resonant radiative transitions in the system that arise due to the nature of the QD confinement, which supports a quasi-continuum of (multi)excitonic transitions whose emission can be enhanced by the presence of a cavity mode Winger et al. (2009); Chauvin et al. (2009); Laucht et al. (2010). Another process that can lead to is carrier recapture on a time scale comparable to the QD radiative lifetime, which can enable the emission of more than one photon per excitation pulse Santori et al. (2004); Peter et al. (2007); Aichele et al. (2004). In this section, we show how amplitude modulation can reduce the multi-photon contribution, thereby improving the purity of the QD SPS.
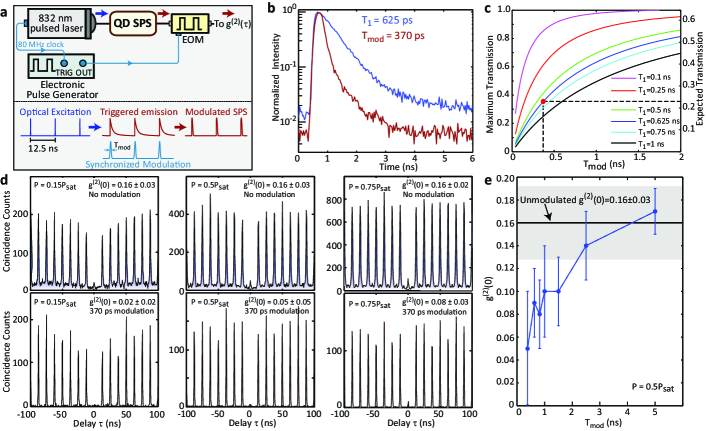
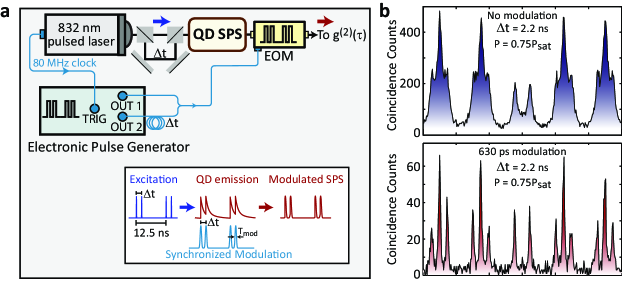
The modified setup is shown in Fig. 2a. The trigger output of the 832 nm excitation laser is used to synchronize an electronic pulse generator whose output drives a fiber-coupled, 980 nm band electro-optic modulator (EOM). Spectrally-filtered QD emission is fed into the EOM, and its output is sent to the HBT setup for photon correlation measurements. The pulse generator produces optical pulses of width ps ref , measured as the full-width at the 1/e point. The separation between the EOM gates and the incoming QD emission can be controlled with ps resolution.
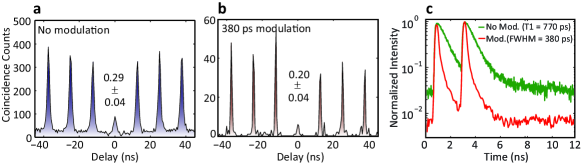
Figure 2b shows the QD lifetime measured with and without amplitude modulation, where the modulation produces = 370 ps ps, and its extinction level is 20 dB. Amplitude modulation is expected to reduce the overall source brightness, both through its temporal gating function and broadband insertion loss. The transmission through the temporal gate can be estimated by considering the overlap of the EOM response and the QD emission ref . Assuming that the EOM gate position is optimal and that the QD emission follows a decaying exponential, Fig. 2c shows the expected transmission level through the EOM for varying values of the radiative lifetime in the case of no insertion loss (left y-axis) and the measured 1.9 dB insertion loss (right y-axis). For the measured ps and = 370 ps, the maximum and expected transmission levels are 36 and 23 , respectively.
Amplitude modulated QD emission is then sent to the HBT setup, and is measured as a function of excitation power, as shown in Fig. 2d, with the unmodulated measurements provided for reference. A clear suppression in the values after modulation is observed, with improvements ranging from a factor of eight at a pump power of 0.15 to a factor of two at 0.75. The measured count rates on the Si SPADs after modulation are typically 20 of the value before modulation.
The basic function of the modulator is to select a portion of the QD emission with a user-defined width and center position. Thus, if the desired single photon emission has a different width and/or temporal position with respect to multi-photon processes, the amplitude modulation can discriminate between the two, removing the undesired multi-photon emission. To gain a better understanding of how the timescale for single-photon and multi-photon emission differ in this device, we measure as a function of at an excitation power of 0.5, as shown in Fig. 2e and in the Supplementary Information. The nearly monotonic increase in with increasing modulation width shows that in this device, multi-photon emission is spread over a timescale of a few ns.
The separation in timescales for single- and multi-photon emission most likely depends on specific characteristics of the device in question, including the pumping scheme and properties of the cavity mode and its detuning with respect to the QD exciton state. Recapture processes in the QD that lead to multiple photon emission events from the QD excitonic line within a single excitation pulse Peter et al. (2007); Santori et al. (2004); Aichele et al. (2004) represent one scenario in which such temporal separation may occur. Alternately, recent studies Chauvin et al. (2009); Laucht et al. (2010) have examined the differences in temporal behavior between single exciton and multi-excitonic transitions of the QD, and have observed that the emission processes can be delayed with respect to each other.
The temporal filtering provided by amplitude modulation can also be useful in QD SPSs that operate at higher repetition rates. For a source with pure single photon emission, the maximum repetition rate depends on the radiative dynamics of the QD, including the carrier capture time and QD radiative lifetime . Purcell enhancement to shorten [Ellis et al., 2008] and rapid quenching of the QD emission at a timescale [Bennett et al., 2005] have been used to approach GHz repetition rates. However, processes that lead to multi-photon emission can be a limitation. Considering the aforementioned carrier recapture processes, even if they still allow photons to be emitted one at a time, multiple emission events per excitation cycle will degrade the on-demand functionality of the source. Experimentally, researchers have attributed various features in data to such processes Aichele et al. (2004); Santori et al. (2004). For example, while measurements of QD SPSs under above-band excitation do exhibit a pronounced antibunching dip (because photons are emitted one-by-one), emission events that are asynchronous with the excitation trigger lead to an overall background in at other times. Such behavior is exhibited in our data without amplitude modulation (upper graphs in Fig. 2d), and suggests that a higher repetition rate source would benefit from suppression of events between the peaks. The data taken after amplitude modulation (lower graphs Fig. 2d) clearly shows such suppression, with essentially no photon counts present in the regions between successive peaks.
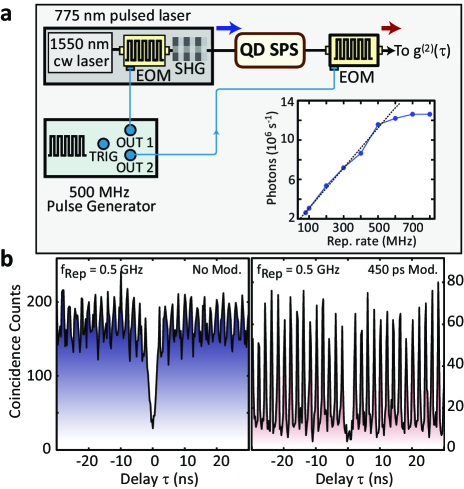
To demonstrate this technique in conjunction with a high repetition rate QD SPS directly, we optically pump the device by an adjustable repetition rate 775 nm source (Fig. 3a) whose trigger output is synchronized to the 980 nm EOM that modulates the generated QD emission. The limit on the useful repetition rate is evident in the bottom right inset of Fig. 3a, which shows how the collected QD emission level scales with repetition rate, in the case of no amplitude modulation. For rates up to 0.5 GHz, the number of collected photons increases nearly linearly, while faster repetition rates are precluded by the dynamics of the QD. Figure 3b shows a measurement of under this 0.5 GHz excitation rate, without modulation (left) and with = 450 ps20 ps (right). The modulated data displays a strong reduction in the overlap between peaks in (see Supplementary Information for additional data). We also find that suppression of in the regions between the peaks does not necessarily require ; the Supplementary Information shows data in which the coincidences between peaks are strongly suppressed even for 1.5 ns =625 ps. In this scenario, amplitude modulation can be a valuable resource in purifying and temporally separating the single photon emission, with an overall transmission level that can be (Fig. 2c). On the other hand, as we describe in the following section, more aggressive amplitude modulation with can be used to improve the indistinguishability of the source.
Improving the indistinguishability of the single photon source
The generation of indistinguishable photons is an important requirement for several applications in quantum information technology, such as linear optics quantum computing Knill et al. (2001), which relies on the two-photon interference effect of single photon pulses at a beamsplitter. When two indistinguishable photons enter a beamsplitter at the same time, they bunch together and leave from the same exit port Hong et al. (1987). This can only be achieved if the photon pulses are Fourier-transform limited, that is, the coherence time () of the interfering photons is limited only by their radiative lifetime (), such that /(2) = 1. quantifies the degree of two-photon wavpacket overlap, and in the limit of a pure SPS (), = 1 implies perfectly indistinguishable photons.
The coherence time of single photons emitted from QDs is limited due to several dephasing processes which reduce their indistinguishability through lower values. Resonant excitation Muller et al. (2007); Vamivakas et al. (2009); Ates et al. (2009) and Purcell enhancement can bring the photons closer to the Fourier-transform limit Santori et al. (2002); Varoutsis et al. (2005), through the reduction of dephasing processes and the radiative lifetime, respectively. Electrically-injected structures in which dephasing was filtered out through fast Stark shifting have also been demonstrated Bennett et al. (2008). As a new approach that is independent of the specific device geometry and excitation wavelength, here we demonstrate that amplitude modulation can improve the indistinguishability of our SPS through two means. The first is through the improved purity of the SPS, as we have detailed in the previous section. The second is through selection of the coherent portion of the single photon wavepackets, which increases from to . Conceptually, this is similar to spectral filtering within the homogeneous linewidth of the QD, which has been predicted to improve photon indistinguishability Santori et al. (2009).
Figure 4a shows the experimental setup used for photon indistinguishability measurements. For each repetition period of the 832 nm excitation laser, we generate a pair of pulses with a delay ns, equal to the delay in the HOM interferometer, thus enabling the interference between the consecutively emitted photons. The same delay is introduced to the output of the electronic pulse generator which drives the EOM. For these measurements, we use the same device as in the previous section, but a shift in the spectral position of the cavity mode with respect to the QD transition resulted in a longer radiative lifetime = ps ps, and higher antibunching value (data in Supplementary Information [ref, ]). Figure 4b shows the result of the HOM measurement on the spectrally filtered QD emission without amplitude modulation. Examining the peak areas results in , less than the value expected for the measured value if there was no two-photon interference ref .
Next, we performed a HOM measurement after amplitude modulation. We measured ps ps, which is approximately half the QD value, and suggests that a factor of two increase in should be expected. We first measured the auto-correlation of the modulated QD emission as ref , again evidencing an improvement in the purity of the SPS. Figure 4c shows the result of the HOM experiment, where the correlation peaks are now well-separated due to the modulation. We estimate , which is smaller than the value expected for this device if there was no two-photon interference. Our measured value yields = 0.65, which corresponds to a coherence time ps ps given ps. In comparison, the unmodulated case has and , which gives an unmodulated value that is consistent with the ratio for 500 ps and 770 ps. Thus, the two-photon wavepacket overlap is increased by a factor of two, as expected based on the change from to produced by amplitude modulation. after modulation approaches the value of 0.8 achieved in previous works Santori et al. (2002); Varoutsis et al. (2005); Weiler et al. (2011) through quasi-resonant excitation and larger Purcell enhancement. Amplitude modulation is fully compatible with such techniques, where shorter values would result in higher transmission for a fixed (Fig. 2c), and longer values would improve the indistinguishability.
Conclusions
In conclusion, we have demonstrated that synchronous amplitude modulation of QD emission can be an effective approach to improving its performance as a SPS. The temporal filtering provided allows us to select the portions of the emission for which the behavior is more ideal. This results in a significant improvement in the single photon purity of the source, by as much as a factor of 8, and enables clean operation of the SPS up to repetition rates as high as 0.5 GHz. Using amplitude modulation to eliminate portions of the single photon wavepackets that are incoherent improves the two-photon wavepacket overlap by a factor of 2. Furthermore, the ability to convert exponentially-shaped single photon wavepackets to Gaussian-shaped ones may improve the robustness of the source in some applications Rohde et al. (2005).
Finally, we emphasize the versatility of amplitude modulation, as it can be applied to either optically (non-resonant or resonant) or electrically pumped devices, independent of device geometry and the precise energy level structure of the QD. It can also be used in conjunction with other methods that improve the performance of SPSs, such as resonant excitation or Purcell enhancement. Other solid-state quantum emitters, such as nitrogen vacancy centers in diamond Kurtsiefer et al. (2000); Babinec et al. (2010) and colloidal quantum dots Sebald et al. (2002) often exhibit non-zero multi-photon probability and imperfect two-photon interference; amplitude modulation may be a valuable resource for those systems as well. Finally, the ability to temporally filter the emitted signal with adjustable width and position provides a new resource to help understand the dynamics within mesoscopic quantum systems like single semiconductor quantum dots.
Acknowledgements S.A. and I.A. acknowledge support under the Cooperative Research Agreement between the University of Maryland and NIST-CNST, Award 70NANB10H193. The authors thank Matthew Rakher for useful discussions and early contributions to this work.
References
- Lounis and Orrit (2005) B. Lounis and M. Orrit, Reports on Progress in Physics 68, 1129 (2005).
- Santori et al. (2010) C. Santori, D. Fattal, and Y. Yamamoto, Single-photon Devices and Applications (Wiley-VCH, Leipzig, 2010).
- Shields (2007) A. J. Shields, Nature Photonics 1, 215 (2007).
- Michler (2009) P. Michler, ed., Single Semiconductor Quantum Dots (Springer Verlag, Berlin, 2009).
- Pelton et al. (2002) M. Pelton, C. Santori, J. Vuckovic, B. Zhang, G. S. Solomon, J. Plant, and Y. Yamamoto, Phys. Rev. Lett. 89, 233602 (2002).
- Solomon et al. (2001) G. Solomon, M. Pelton, and Y. Yamamoto, Phys. Rev. Lett. 86, 3903 (2001).
- Strauf et al. (2007) S. Strauf, N. G. Stoltz, M. T. Rakher, L. A. Coldren, P. M. Petroff, and D. Bouwmeester, Nature Photonics 1, 704 (2007).
- Claudon et al. (2010) J. Claudon, J. Bleuse, N. S. Malik, M. Bazin, P. Jaffrennou, N. Gregersen, C. Sauvan, P. Lalanne, and J. Gérard, Nature Photonics 4, 174 (2010).
- Davanço et al. (2011a) M. Davanço, M. T. Rakher, D. Schuh, A. Badolato, and K. Srinivasan, Appl. Phys. Lett. 99, 041102 (2011a).
- Santori et al. (2004) C. Santori, D. Fattal, J. Vuckovic, G. S. Solomon, and Y. Yamamoto, New J. Phys. 6, 89 (2004).
- Santori et al. (2002) C. Santori, D. Fattal, J. Vuckovic, G. Solomon, and Y. Yamamoto, Nature 419, 594 (2002).
- Ates et al. (2009) S. Ates, S. M. Ulrich, S. Reitzenstein, A. Löffler, A. Forchel, and P. Michler, Phys. Rev. Lett. 103, 167402 (2009).
- Weiler et al. (2011) S. Weiler, A. Ulhaq, S. M. Ulrich, S. Reitzenstein, A. Löffler, A. Forchel, and P. Michler, Physica Status Solidi B Basic Research 248, 867 (2011).
- Gérard and Gayral (1999) J.-M. Gérard and B. Gayral, J. Lightwave Tech. 17, 2089 (1999).
- Varoutsis et al. (2005) S. Varoutsis, S. Laurent, P. Kramper, A. Lemaître, I. Sagnes, I. Robert-Philip, and I. Abram, Phys. Rev. B 72, 041303 (2005).
- Kolchin et al. (2008) P. Kolchin, C. Belthangady, S. Du, G. Y. Yin, and S. E. Harris, Phys. Rev. Lett. 101, 103601 (2008).
- Specht et al. (2009) H. P. Specht, J. Bochmann, M. Mücke, B. Weber, E. Figueroa, D. L. Moehring, and G. Rempe, Nature Photonics 3, 469 (2009).
- Rakher and Srinivasan (2011) M. T. Rakher and K. Srinivasan, Appl. Phys. Lett. 98, 211103 (2011).
- (19) See Supplementary Information for details regarding fabrication, experimental setups, measurements, and data analysis.
- Srinivasan et al. (2006) K. Srinivasan, M. Borselli, O. Painter, A. Stintz, and S. Krishna, Opt. Express 14, 1094 (2006).
- Davanço et al. (2011b) M. Davanço, M. T. Rakher, W. Wegscheider, D. Schuh, A. Badolato, and K. Srinivasan, Appl. Phys. Lett. 99, 121101 (2011b).
- Hong et al. (1987) C. K. Hong, Z. Y. Ou, and L. Mandel, Phys. Rev. Lett. 59, 2044 (1987).
- Winger et al. (2009) M. Winger, T. Volz, G. Tarel, S. Portolan, A. Badolato, K. Hennessy, E. L. Hu, A. Beveratos, J. Finley, V. Savona, and A. Imamoglu, Phys. Rev. Lett. 103, 207403 (2009).
- Chauvin et al. (2009) N. Chauvin, C. Zinoni, M. Francardi, A. Gerardino, L. Balet, B. Alloing, L. H. Li, and A. Fiore, Phys. Rev. B 80, 241306 (2009).
- Laucht et al. (2010) A. Laucht, M. Kaniber, A. Mohtashami, N. Hauke, M. Michler, and J. Finley, Phys. Rev. B 81, 241302 (2010).
- Peter et al. (2007) E. Peter, S. Laurent, J. Bloch, J. Hours, S. Varoutsis, I. Robert-Philip, A. Beveratos, A. Lemaître, A. Cavanna, G. Patriarche, P. Senellart, and D. Martrou, Appl. Phys. Lett. 90, 223118 (2007).
- Aichele et al. (2004) T. Aichele, V. Zwiller, and O. Benson, New J. Phys. 6, 90 (2004).
- Ellis et al. (2008) D. J. P. Ellis, A. J. Bennett, S. J. Dewhurst, C. A. Nicoll, D. A. Ritchie, and A. J. Shields, New J. Phys. 10, 043035 (2008).
- Bennett et al. (2005) A. J. Bennett, D. C. Unitt, P. See, A. J. Shields, P. Atkinson, K. Cooper, and D. A. Ritchie, Phys. Rev. B 72, 033316 (2005).
- Knill et al. (2001) E. Knill, R. Laflamme, and G. J. Milburn, Nature 409, 46 (2001).
- Muller et al. (2007) A. Muller, E. Flagg, P. Bianucci, X. Wang, D. Deppe, W. Ma, J. Zhang, G. Salamo, M. Xiao, and C. Shih, Phys. Rev. Lett. 99, 187402 (2007).
- Vamivakas et al. (2009) A. N. Vamivakas, Y. Zhao, C.-Y. Lu, and M. Atatüre, Nature Physics 5, 198 (2009).
- Bennett et al. (2008) A. J. Bennett, R. B. Patel, A. J. Shields, K. Cooper, P. Atkinson, C. A. Nicoll, and D. A. Ritchie, Appl. Phys. Lett. 92, 193503 (2008).
- Santori et al. (2009) C. Santori, D. Fattal, K.-M. C. Fu, P. E. Barclay, and R. G. Beausoleil, New J. Phys. 11, 123009 (2009).
- Rohde et al. (2005) P. P. Rohde, T. C. Ralph, and M. A. Nielsen, Phys. Rev. A 72, 052332 (2005).
- Kurtsiefer et al. (2000) C. Kurtsiefer, S. Mayer, P. Zarda, and H. Weinfurter, Phys. Rev. Lett. 85, 290 (2000).
- Babinec et al. (2010) T. M. Babinec, B. J. M. Hausmann, M. Khan, Y. Zhang, J. R. Maze, P. R. Hemmer, and M. Lončar, Nature Nanotechnology 5, 195 (2010).
- Sebald et al. (2002) K. Sebald, P. Michler, T. Passow, D. Hommel, G. Bacher, and A. Forchel, Appl. Phys. Lett. 81, 2920 (2002).
- Gulinatti et al. (2012) A. Gulinatti, I. Rech, F. Panzeri, C. Cammi, P. Maccagnani, M. Ghioni, and S. Cova, J. Mod. Opt. 59, 1 (2012).
- Barclay et al. (2005) P. E. Barclay, K. Srinivasan, and O. Painter, Opt. Express 13, 801 (2005).
I Supplementary Information
II Experimental Details
II.1 Device Fabrication
Devices are fabricated in a wafer grown by molecular beam epitaxy and consisting of a single layer of InAs QDs embedded in a 190 nm thick layer of GaAs, which in turn is grown on top of a 1 m thick layer of AlxGa1-xAs with an average = 0.65. The s-shell peak of the QD ensemble is located at 965 nm, and a gradient in the QD density is grown along one axis of the wafer. Low-temperature photoluminescence measurements of the wafer are performed prior to device definition to determine the appropriate location on the wafer (in terms of QD density) to fabricate devices.
Microdisk cavities of varying diameter between 2 m and 4 m are fabricated through: (i) electron beam lithography, (ii) resist reflow, (iii) Ar-Cl2 inductively-coupled plasma reactive ion etching of the GaAs layer and removal of the electron beam resist, and (iv) (NH4)2S and HF wet etching of the underlying AlxGa1-xAs layer to form the supporting pedestal.
II.2 Si single-photon avalanche diode (SPADs)
Two different types of Si single-photon avalanche diodes (SPADs) are used in the experiments, depending on the requirements on detection efficiency and timing resolution. Thick Si SPADs used in this work have a detection efficiency of 12.5 at 980 nm and a timing jitter 700 ps, and are used in experiments in which faster timing resolution are not needed. This includes the data for Figures 1e, 2d, 4b, and 4c in the main text.
Newly-developed red-enhanced thin Si SPADs Gulinatti et al. (2012) have a detection efficiency of 6 at 980 nm, and a timing jitter of 100 ps. They are used in experiments for which faster timing resolution is needed, including Figs. 1c, 2b, and Fig. 3 in the main text, and Fig. 8 and 9 in the Supplementary Material. The outputs of the Si SPADs are fed to a time-correlated single photon counting (TCSPC) board for all photon correlation measurements.
II.3 Spectral filtering setup
QD emission that is out-coupled into the FTW is sent into a 0.2 nm bandwidth volume reflective Bragg grating whose input is coupled to single mode optical fiber and output is coupled to polarization maintaining (PM) single mode fiber. Quarter- and half-wave plates and a polarizing beamsplitter are placed prior to the PM fiber, to ensure that light is linearly polarized along the slow-axis of the fiber. The typical throughput of the filtering setup is 50.
II.4 Electro-optic modulator setup
A 980 nm band, fiber-coupled LiNbO3 electro-optic modulator (EOM) is used for all amplitude modulation experiments. Both the modulator input and output are PM fibers, with the polarization aligned along the slow-axis of the fiber. The modulator is driven by a dual-channel electronic pulse generator that can be internally or externally triggered and can produce pulses as short as 250 ps. For the experiments in Fig. 2 and Fig. 3b in the main text, one channel of the pulse generator is used to generate a periodic train of pulses which drive the EOM. For the experiments in Fig. 4c and Fig. 8b, a pair of pulses per repetition period are generated by combining both output channels of the generator, with an electronically adjustable delay between them. The pulse generator output (either single channel or combined double channel) is fed to a GHz amplifier to generate the required voltage needed to achieve maximum transmission through the EOM. A separate DC power supply is used to control the bias voltage on the EOM in all experiments.
While the electronic pulse generator produces output pulses as short as 250 ps, addition with the second output channel (for double pulse experiments), amplification, and application to the optical signal results in optical pulses that are typically broader. The narrowest pulse widths achieved, as measured on the TCSPC, are 350 ps.
II.5 Lifetime measurements
Measurements of the QD lifetime are performed by sending the trigger output of the 832 nm excitation laser to the start input of the TCSPC, and filtered QD emission to a fast Si SPAD whose output is sent to the stop input of the TCSPC. The bin size of the TCSPC is typically set to 32 ps, near the timing jitter of the SPAD and well below the lifetimes measured in this work.
II.6 HBT and HOM setups
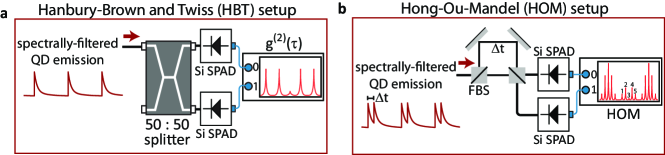
The second-order correlation function is measured by using a Hanbury-Brown and Twiss setup, which consists of a 1x2 fiber splitter and two Si SPADs, as shown in Fig. 5a. The spectrally filtered QD emission is connected to the input port of the splitter and the outputs of the splitter are connected to the SPADs. The output of the SPADs is fed to the TCSPC module. For Figs. 1 and 2 in the main text, and Fig. 7 in the Supplementary Material, thick Si SPADs are used and data from the TCSPC is acquired in histogram mode with a bin size of 512 ps. For experiments in Fig. 3 in the main text and Fig. 8 and 9 in the Supplementary Material, red-enhanced thin Si SPADs are used, and data is acquired in a time-tagged, time-resolved mode in which the photon arrival times from each channel are recorded with 4 ps timing resolution and the bin size set during subsequent data analysis. A bin size of 256 ps was set for Fig. 3, while a bin size of 200 ps was set for Fig. 8.
Indistinguishability of single photon pulses is measured by using a PM fiber-based Hong-Ou-Mandel (HOM) type interferometer (See Fig. 5b). The experiments rely on two-photon interference between consecutively emitted single photons Santori et al. (2002). For this purpose, each excitation pulse (with a 80 MHz repetition rate) is split to create two pulses with a delay t = 2.2 ns, which then generate a pair of single photon pulses from the QD transition. As described above, the spectral filtering setup leaves the emission linearly polarized, after which it is coupled to the HOM setup, which uses two fiber optic non-polarizing beamsplitters (FBS) with a fixed delay t = 2.2 ns between the interferometer arms. Two-photon interference occur at the second FBS, the output ports of which are connected to thick Si SPADs for detection of photon coincidences. The outputs of the two SPADs are sent to the TCSPC, which is operated in histogram mode with a bin size of 512 ps.
Figure 5b shows a typical correlation histogram, which has five-peak clusters with a spacing defined by the repetition rate of the excitation laser (12.5 ns). The five peaks within each cluster are separated by 2.2 ns, given by the delay introduced between the interferometer arms. The two-photon interference effect is reflected in the central cluster, where the peaks named from 1 to 5 are formed due to different combinations of paths taken by the interfering photons.The outer side peaks 1 and 5 correspond to the case where the first photon follows the short arm and the second photon follows the long arm, while the inner side peaks 2 and 4 arise if both photons follow the same arm of the interferometer. Finally, peak 3 at = 0 corresponds to the case where the first photon follows the long arm and the second photon follows the short arm, which leads to the overlap and interference of consecutively emitted photons at the second BS.
III Expected transmission through the Electro-Optic Modulator
We quantitatively describe the fraction of photons transmitted by the EOM using the approach in Ref. Rakher and Srinivasan, 2011. We assume that the modulation has a Gaussian temporal profile given by
| (1) |
where = is the full-width of the modulation pulse at its 1/e point. We further take the probability distribution of photons emitted by the QD to be given by
| (2) |
where is the Heaviside step function. The fraction of transmitted photons is then
| (3) |
where is the delay of the modulation gate with respect to the incident QD photon. Maximizing with respect to gives a plot of the transmission as a function of for a given value of , as shown in Fig. 2c in the main text. The right y-axis in that plot shows the expected transmission if an additional 1.9 dB of insertion loss (the measured value for the modulator used in our experiments) is included.
IV Supplementary Measurements and Data Analysis
IV.1 SPS Brightness Estimate
The QD SPS efficiency is estimated by comparing the number of photons coupled to the FTW at to the expected number of generated photons. The total detection efficiency of the optical setup includes the transmission through the FTW (50 %) and spectral filtering setup (50 %) and the quantum efficiency of the SPADs (12.5 %), measured using a laser of known power at the QD emission wavelength. Assuming the QD generates one photon per excitation pulse, the efficiency of the QD SPS is given by , where is the detected count rate on the SPAD and is the 80 MHz repetition rate of the excitation laser. Error bars in the measurements come from the fluctuation in the detected count rates, and are one standard deviation values.
IV.2 Cavity transmission measurement
Measurement of the cavity transmission spectrum is done sweeping the wavelength of a 980 nm band external cavity tunable diode laser that is connected to the FTW input and measuring the transmitted intensity on an InGaAs photoreceiver that is connected to the FTW output.
The transmitted signal on resonance can be written as Barclay et al. (2005)
| (4) |
where is a coupling parameter given by the ratio of the FTW-cavity mode coupling rate to all other losses (parasitic and intrinsic) in the system. The fraction of cavity mode photons that are out-coupled into the FTW is then given by:
| (5) |
Ideal microdisk cavities support degenerate clockwise and counterclockwise whispering gallery modes (WGMs). While this degeneracy can be broken in the limit of strong backscattering, in this work the backscattering rate is much smaller than the intrinsic loss rate, as evidenced by the single dip present in the transmission spectrum. The QD, however, will emit into both WGMs, with the clockwise WGM coupling to the forward channel of the FTW, and the counterclockwise WGM coupling to the backward channel of the FTW. Based on the transmission spectrum in Fig. 1c of the main text, , resulting in 25 for each channel of the FTW.
IV.3 Micro-photoluminescence measurements
Figure 6 shows micro-photoluminescence data from the microdisk-QD device studied in the main text under a variety of conditions. Spectra taken before and after spectral filtering, and under saturation conditions with 832 nm pulsed pumping, are shown in Fig. 6a-b. The QD sits on a broad cavity mode which provides both Purcell enhancement of the QD radiative rate and efficient out-coupling into the FTW. The location of the cavity mode can be seen under strong excitation conditions, well beyond the QD saturation power (Fig. 6c); transmission measurements as discussed above and provided in Fig. 1c in the main text are also used. Finally, adjustment of the cavity mode spectral position can enable multiple QD excitonic lines to be collected with high efficiency, as seen in Fig. 6d.
IV.4 Lifetime measurements
Lifetime data is fit to an exponential and the quoted uncertainties are the one-standard deviation values. Modulated lifetimes are measured in the same way, where now the QD emission has first gone through the EOM before being detected by the SPAD. Quoted modulation widths are given by the full-width at the 1/e points of the data.
IV.5 measurements
Measurement of the second-order correlation function are performed using the setups described above. In pulsed measurements, the value is determined by comparing the integrated area of the peak around time zero to the average area of the peaks away from time zero. The uncertainty on this value is given by the standard deviation in the area of the peaks away from time zero.
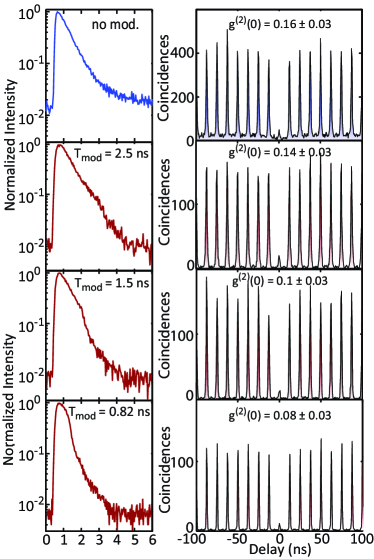
IV.6 Modulation-width dependent measurements
Adjusting the modulation width is expected to influence qualities like the QD SPS purity and indistinguishability. Here, we provide the individual measurements used to produced Fig. 2e, which plotted as a function of . Figure 7a shows a few measured lifetimes and curves for between 820 ps and 2500 ps, with the unmodulated case from the main text repeated for reference. In comparison to the extracted values, the full curves present additional information, indicating, for example, the values of for which the overlap between adjacent peaks is suppressed. Here, we see the possible benefits of intermediate modulation widths; at = 820 ps, the overlap is almost completely suppressed, is reduced by a factor of almost 2, and the transmission through the setup (including insertion loss) is 37 , nearly a factor of two higher than in the 370 ps modulation width case.
IV.7 Temporal overlap and high repetition rate sources
Figure 3 in the main text shows for the microdisk-QD device under 0.5 GHz excitation rate, with and without synchronous amplitude modulation of the QD emission. While modulation clearly improves the temporal separation between the peaks, the degree to which this is improved is somewhat less than that observed under 80 MHz pumping in Fig. 2 in the main text, and Fig. 7 above. We believe that this is primarily due to the characteristics of the source exciting the QD. Because the excitation source was produced by modulating and frequency doubling a cw 1550 nm laser, both the excitation wavelength (775 nm) and the pulse width ( ps) differ from the mode-locked laser source used in the rest of the work (wavelength of 832 nm and pulse width ps). The significantly increased pulse width, in particular, begins to approach the radiative lifetime of the QD and may lead to much stronger carrier recapture and multi-photon emission processes.
To gain an understanding of how the system might respond under a high repetition rate but with a short excitation pulse width, we use the setup shown in Fig. 8a, where a pair of beamsplitters and mirrors have been placed in the 832 nm excitation path to generate two pump pulses for every excitation period, with a delay between the pulses that is adjustable. The output of the QD SPS is hooked up to an EOM that is driven by a pulse generator that creates a pair of pulses with adjustable modulation width and a delay between the pulses that matches the excitation delay .
The top panel of Fig. 8b shows a measurement of for = 2.2 ns, without amplitude modulation. Ideally, one would expect a series of three-peak clusters separated by the repetition period (12.5 ns), where the peaks within the cluster are separated by , and the central peak at = 0 vanishes for a pure single photon source. We qualitatively observe these features, but there is a strong overlap of the peaks, suggesting that a further reduction in would not be feasible. In comparison, modulation with = 630 ps ps results in the bottom panel of Fig. 8b, where the overlap has been significantly diminished, nearing the levels seen in the 80 MHz repetition rate measurements. This suggests that the 0.5 GHz repetition rate measurements of Fig. 3b in the main text would show additional improvement in the background coincidence levels between the peaks under appropriate short-pulse excitation.
IV.8 Photon indistinguishability measurements
Indistinguishability of single photon pulses is measured by using the two-photon interference effect on a beamsplitter. The degree of indistinguishability is mainly given by the mean overlap of the wavepackets of the interfering photons. Perfect overlap will only occur if the interfering photons are Fourier-transform limited, which requires that the coherence time of the photons is mainly limited by the radiative lifetime ( = 2). The degree of indistinguishability is therefore quantified by the two-photon overlap and given by Santori et al. (2002):
rCl V = T22T1 = γγ+ α
where, is the spontaneous emission amplitude decay rate () and is the pure dephasing rate (, is the pure dephasing time), which is linked to the coherence time via:
rCl 1T2 = 12T1 + 1T⋆2
Experimentally, the degree of indistinguishability is quantified from the mean areas of the correlation peaks named from 1 to 5 in Fig. 5b, which are calculated as Santori et al. (2002):
rCl
A_1 & = Nη^(2)R^3T
A_2 = Nη^(2)[R^3T(1+2g^⋆)+RT^3]
A_3 = Nη^(2)[(R^3T+RT^3)(1+2g^⋆)-2(1-ϵ)^2R^2T^2V(Δt)]
A_4 = Nη^(2)[R^3T+RT^3(1+2g^⋆)]
A_5 = Nη^(2)R^3T
where is the number of repetitions, is the combined two-photon generation and detection efficiency, and are the reflection and transmission coefficients of the beamsplitters, (1-) is the visibility of the interference setup, is the two-photon emission probability, and is the mean two-photon overlap. The effect of two-photon interference is reflected as a reduced area of peak 3 and it is quantified by using the areas of Peaks 2, 3 , and 4:
rCl M = A3A2+A4 = (1+2g⋆)2(1+g⋆)-(1-ϵ)2R2T2V(1+g⋆)(R3T+RT3)
The parameter defines the probability of two photons merging in the beamsplitter and leaving in opposite directions. Theoretically, the value of will be between 0 and 0.5, depending on the value two-photon overlap, in the case of perfect visibility of the interferometer setup ((1-) = 1), a perfect 50/50 splitting ratio of the splitters (), and .
Now, we discuss the details of the experimental results using the expressions given above. We assume (1-) = 1 and for all data. Figure 9a shows the result of photon correlation measurement performed on the QD emission before amplitude modulation under the same conditions as the HOM measurement shown in the main text (See Fig. 4b). We measure , which places an upper limit (based on Eqn. IV.8) for in the case of no interference (). Here we use since we didn’t observe any long time blinking behavior Santori et al. (2002). By using the ratio of the areas from the experimental HOM data, we estimate the value of , indicating a two-photon overlap as a result of a partial indistinguishability. This number is consistent with that expected from the ratio , with = 500 ps and = 770 ps (Fig. 9c).
Similar measurements were performed after amplitude modulation, where ps is measured (Fig. 9c) to be approximately half of the emission lifetime ps. Figure 9b shows the result of a photon correlation measurement performed on the QD emission under the same conditions as the HOM measurement shown in the main text (See Fig. 4c). An antibunching value is measured, which places a values in the limit of no two-photon interference (). We estimated the value from the experimental HOM data as , which corresponds to a two-photon overlap . This value is almost a factor two higher than the one obtained before amplitude modulation, as expected since .
HOM measurements performed in Fig. 1e yielded for , smaller than the value predicted in the case of no two-photon interference (), . The corresponding two-photon overlap determined from Eqn. IV.8 matches well with the prediction , with = 500 ps and = 625 ps.