Combined analysis of production reactions: , , and
Abstract
The production of mesons in photon- and hadron-induced reactions has been revisited in view of the recent additions of high-precision data to the world data base. Based on an effective Lagrangian approach, we have performed a combined analysis of the free and quasi-free , , and reactions. Considering spin-1/2 and -3/2 resonances, we found that a set of above-threshold resonances , , , with fitted mass values of about , , and MeV, respectively, and the four-star sub-threshold resonance reproduce best all existing data for the production processes in the resonance-energy region considered in this work. All three above-threshold resonances found in the present analysis are essential and indispensable for the good quality of the present fits.
pacs:
25.20.Lj, 13.60.Le, 13.75.-n, 14.20.GkI Introduction
A wealth of interesting physics can be obtained from studying the production processes involving the meson NH04 , one of the primary interests being here that such production processes may help one extract information on nucleon resonances that cannot be obtained from pion reactions. In fact, current knowledge of most of the nucleon resonances is mainly due to the study of scattering and/or pion photoproduction off the nucleon. Since the meson is much heavier than the pion, meson-production processes near threshold, therefore, are well suited for investigating high-mass resonances in low partial-wave states. Furthermore, reaction processes such as photoproduction provide opportunities to study, in particular, those resonances that couple only weakly to pions. This may help in providing a better understanding of the so-called “missing resonances” predicted by quark models Capstick1 , but not found in more traditional pion-production reactions.
In view of the relatively low production rate, until recently there existed only a very limited number of experimental studies of production reactions. This limited experimental information was reflected in the relatively low number of theoretical investigations of such reactions. For an account of the pre-2004 situation, see Ref. NH04 . However, the situation has changed in the past few years, especially in photoproduction, where high-precision data for both nucleon and deuteron targets have become available CLAS06 ; CLAS09 ; CBELSA09 ; CBELSA11 . Also, the and invariant-mass distribution data in the reaction are now available COSY11-10a , in addition to the cross-section data ppetapdata ; Balestra ; Khoukaz . Upper limits for the total cross sections in have also been reported COSY11-10b . Given the present situation, with much higher-quality data than were available in the past, we revisit here the production of and we perform a combined analysis of the reaction channels , , and . In our previous study of photoproduction on the proton NH04 ; NH06 , we found that cross-section data alone cannot unambiguously constrain the set of minimal spin-1/2 and -3/2 resonances necessary in principle for an adequate reproduction of the data, and we pointed to the necessity of incorporating spin observables (in particular, the beam asymmetry) to constrain our model much more stringently than what can be achieved by utilizing the cross section alone. To date, although there are ongoing efforts to measure the beam asymmetry Collins09 and the beam-target asymmetry Afzal12 , experimental data for spin observables are not available yet for production reactions. However, as we shall show in this work, the simultaneous consideration of the high-precision cross-section data in free CLAS09 that have only become available recently, together with the cross section data on quasi-free CBELSA11 and the invariant mass distribution data in COSY11-10a , impose sufficient constraints to remove the ambiguity among various sets of possible spin-1/2 and -3/2 resonances.
To analyze the new photoproduction data CLAS09 ; CBELSA09 ; CBELSA11 , we use here the same approach as employed in Ref. NH06 for the analysis of the earlier CLAS data CLAS06 . In particular, we include spin-1/2 and -3/2 resonances with parameters determined from best fits to the data. We restrict ourselves to these low-spin resonances because the existing cross-section data alone cannot constrain the resonance parameters unambiguously once higher-spin resonances are added into the model. For this, one must have spin-observable data. Since the present approach is phenomenological, our strategy is to consider the minimum number of resonances that allows us to reproduce the available data with acceptable fit accuracy. This is quite different in spirit from a recent analysis of the new data CLAS09 ; CBELSA09 ; CBELSA11 by Zhong and Zhao ZZ11 who work within a quark-model approach and consider all possible nucleon resonances up to the harmonic-oscillator shell. For the quasi-free photoproduction processes CBELSA11 , we account for the Fermi motion of the nucleon by folding the cross section of the free process with the momentum distribution of the nucleon inside the deuteron. The analysis of the reaction is done following Ref. NH04 within a distorted-wave Born approximation (DWBA) in which both the initial- and final-state interaction is taken into account explicitly.
This paper is organized as follows: In Sec. II, we describe our overall strategy for performing our combined analysis of the photon- and hadron-induced reactions and we also provide some general remarks concerning the resonances required to reproduce the available data. In Sec. III, the present results for the free reaction are discussed in conjunction with the most recent high-precision CLAS CLAS09 and CBELSA/TAPS CBELSA09 data. In Sec. IV, the analysis of the quasi-free and reactions is presented. Section V contains the present results for the reaction and in Sec. VI we present the results for the pion-induced production . Our summarizing assessment is given in Sec. VII. In Appendix A, our model for photoproduction as well as for the hadron-induced reactions and are described briefly for completeness. Some details of how the Fermi motion of the nucleon inside the deuteron is taken into account in the present work for describing the quasi-free photoproduction processes are also given in Appendix A. Appendix B contains the Lagrangians, form factors, and propagators that define the individual amplitudes in our model.
II General Procedure and Findings
In the following sections, we present separate discussions of our results for photon- and for hadron-induced reactions because this allows us to keep the discussions focused on the reactions at hand. We emphasize, however, that the results are based on simultaneous fits to the available data for the reaction processes considered.
The model assumptions used in describing these reactions consistently with each other are given in Appendix A. In addition to resonance-current contributions, we consider the nucleonic and meson-exchange ( and ) currents. For resonances, in particular, the strategy adopted here is to introduce as few resonances as possible, with parameters adjusted to simultaneously reproduce the data for the , , and reactions via a least-square minimization procedure. In the present work, we restrict ourselves to spin-1/2 and -3/2 resonances.
The simultaneous treatment of the available reaction data provides insights that cannot be obtained by fitting each reaction and/or each data set individually. For example, considering only the free photoproduction data from the CBELSA/TAPS experiments CBELSA09 , we can obtain good fits (with ) with only one resonance. By contrast, a similarly good fit to the corresponding high-precision CLAS data CLAS09 requires at least three resonances. Considering two above-threshold resonances instead, one obtains at best. Moreover, we find that any one of the above-threshold three-resonance sets , , and can reproduce the data equally well. The remaining combination is ruled out by the data according to our good-fit criterion thus indicating the need for the resonance for reproducing the data. These findings indicate that in the cross-section data alone cannot constrain the set of resonances, even with high-precision data. By contrast, the three acceptable sets of resonances given above yield quite distinct results for the spin observables, in particular, for the beam asymmetry. These findings corroborate the conclusions of our earlier work NH06 .
The ambiguity just discussed with respect to the three resonance sets found acceptable in the free photoproduction process is completely removed once we include other reactions in our analysis. The set is ruled out by the quasi-free reaction and the set by the reaction. The only remaining acceptable set, therefore, is . In addition, we find that to obtain a good description of , in particular, we need an additional below-threshold resonance whose inclusion has no bearing on the quality of any of the results for other reactions considered in this work. In summary, therefore, a good overall description of all reaction processes considered in this work is obtained with a (minimum) set of three above-threshold resonances, , with the masses of about , 2130, and 2050 MeV, respectively, and one below-threshold resonance. The latter is the four-star quoted in PDG PDG . The masses of these above-threshold resonances are very well constrained by the existing data, in particular, by the CLAS photoproduction data CLAS09 . The CLAS data also constrain reasonably the total widths of these resonances, although to a lesser extent. Hereafter, we shall use the notation to identify these above-threshold resonances, even though the fitted mass values for the various scenarios discussed below (see Table 1) may differ slightly from these values. The resonances found in our analysis may be tentatively identified with the corresponding **, *, and * resonances listed in PDG PDG . We will discuss the constraints imposed by the individual reactions in more detail in subsequent sections.
III Free
In this section, we present our results for the free reaction. First, we address the issue of possible discrepancies in the data sets from the CLAS CLAS09 and the CBELSA/TAPS CBELSA09 collaborations. Then, we discuss the present analysis of these data.
III.1 Comparison of the CLAS and CBELSA/TAPS data
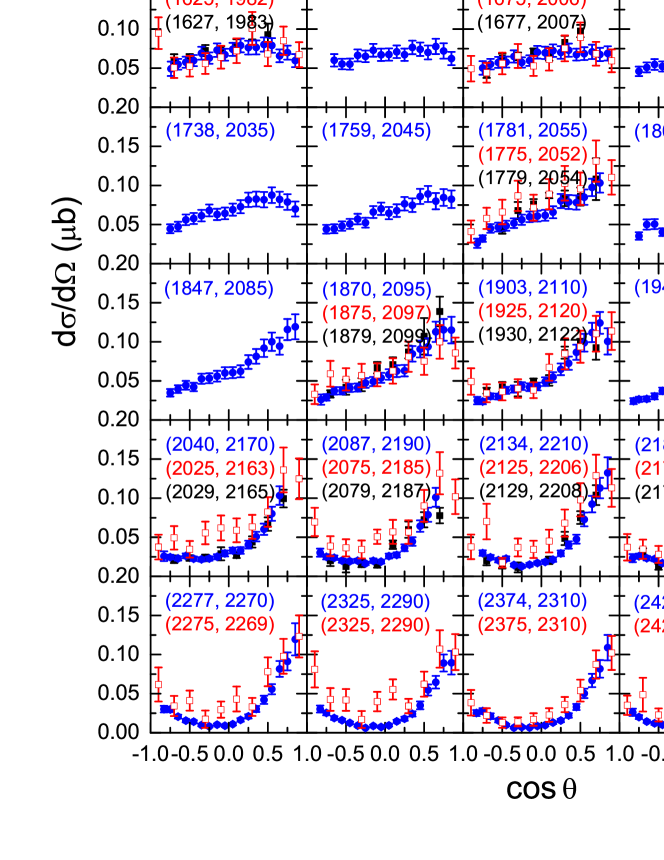
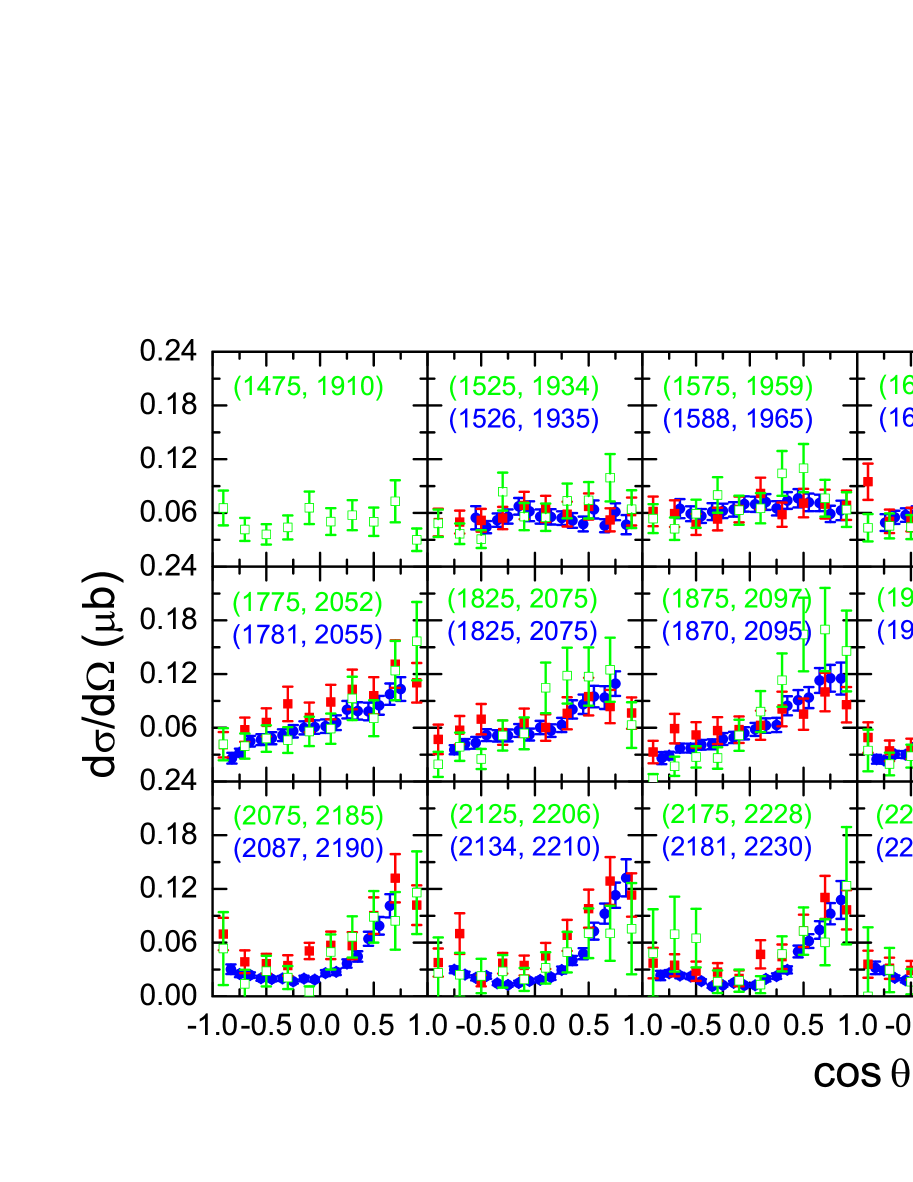
The most recent CLAS data CLAS09 and the CBELSA/TAPS data CBELSA09 are compared in Fig. 1. As one can see, in general the new CLAS and the CBELSA/TAPS data are consistent for invariant energies below GeV within their uncertainties. For higher energies, however, one sees considerable discrepancies, by factors as large as 3, between these two sets of data for emission angles away from the forward angles. We note that in addition to the statistical errors, the plots of Fig. 1 include the estimated systematic errors as quoted in Refs. CLAS09 ; CBELSA09 . These systematic errors were not included in the data plots given in these references. The error bars in Fig. 1 were obtained by adding the systematic errors to the corresponding statistical errors in quadrature. For the present purpose of revealing the inconsistencies between these two data sets, this procedure may be justified, even though one might need a more thorough error analysis for a fully quantitative estimate of the total uncertainty in the data. We mention that for photoproduction, an even more pronounced discrepancy between the CLAS and CBELSA/TAPS data was pointed out in Refs. CLAS09 ; CBELSA09 , however, with no clear identification of the source of the discrepancy (in this respect, see also Ref. SHKM10 ). For comparison, we show in Fig. 1 also the earlier CLAS data CLAS06 which are seen to be consistent with the newer CLAS data.
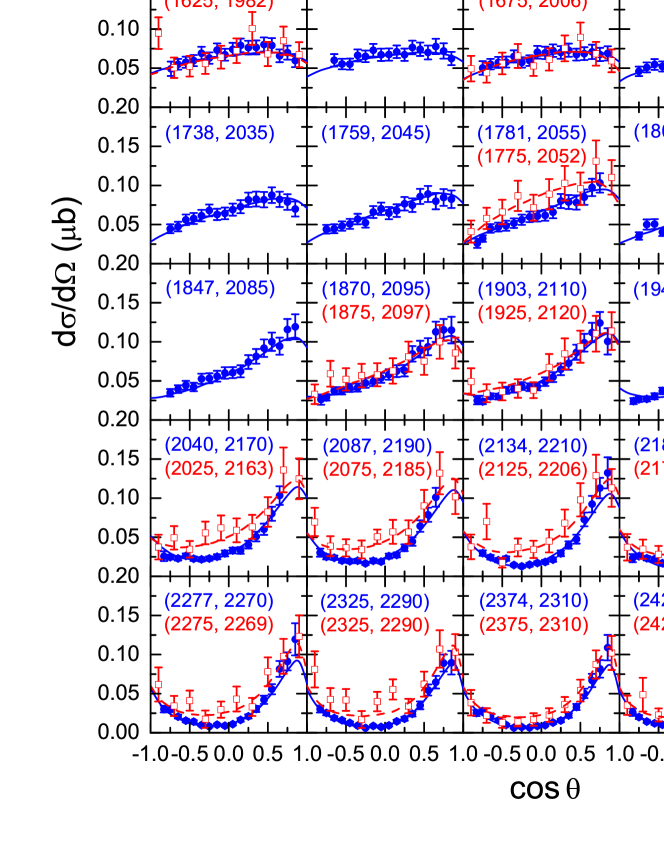
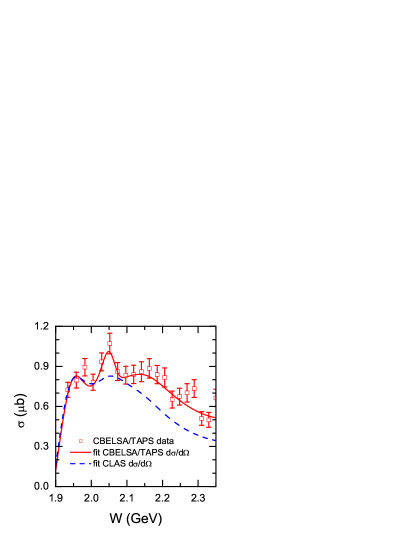
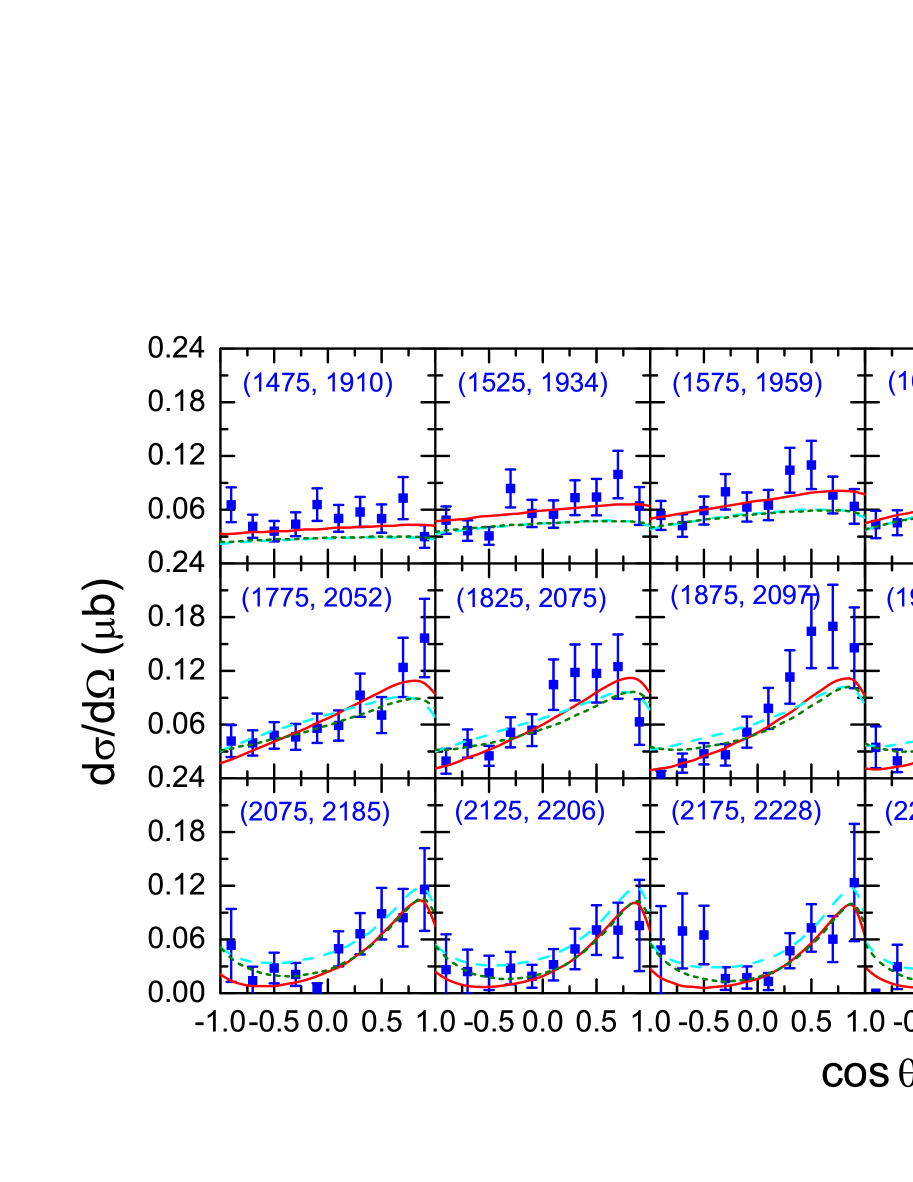
Leaving out the older CLAS data CLAS06 , we show in Fig. 2 the same data as in Fig. 1, however, now with curves that result from our fit procedure to the new CLAS CLAS09 and the CBELSA/TAPS CBELSA11 data. We will discuss these fit results in detail in the subsequent Sec. III.2. Here, we note that if we integrate our fit results for the corresponding angular distributions in Fig. 2, we obtain the total cross sections shown in Fig. 3 which exhibit markedly different behavior for the two data sets. First, these results clearly reveal an energy-dependent relative normalization problem which increases with increasing energy. We checked, of course, how much this finding is influenced by the uncertainties of the fit procedure and we found that other fits to the data of similar quality, even polynomial fits, have no effect on our conclusion regarding the normalization problem. Again, a similar finding was observed for photoproduction data CLAS09 ; CBELSA09 , as was pointed out in Ref. SHKM10 . Second, the CBELSA/TAPS data exhibit a pronounced peak structure around 2.05 GeV, while the total cross-section resulting from the fit to the CLAS data shows only a relatively flat bump at this energy. The origin of this pronounced peak structure can be traced back to the measured cross sections in the CBELSA/TAPS data bin around 2.052 GeV. We will discuss this structure in more detail in the following subsection.
III.2 Analysis of the CLAS and CBELSA/TAPS data
The discrepancy between the CLAS CLAS09 and CBELSA/TAPS CBELSA09 data discussed in the previous subsection makes it difficult to consider both data sets as a single set of data for a combined numerical analysis. Since, at present, we have no clear reason to discard one data set in favor of the other, we are forced, therefore, to consider them separately. In view of their differences, we can expect that the resonance parameters extracted from these data sets may be quite different from each other. One of the purposes of this subsection is to see how different they are.
| free | quasi-free | ||||||||
| CLAS | CBELSA/TAPS | ||||||||
| [MeV] | |||||||||
As mentioned, Fig. 2 shows the independent resulting fit curves for the CLAS CLAS09 and for the CBELSA/TAPS CBELSA09 data. Both data sets are reproduced with very good fit quality of and 0.56, respectively. The corresponding model parameter values are displayed in the two columns subsumed under “free ” in Table 1. The uncertainties in the resulting parameters are estimates arising from the uncertainties (error bars) associated with the fitted experimental data points. In addition to the resonance-mass and total-width values, the table shows the corresponding reduced helicity amplitudes , where denotes the branching ratio to the decay channel and stands for the helicity amplitude with spin . The mass and total width of the (four-star) resonance have been fixed at the respective centroid values quoted in PDG PDG . Also, the fixed radiative decay branching ratio of is well within the range of [0.05-0.25]% quoted in PDG for this resonance. The analysis of production processes in Ref. NOH11 yielded a value of . We recall that this sub-threshold resonance is required in describing the reaction but not in photoproduction. As such, its contribution is negligible here (cf. Fig. 4) and, consequently, its parameters are not well constrained by the present photoproduction data. In particular, the corresponding reduced helicity amplitudes quoted in Table 1 are subject to much larger uncertainties than those indicated there, since the extracted very small branching ratio for this resonance (cf. Table 3) depends more sensitively on the assumed mass distribution (see discussion in Sec. V) than the corresponding values for the above-threshold resonances. The systematic uncertainties arising from such an assumption are not taken into account in the error numbers given in Table 1. Following Refs. NH04 ; NH06 , we also set the radiative decay branching ratios for other resonances to be . Note that in the present tree-level calculation, the results are rather insensitive to the branching ratios, since they enter the model only through the total decay widths in the resonance propagator (see Appendix B.3), in addition to the fact that the results are sensitive only to the product of the coupling constants . In principle, a simultaneous consideration of photon- and relevant hadron-induced reactions would enable us to disentangle the individual factors contributing to this product of coupling constants. However, the relatively poor quality of the currently existing data for one of the relevant reactions, (cf. Fig. 13 discussed in Sec. VI below), does not allow this. We also note that the pseudoscalar-pseudovector mixing parameters (see Appendix B.2) are not well constrained by the data, as the corresponding uncertainties indicate. The fitted mass values () of the corresponding resonances found from the CLAS and from the CBELSA/TAPS data are very close to each other. The same is true for all but one of the total widths of these resonances at the resonance energies . A marked exception is the resonance for which the CBELSA/TAPS data yield a much narrower width (cf. Table 1), however, with an associated uncertainty that is very large. We will discuss this issue in more detail below in connection with the total cross-section results shown in Fig. 4. The parameter values for the resonance are practically the same for both data sets. We emphasize that the CLAS photoproduction data CLAS09 constrain the masses of the above-threshold resonances very well. In contrast, the CBELSA/TAPS data CBELSA09 by themselves cannot constrain these resonance masses because of the overdetermined fit (recall that CBELSA/TAPS data CBELSA09 can be fitted only with one above-threshold resonance).

The differences in the corresponding individual current contributions are better seen in Fig. 4. Comparing the resonance values found in our fits with those quoted in PDG PDG , our , , and may perhaps be identified with the PDG resonances , , and , respectively. As mentioned in Sec. II, the cross section data alone in cannot constrain the set of resonances uniquely. We emphasize, however, that acceptable fits of the cross-section data for this reaction cannot be obtained without the above-threshold resonance.
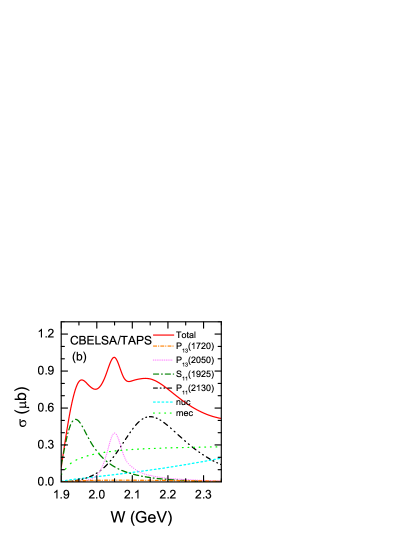
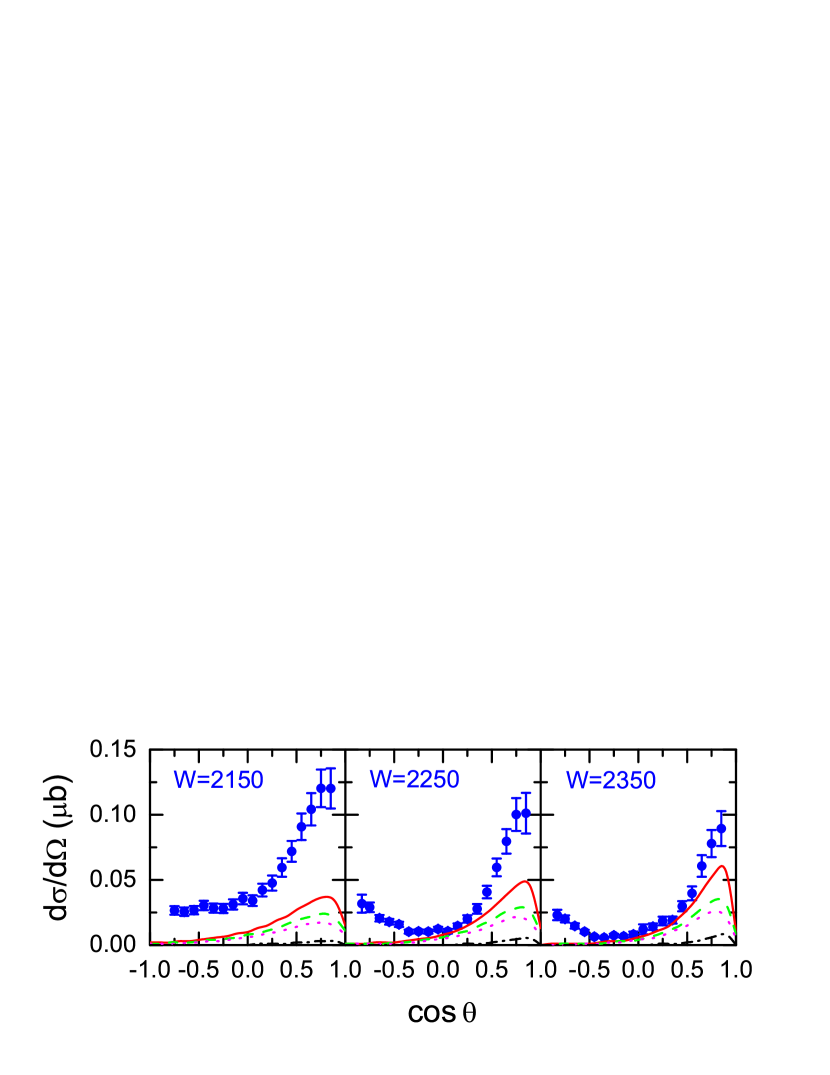
Figure 4 displays the individual resonance contributions to the predicted total cross sections obtained by integrating the differential cross section results shown in Fig. 2 for the CLAS (left panel) and CBELSA/TAPS (right panel) data. Both the nucleonic and mesonic currents yield similar contributions for both data sets, even though they are visibly larger for the CBELSA/TAPS data than for the CLAS data. For resonances, we see significant differences in their relative contributions. The resonance contribution is much stronger for CBELSA/TAPS than for CLAS, which is responsible for making the full total cross section larger for energies above GeV. For both data sets the respective resonance contributions alone are responsible for the sharp rise of the full total cross section (red curves) near threshold, and their corresponding parameter sets are practically identical. By contrast, the sub-threshold resonance contribution is negligible.
The clear peak structure in the full total cross exhibited by the CBELSA/TAPS data is produced here by the above-threshold resonance which is much narrower for the CBELSA/TAPS data than for CLAS. However, the uncertainty associated with its width is very large, as shown in Table 1 and this width, therefore, is not well constrained. We recall here that the total cross-section data were not fitted, so the peak structure found in the calculated results is a consequence of the fit results of the angular distribution data as shown in Fig. 2. The origin of this large uncertainty in the width can be traced back to the CBELSA/TAPS measured differential cross-sections at one particular energy only, namely at GeV, which coincides with the resonance whose position is fixed very well within our fits with very small errors for both data sets. In view of the large error for the width for the CBELSA/TAPS data, there is no physical significance in finding the peak structure shown in Fig. 4. In fact, manually changing the width from 52 to 140 MeV, similar to the width found for the CLAS data, largely smoothes out the peak resulting in an overall only a few percent worse than what is reported in Table 1.
The main conclusion regarding the discrepancy between the CLAS CLAS09 and CBELSA/TAPS CBELSA09 data as exhibited in Fig. 1 is that the larger cross-section yield of the CBELSA/TAPS data at higher energies results in a larger resonance contribution compared to the CLAS data (compare, in particular, the corresponding reduced helicity amplitudes in Table 1). This alone largely leads to the enhancement of the CBELSA/TAPS total cross section over the CLAS results seen in Fig. 3 for energies above GeV. For future analyses, it is important to resolve this discrepancy in the findings of the CLAS and CBELSA/TAPS experiments if one is to obtain more definitive answers about these above-threshold resonances.
Figure 5 illustrates the contributions of the - and -meson exchanges to the total mesonic current. Depending on their relative sign, one obtains constructive (red solid curves) or destructive (magenta dotted curves) interference. The motivation for showing this detail here is that the MAID group CYTVD03 employ and coupling constants in their Regge contribution corresponding to a destructive interference very close to the result shown here for a destructive interference. By contrast, in our present calculations we have a constructive interference between the - and -meson contributions following Refs. NH04 ; NH06 . Obviously, one gets different resonance parameters whether the interference for this mesonic background is constructive or destructive. As can be seen from Fig. 5, in the former case, the total mesonic current (red solid curves) is relatively large at forward angles, while in the latter case (magenta dotted curves), it is much smaller over the entire angular range. In our model, the and coupling constants (including the respective signs) are determined from the measured decay widths and the SU(3) symmetry considerations in conjunction with the OZI rule (cf. Refs. NH04 ; NH06 ) which leads to a constructive interference. We were unable to identify how the signs of the - and -meson contributions were determined in Ref. CYTVD03 .
IV Quasi-free
In this section, the quasi-free photoproduction processes and are discussed. They are evaluated by folding the corresponding cross sections for the free processes with the momentum distribution of the target nucleon in the deuteron as described in Appendix A [cf. Eq. (8)].
We first compare in Fig. 6 the quasi-free cross-section data obtained by the CBELSA/TAPS Collaboration CBELSA11 with the corresponding free data from Refs. CLAS09 ; CBELSA09 . We note that, as for the free data, the uncertainties in the quasi-free data shown here include both the statistical and systematic errors added in quadrature. The latter errors were quoted in Ref. CBELSA11 but were not included in the data shown in that reference. Here, one sees that the quasi-free data practically coincide with the free data within their uncertainties for most of the angles and energies, although one sees some tendency for stronger angular dependence at a few energies. However, this does not necessarily mean that the free and quasi-free data are compatible with each other as discussed below. It is also interesting to note that, overall, the quasi-free CBELSA/TAPS data are more in line with the free CLAS data CLAS09 than with the free CBELSA/TAPS data CBELSA09 , a feature that has been also pointed out in Ref. CBELSA11 .
If the quasi-free hypothesis holds true, one would expect that the Fermi motion of the target nucleon inside the deuteron smears out the energy dependence of the free cross section. This then should affect more the cross section at low energies where one usually observes a strong energy dependence in the corresponding free cross section (cf. Fig. 3). At higher energies, where the energy dependence of the corresponding free cross section becomes weaker, the Fermi-motion smearing should have very little effect on the cross section. Therefore, based on the free total cross section results shown in Fig. 3, it is conceivable to expect the Fermi motion to affect the cross section up to about GeV. However, this is not what we observe in Fig. 6, where the quasi-free and free data still coincide with each other down to the lowest energy ( GeV) for which the free data are available. It would be interesting to also have data for the free process for lower energies closer to the threshold energy (at 1.896 GeV) to see the energy region where Fermi motion is relevant in this reaction.
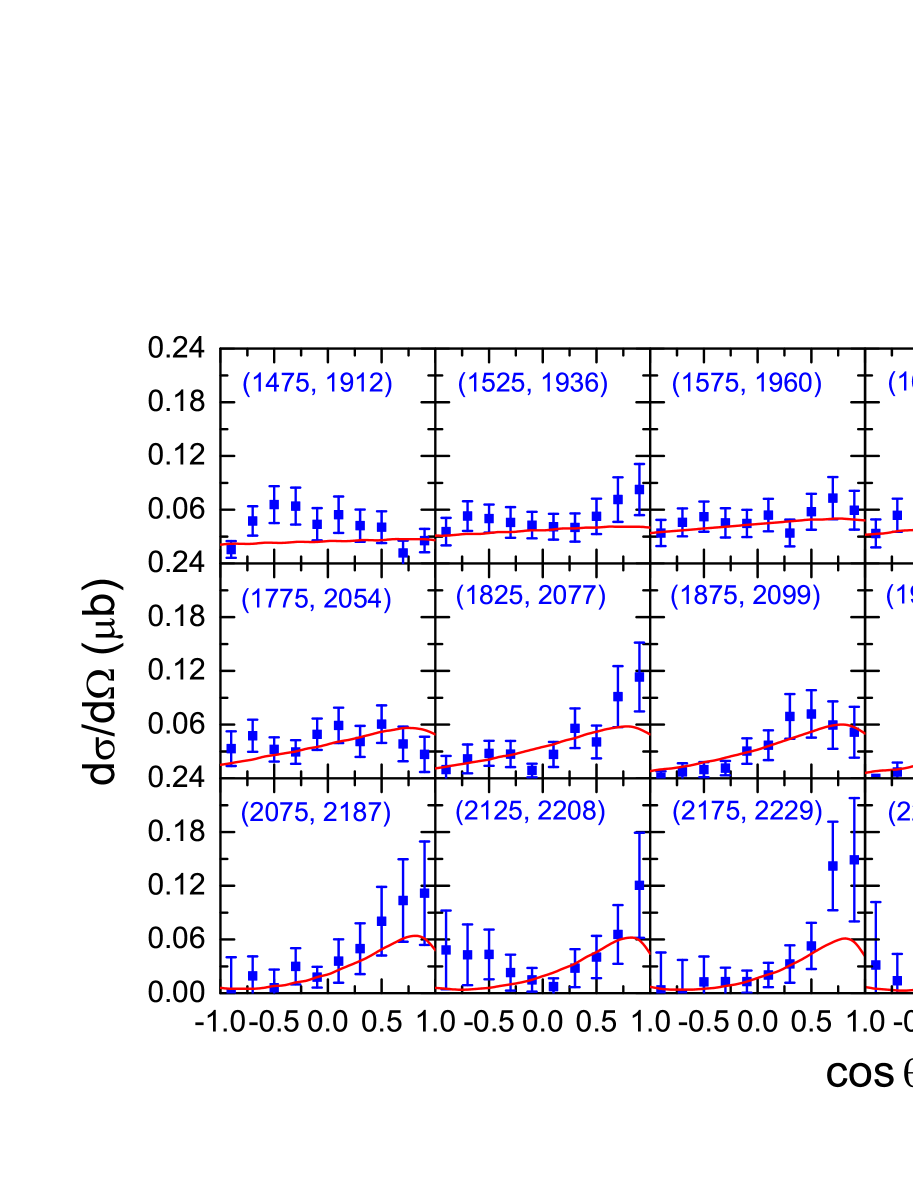
Figure 7 shows the same quasi-free differential cross-section data as in Fig. 6, but now with our results. The cyan dashed curves are obtained by simply folding the fit results of the free CBELSA/TAPS data CBELSA09 shown in Fig. 2 with the momentum distribution of the proton inside the deuteron according to Eq. (8), and the olive short-dashed curves correspond to the analogous results obtained for the free CLAS data CLAS09 . There are no extra fit parameters here; the parameters are all pre-determined by our fits of the free reaction. First, we see that the differences between the two sets of results obtained by folding are much smaller than what we observed in Fig. 2 for the free process at low energies. Here, the Fermi motion may be smearing out the differences observed there. Comparing with the data, we see that the present model predictions are overall fairly reasonable considering the fact that there are no free parameters to fit. We reiterate here, however, that the quasi-free data exhibit a stronger angular dependence for some energies, a finding already pointed out in connection with the discussion of Fig. 6. Also, the present predictions seem to exhibit a slight tendency to underestimate the lower-energy quasi-free data. This feature will be clearer as discussed below. The prediction corresponding to the fit result of the free CBELSA/TAPS data CBELSA09 (cyan dashed curves) tends to overpredict the data at some higher energies. Overall, the fits of the folded free CLAS CLAS09 and CBELSA/TAPS CBELSA09 data have an increased of 1.4 and 2.5, respectively.
The red solid curves in Fig. 7 correspond to the fit results of the quasi-free data also obtained via Eq. (8). The resulting parameters for this fit are shown in the right-most column of Table 1 for a direct comparison with those resulting from the free data fit. Here, the resonance mass values were fixed to be the average of the fit results of the free CLAS and CBELSA/TAPS data, since they are well determined by these free data. As can be seen, the fitted values of the other parameters are close to the corresponding values obtained from the fit of the free data as expected for the quasi-free process. The only notable difference is in the reduced helicity amplitudes, , for the spin-1/2 resonances. For the resonance, the value is much closer to the free CLAS result, which is understandable because at higher energies, the quasi-free data are much closer to the free CLAS data than to the free CBELSA/TAPS data. This might indicate a possible normalization problem in the free CBELSA/TAPS data at higher energies. For the resonance, the reduced helicity amplitude is almost a factor of 2 larger than the corresponding values extracted from the free data. As can be seen in Fig. 7, this is also easy to understand; the fit simply tries to enhance the cross section at lower energies, where the results obtained by folding the free cross sections without any fit parameters tend to underestimate the data.
Summarizing the discrepancies between quasi-free data and the Fermi-folded free cross sections, we find that the folded free results tend to underestimate the quasi-free data at lower energies and for higher energies, we find that, if anything, the folded free results are above the quasi-free results for some energies, in particular for the CBELSA/TAPS results. There might be two possible causes for this energy-dependent difference between the theoretical folding procedure and the corresponding experimental analysis: (i) Our prescription for accounting for the Fermi motion is not quite adequate [see Appendix A.2, in particular, Eq. (8)]. This prescription, however, works quite well for photoproduction Krusche95 ; Anisovich09 where there is a much stronger energy dependence in the cross section close to threshold. To test how sensitive the results are on the details of the folding procedure, we have also employed the alternative prescription of Eq. (7) which treats the total energy available to the subsystem differently from Eq. (8) (for details, see Appendix A.2), and we found no appreciable differences. (ii) The quasi-free data contain additional nuclear effects at lower energies which cannot be adequately described by the simple folding procedure. In fact, our calculation shows in Fig. 7 that the effect of Fermi folding can be seen for energies up to about 2 GeV, while the direct comparison of quasi-free and free data in Fig. 6 do not show this effect for energies down to the lowest energy of 1.934 GeV available for the free data. We note in this context that to force the theoretical folding results to agree with the quasi-free data at lower energies, we would need to drastically cut the higher-momentum part of the deuteron wave function. Further investigation are necessary to find out which of these two possible causes applies here — or perhaps even a combination of both.
One purpose of fitting the quasi-free data here is to have a quasi-free proton result on the same footing as the quasi-free neutron result, since the latter has to be fitted to the corresponding quasi-free data to fix the resonance transition electromagnetic couplings. In this way, quantities such as the ratio of the neutron and proton branching ratios will be free of possible unwanted effects which may distort the results otherwise.
In Fig. 8 we show the results for the quasi-free reaction. As mentioned in Sec. II, incorporating this reaction in our combined analysis rules out the set of above-threshold resonances which otherwise for the free reaction reproduces the data just as well as the set . Overall, we reproduce the quasi-free data reasonably well, with . The calculation requires adjusting free resonance-neutron- () coupling constants that need to be determined through the combined fit of the photon- and hadron-induced reaction data. Table 2 displays the resulting values. For the resonance, we obtain which is at the upper limit of the range of [0.0 - 0.016]% quoted in PDG PDG . We note that, as in the free case, here the parameters associated with this sub-threshold resonance are not well constrained by the data. In Table 2, we also give the ratio of the neutron-to-proton branching ratios. The sign of this ratio reflects the relative sign in the corresponding neutron and proton electromagnetic coupling constants. Although the branching ratios may be subject to a considerable ambiguity since, as discussed in the previous section, only the product of the coupling constants is well determined in the present calculation, the ratio is free of such an ambiguity.
| — | — | |||
| parameters | ||||
|---|---|---|---|---|
| ( MeV) | 1924 | 2129 | 1720 | 2050 |
| (MeV) | 112 | 205 | 200 | 140 |
| (%) | 6 | 3 | 0.09 | 2 |
| (%) | 22 | 25 | [] 16 | 25 |
| (%) | 4 | [] 0.5 | [] 9 | 0.03 |
| (%) | 22 | 62 | [70-85] 75 | 37 |
| (%) | 47 | 13 | 2 | 36 |
| (, ) | (0.68, 1.00) | (1.77, 1.00) | (1.20, —) | (1.38, —) |
| (, ) | (-0.36, 1.00) | (-1.28, 1.00) | (-0.17, —) | (-0.12, —) |
| (, ) | (-0.28, 0.81) | (-0.35, 0.34) | (-1.50, —) | (-0.04., —) |
| () | (-2.42, 0.04, —) | (2.58, -0.14, —) | (-23.63, 54.09, 16.72) | (0.50, 9.10, 28.66) |
| () | (1.02, -1.70, —) | (2.47, 0.53, —) | (-27.64, 138.87, -318.85) | (-3.19, -16.75, -36.39) |
V
In this section, we discuss our results for the nucleon-induced reaction obtained from the combined analysis of this reaction together with the and reactions. As mentioned in Sec. II, we find that among the spin-1/2 and -3/2 resonances considered in this work, the set of above-threshold resonances plus the sub-threshold resonance yields the best fit to all the available production data in the energy range considered in this work for photon- and hadron-induced reactions. The sub-threshold resonance, in particular, is required to help reproduce the observed shape of the angular distribution at the excess energy of MeV measured by the COSY-11 Collaboration Khoukaz . We recall here that in the present analysis, the mass of the sub-threshold as well as its width were fixed at the outset at the centroid values of the quoted in PDG PDG . As has been mentioned in Sec. II, we also note that the reaction rules out the set of above-threshold resonances which fits the photoproduction data as well as the set . As discussed later in connection with the invariant mass distribution in Fig. 12, the set is unable to reproduce the measured invariant mass distribution. In the following, for simplicity, we restrict ourselves to the results obtained in conjunction with the CLAS photoproduction data (cf. Table 1, column labeled “free ” CLAS) because the results corresponding to the other parameter sets shown in Table 1 can fit the data equally well.
The set of the parameter values of the present model that directly affect the hadronic processes is displayed in Table 3. The values result from the combined fit of the production in photon- and hadron-induced reactions. The resonance partial decay widths were calculated by folding the partial decay widths for a given decaying resonance mass and a given emitted meson mass with the corresponding mass distributions. For the latter, we assume Gaussian distributions with widths given by the corresponding total widths of the resonance and of the meson. The branching ratio for the sub-threshold resonance is extremely small because this arises only from the far (upper) tail of its mass distribution. As such, it is subject to considerable uncertainties. In the present work, the resonance coupling constants cannot be determined uniquely because the available data for production are not sufficient to impose more stringent constraints. In particular, the lack of data — there exist only three upper-limit total cross-section data points (see Fig. 9) — makes it difficult to constrain quantitatively the relative contributions of the isoscalar (, ) and isovector (, ) meson exchanges. It is also clear that one needs to consider meson-production reactions other than production to better constrain the relevant coupling constants.
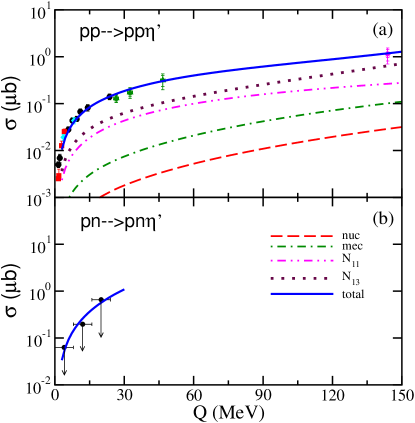
Our result for the total cross section is shown in Fig. 9. We see that the data are nicely reproduced over a wide range of excess energy. The dynamical content of the present model is also displayed. One sees that the spin-1/2 and -3/2 resonance contributions [in Fig. 9, and , respectively] have different energy dependencies. In the lower excess-energy region, the spin-1/2 resonance contribution is only slightly smaller than the spin-3/2 resonance contribution, but as the energy increases, the spin-3/2 resonance contribution starts to dominate. Here, the dominant spin-3/2 resonance contribution is due to the , while the dominant spin-1/2 resonance contribution is from the resonance. Although the overall relative and resonance-set contributions are well determined, the individual spin-1/2 and -3/2 resonance contributions within the set are not well constrained by the existing data, which is the reason why we only show the contributions of the sums of the spin-1/2 () and the spin-3/2 () resonances. The nucleonic and mesonic currents yield contributions that are much smaller than those of the resonances in the entire excess-energy range shown in Fig. 9. The result for the total cross section is also shown in Fig. 9. The together with the reactions helps constraining the isoscalar- and isovector-meson couplings (here, ) to the resonances. Unfortunately, only the upper limit of the cross section in a limited energy range is currently available for the process. Therefore, the isoscalar-isovector meson exchange content of the present model is subject to this limitation in the existing data.
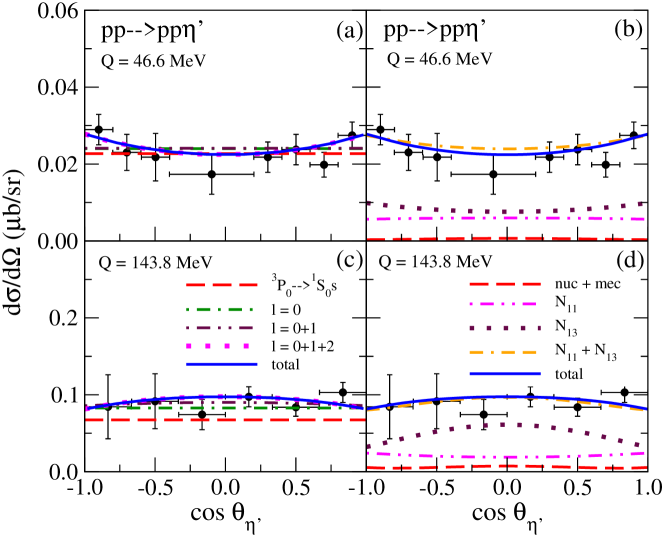
The results for the angular distribution in at the excess energies of and 143.8 MeV are shown in Fig. 10. The data are reproduced very well. We recall that the sub-threshold resonance is needed to reproduce the experimentally observed angular distribution, especially, at MeV. Here, one might regard this resonance as simulating some missing background in the present model. In this connection, however, we mention that this resonance is the closest known resonance to threshold that helps to reproduce the measured angular distribution. In the left-hand-side column, at MeV, we see that the angular distribution is dominated by the in the -wave due to the completely dominant transition . At the higher energy of MeV, the -wave contribution still dominates to a large extent, leading to a nearly flat angular distribution as exhibited by the data, even though the partial-wave contribution is somewhat smaller at this high energy than at the lower energy of MeV. As can be seen in the panels on the right-hand-side column in Fig. 10, the flat angular distribution, especially at higher energy, is achieved in the present model by an interference among different currents, in particular, between the spin-1/2 and -3/2 resonance currents.
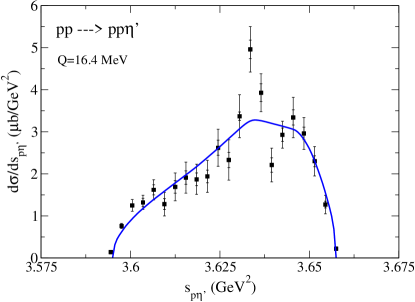
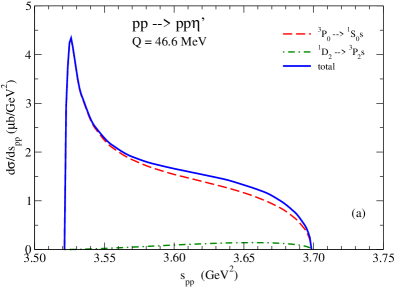
In Fig. 11, the result for the invariant mass distributions at an excess energy of MeV is shown. The data are reproduced well.
The invariant mass distribution together with the angular distribution poses a relatively strict constraint on the set of resonances, provided they are above-threshold resonances. In particular, the set of above-threshold resonances , which describes the photoproduction data as well as the set , is unable to reproduce the higher energy region of the measured invariant mass distribution by the COSY-11 collaboration COSY11-10a .
As we shall discuss below, the present result for the invariant mass distribution in reaction has an interesting implication on the issue of the reaction mechanisms in the reaction. In the latter reaction, there has been observed a significant enhancement of the cross section for larger invariant mass values compared to that given by the phase-space plus the FSI COSYTOF03 ; COSY1104 . One of the possible explanations for this enhancement is the relatively strong FSI. However, as pointed out in Ref. COSY11-10a , the shape of the invariant mass distribution data in at MeV is practically the same as that of shown in Fig. 12. Since the FSI is much smaller than the FSI, the explanation of the enhancement based on the FSI was ruled out in in Ref. COSY11-10a . In Ref. NHHS03 , an alternative explanation, based on the higher partial-wave (final state -wave) contribution, was proposed, together with a way to verify this proposed mechanism in a model-independent manner. Yet another explanation is the energy dependence of the basic production amplitude [cf. Eq. (9)] as proposed in Ref. Delof .
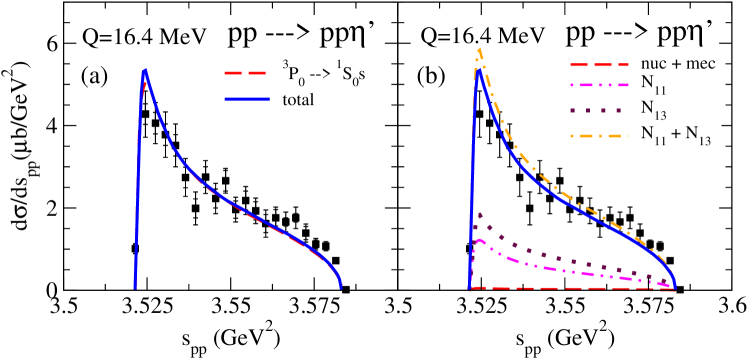
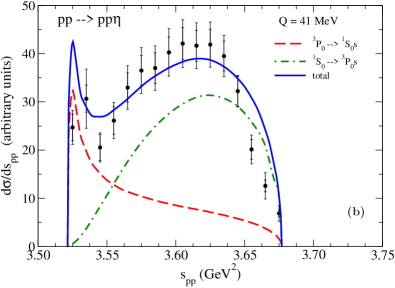
Figure 12 shows our results for the invariant mass distribution in revealing a good agreement with the COSY-11 data COSY11-10a . In the left panel of Fig. 12 one sees that the invariant mass distribution is practically exhausted by the partial wave. This is quite surprising in view of the findings of Ref. NHHS03 mentioned above, where a significant final-state -wave contribution was found in the higher invariant mass region in the reaction. The present finding implies that the -wave basic production amplitude () in the present model should have an energy dependence as proposed in Ref. Delof , since the invariant-mass dependence introduced by the FSI is not enough to account for the enhancement of the measured invariant-mass distribution at larger invariant masses. This finding tells us that the conclusion reached in Ref. COSY11-10a ruling out the FSI as a possible source of the enhancement in the invariant mass distribution at larger invariant mass values based on the comparison of the corresponding shapes in and has to be taken with caution since there might be different mechanisms operating in these reactions as shown explicitly here in Fig. 12. At this stage, it is natural to ask what the underlying dynamics is in the -wave contribution that accounts for the enhancement of the invariant mass distribution at larger invariant mass values in as compared to that in the reaction, where the enhancement arises from the partial wave. In the right panel of Fig. 12, we show the individual current contribution to the invariant mass distribution. We see that the enhancement at higher values of invariant mass is largely due to the constructive interference between the spin-1/2 (green dash-dotted curve) and the spin-3/2 (maroon dash-double-dotted curve) resonance contributions. The present model prediction for invariant-mass distribution at a higher excess energy of MeV is shown in the left panel of Fig. 13. Here one sees an onset of the contribution. This result together with the result in Fig. 12 reveal that the -wave contribution in is much smaller than that in . For a close comparison with the invariant mass distribution in the reaction at higher excess energies, we show in the right panel of Fig. 13 the corresponding results at MeV from Ref. NHHS03 . Here we see a striking difference between the model results for the two reactions. In , there is a very large enhancement in the invariant mass distribution at higher invariant mass values due to the partial wave contribution. By contrast, this partial wave contribution is minimal in the reaction. It would be very interesting to have measurements of the invariant mass distribution at this excess energy in to verify the present model prediction. Obviously, these are model-dependent results. As such, it will be very interesting to verify them in a model-independent manner as pointed out in Ref. NHHS03 .
VI
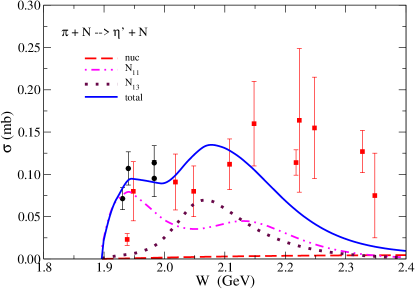
Experimental data for the reaction are scarce. The only available data are the total cross sections for and Dufey68 ; Rader72 ; Baldini88 which are subject to large uncertainties, as can be seen in Fig. 14. Notwithstanding the fact that these data offer little constraints for the model parameters, they were included in the global fit and the corresponding fit results are also shown in Fig. 14. We note here that within the present model the results for and are identical. An interesting feature of the present model result is the double-bump structure caused by the and an interplay of the and resonances (cf. Table 3). The resonance is just about 20 MeV above threshold. In view of their large uncertainties, the currently existing data shown in Fig. 14 can indeed accommodate such a structure, however, clearly more accurate data are needed for a definitive answer. If experimentally corroborated, such a bump structure would rule out the sub-threshold resonance-dominance assumption of Ref. Cao08 , where resonance dominance is assumed to describe both the and cross-sections data since it is not possible to generate any bump structure from sub-threshold resonances alone.
VII Summary
In the present work, we have revisited the theoretical description of production in photon- and nucleon-induced reactions to take into account the recent additions of accurate data to the corresponding world data base CLAS09 ; CBELSA09 ; CBELSA11 ; COSY11-10a ; COSY11-10b . All of the currently available data in the resonance-energy region considered in this work are nicely reproduced within the present model in a combined analysis of the reactions , , and . Considering only spin-1/2 and -3/2 resonances, we have found that the data are reproduced with a minimum of four resonances, i.e. , , , and . The is a four-star resonance listed in PDG PDG , and the later three resonances can be tentatively identified with the two-star , one-star , and one-star as listed in PDG PDG . All three above-threshold resonances quoted above are essential for achieving the fit quality obtained in this work. Leaving out any one of them deteriorates the fit quality considerably. The high-precision CLAS photoproduction data CLAS09 constrain the masses of the above-threshold resonances very well.
We emphasize that, given the absence of spin-observable data, only the combined analysis in the present work of recently obtained high-precision cross-section data across different reactions enabled us to impose sufficient constraints to unambiguously determine a minimum set of spin-1/2 and -3/2 resonances. Incorporation of more resonances, especially of higher-spin resonances, requires experimental data on spin observables. Currently, the beam asymmetry and the beam-target asymmetry in are being measured by the CLAS Collaboration Collins09 and CBELSA/TAPS Collaboration Afzal12 , respectively.
In the free reaction, there is a significant discrepancy between the most recent CLAS CLAS09 and CBELSA/TAPS CBELSA09 data. Since currently there is no clear reason to discard one set in favor of the other, these two data sets lead to differences in the extracted resonance parameters depending on which set is used for the analysis. The major difference is in the extracted coupling strength of the resonance, where the CBELSA/TAPS data CBELSA09 yield a much larger coupling than the CLAS data CLAS09 due to the larger cross sections exhibited by the CBELSA/TAPS data at higher energies.
The quasi-free and reactions have been also considered as a part of the combined analysis of the photon- and nucleon-induced reactions. The latter (quasi-free) reaction helps to constrain the set of above-threshold resonances. Overall, these reactions were reasonably well described by folding the cross sections of the corresponding free processes with the Fermi distribution of the nucleon inside the deuteron. The ratio of the neutron to proton electromagnetic couplings for the considered resonances were extracted. Overall, the CBELSA/TAPS proton quasi-free data CBELSA11 coincide with the proton free data within their uncertainties for most of the angles and energies, although the quasi-free data are more in line with the free CLAS data CLAS09 than with the free CBELSA/TAPS data CBELSA09 at higher energies, where the effect of the Fermi motion of the nucleon inside the deuteron is expected to have faded out. This might be an indication of a possible problem with the CBELSA/TAPS proton free data CBELSA09 . At lower energies, down to GeV, the lowest energy for which the proton free data exist, the data of Ref. CBELSA11 show no sign of the Fermi-motion effect, while the present model calculation exhibits this effect up to GeV. Further studies are necessary to identify the cause of this seeming discrepancy between the data and the model result.
We found that the existing photon-induced reactions themselves can be described by a set of three above-threshold resonances. However, the photoproduction data alone cannot constrain the set of resonances uniquely. In the present analysis, we also incorporate the invariant mass distribution data in the reaction to obtain a restriction to a single set of above-threshold resonances. The data clearly require the above-threshold resonance. Furthermore, the angular distribution data in this reaction cannot be described adequately without the sub-threshold resonance. Clearly, these findings illustrates that meson productions in collisions can help impose constraints on the resonances. As pointed out in Ref. NH06 , spin observables in photoproduction, in particular the beam asymmetry, are much more sensitive to the details of the model than are the cross sections. We also expect that the analyzing power in is sensitive to the excitation mechanism of a given resonance, as is the case for the reaction NSL02 . Also, in view of the contrasting results in and reactions shown in Fig. 13, it will be very interesting to measure the invariant mass distribution at an excess energy of MeV in the latter reaction to learn more about the possible production mechanism(s) in this reaction.
As has been pointed out in Refs. NH04 ; NH06 , the determination of the coupling strength of to nucleon is of special interest, particularly, in connection to the so-called nucleon spin crisis. In Ref. NH06 , based on the then available data, we estimated the upper limit of the coupling constant to be . From the present analysis, with much higher precision data, we now expect this coupling constant to be not much larger than , as can be seen from Table 1.
Finally, even though the hadronic final-state interactions in the reactions and was not considered explicitly in the present work, it has been accounted for effectively through the generalized contact current of the photoprocess. In principle, the FSI should be determined in a dynamical coupled channels approach, such as that of Ref. Juelich12 . However, this is currently not an easy task in practice because the scarcity of the relevant data in the channel restricts severely the determination of the FSI in this channel with reasonable accuracy. In this connection, spin observables – such as the target asymmetry in photoproduction – may be of particular relevance to help determine the FSI NOH11 .
Acknowledgements.
The authors thank V. Crede, I. Jaegle, B. Krusche, L. Tiator, and M. Williams for fruitful discussions. F.H. is grateful to Profs. Zong-Ye Zhang and Bing-Song Zou for their hospitality during his visit in the Institute of High Energy Physics, Chinese Academy of Sciences, where part of this work was completed. This work was supported by the FFE-COSY Grant No. 41788390 (COSY-58).Appendix A Formalism
The formalism used in the present work is the same as that of Refs. NH04 ; NH06 . For completeness, we provide here a brief description of this approach whose dynamical content is summarized by the graphs of Figs. 15 and 17.
A.1 Free photoproduction
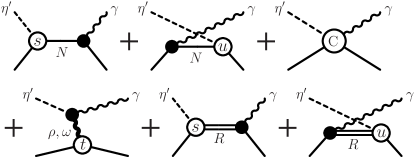
For the photoproduction, we employ the tree graphs of Fig. 15 with form factors at the vertices to account for their hadronic structure. The gauge invariance of this production current is ensured by a phenomenological contact current that accounts for the effects of the final-state interaction current not taken into account explicitly HHK11 ; Huang12 . Following Refs. HHK11 ; Huang12 , the generalized contact current is chosen to be
| (1) |
where stands for the vertex operator, without the corresponding isospin operator and the form factor. The latter enter the auxiliary current that is given by
| (2) |
with , , and denoting the four-momenta of the incoming photon, initial nucleon and final nucleon, respectively, and
| (3) |
with indices corresponding to the Mandelstam variables appropriate for the respective kinematic situations depicted in Fig. 15. The factors are unity if the corresponding channel contributes to the reaction in question, and they are zero otherwise; denotes the appropriate form factor. The parameter may be an arbitrary (complex) function, which, in general, is subject to crossing-symmetry constraints. (However, in the application discussed in this work, we simply take as a fit constant.)
The interaction Lagrangians as well as the form factors that provide the meson-nucleon-baryon and photon-nucleon-baryon vertices involved in the amplitudes , , , and are given in Appendix B.
A.2 Quasi-free photoproduction
Following Refs. ABHHM73 ; Krusche95 ; CBELSA11 , the quasi-free photoproduction processes are described within a spectator model by folding the cross sections for the corresponding free processes with the momentum distribution of the nucleon inside the deuteron.
In the laboratory frame, the deuteron is at rest and the spectator nucleon inside the deuteron is on its mass-shell and has three-momentum . Therefore, the energy of the participant nucleon inside the deuteron is given by
| (4) |
where denotes the mass of the spectator nucleon.
The invariant mass square of the subsystem, , can be expressed in the laboratory frame, where the participant nucleon inside the deuteron has three-momentum , as
| (5) |
where denotes the incident photon energy with denoting the invariant mass squared of the system and denoting the deuteron mass. The unit vector is given by , where k denotes the three-momentum of the incident photon.
Of course, one must have for the quasi-free process to take place. Together with this condition, the invariant mass squared, , in Eq. (5) can be expressed in terms of the four-momentum transfer square , where and stand for the four-momenta of the deuteron and the spectator nucleon, respectively, as
| (6) |
The differential cross section of the quasi-free photoproduction process is, then, approximated as
| (7) |
where . is the usual step function that is equal to 1 for and 0 otherwise. It has been introduce for the sole purpose of making explicit that for the free process to take place. is the scattering angle between outgoing meson and incoming photon. is the deuteron wave function in momentum space. is the differential cross section for a free photoproduction process.
A variant of Eq. (8) is to restrict the participant nucleon to be on its mass-shell in the argument of in Eq. (7) Krusche95 ; Anisovich09 ; CBELSA11 , i.e.,
| (8) |
There are at least two reasons for this on-shell restriction. One is the fact that the free cross sections that enter the equations above are “on shell”. The other is that by restricting , the effect of the Fermi folding is to smear out the free cross section keeping the centroid position, corresponding to , not to be shifted. The latter feature seems to better reproduce the quasi-free photoproduction data Krusche95 ; Anisovich09 .
A.3 Hadronic production
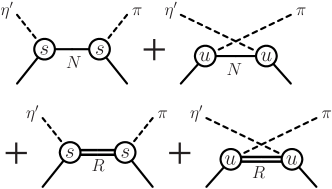
The reaction is described here within a tree-level approximation, analogous to the description of in Ref. NOH11 . We take into account the nucleonic and resonance contributions as depicted in Fig. 16. In principle, one could also include the -channel diagrams such as the (rank-two) tensor meson exchange, whose decay branching ratio to is quoted to be PDG . We have not considered such contributions in the present work since we do not expect that including them would alter our results in any significant manner. The propagators, vertices, and form factors necessary for calculating the Feynman diagrams in Fig. 16 are given in Appendix B.
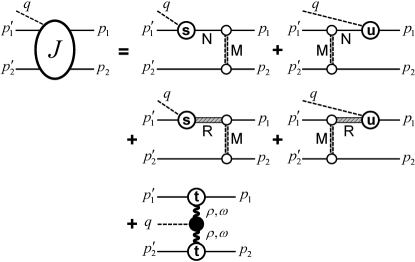
The hadronic reaction is described according to the model put forward in Refs. NADS99 ; NSL02 ; NOH11 . The DWBA amplitude for this process is given by
| (9) |
where , with , denotes the -matrix interaction in the initial () or final () state, and is the corresponding two-nucleon propagator (which absorbs the factor found in the DWBA formula given in Ref. NSL02 ). sums up the basic production mechanisms depicted in Fig. 17. The interaction Lagrangians as well as the form factors necessary for constructing the basic production amplitude are given in Appendix B. In the absence of models capable of providing a reliable off-shell initial state interaction (ISI), we consider it only in the on-shell approximation following Refs. HN99 ; NSL02 . This was shown to be a reasonable approximation for calculating cross sections HN99 . For the on-shell interaction, we consider the phase-shifts and inelasticities from the SAID partial-wave analysis SAID . All the partial waves up to total angular momentum are considered. The FSI is generated using the Paris potential Paris where the Coulomb interaction is taken into account fully as described in Ref. NADS99 . We also follow Ref. HN92 to convert the Paris interaction, which obeys the non-relativistic Lippman-Schwinger equation, to the one obeying the three-dimensionally reduced version (a la Blankenbecler-Sugar) of the relativistic Bethe-Salpeter equation in order to be consistent with the relativistic covariant approach used in the present work. We also use the Blankenbecler-Sugar propagator for the two-nucleon propagator in Eq. (9) for consistency.
Appendix B Lagrangians, Form Factors, and Propagators
The interaction Lagrangian used to construct our model for the basic production amplitudes is given below. For further convenience, we define the operators
| (10) |
B.1 Electromagnetic interaction Lagrangians
| (11) | ||||
| (12) | ||||
| (13) |
where stands for the elementary charge unit, and and , with the anomalous magnetic moments of the proton and of the neutron; stands for the nucleon mass. with denoting the electromagnetic field and is the totally antisymmetric Levi-Civita tensor with . The meson-meson electromagnetic transition coupling constants in the above Lagrangians, and , are extracted from a systematic analysis of the radiative decay of pseudoscalar and vector mesons based on flavor symmetry considerations in conjunction with vector-meson dominance arguments NADS99 ; their signs are inferred in conjunction with the sign of the coupling constant () determined from a study of pion photoproduction in the 1 GeV energy region GdG93 . The resulting vertex is multiplied by the form factor which describes the off-shell behavior of the intermediate vector meson with squared momentum transfer (cf. fourth diagram in Fig. 15). We use the dipole form
| (14) |
The cutoff , taken to be identical for both and , is a fit parameter.
The resonance-nucleon-photon-transition Lagrangians are
| (15a) | ||||
| (15b) | ||||
where the superscript of denotes the spin and parity of the resonance . The coupling constants () are fit parameters.
B.2 Hadronic interaction Lagrangians
In this subsection, we use , , and to denote the scalar, pseudoscalar, and vector meson fields, respectively. The vector notation refers to the isospin space. For isovector mesons, , , and .
The Lagrangians for meson-nucleon interactions are
| (16a) | ||||
| (16b) | ||||
| (16c) | ||||
where the parameter was introduced in to interpolate between the pseudovector () and the pseudoscalar () couplings. The coupling constant, , is a fit parameter. All the other coupling constants in the above Lagrangians are taken from Ref. Bonn , with the exception of as explained in Ref. NSL02 .
The () Lagrangians are
| (17) | ||||
| (18) |
The coupling constants, and , are obtained from a systematic analysis of the radiative decay of pseudoscalar and vector mesons based on symmetry considerations; their signs are inferred, in conjunction with vector-meson dominance assumptions, from the sign of the coupling constant () determined from a study of pion photoproduction in the 1 GeV energy region GdG93 .
For nucleon resonances,
| (19a) | ||||
| (19b) | ||||
| (19c) | ||||
| (19d) | ||||
where the Lagrangian (19a) contains the pseudoscalar-pseudovector mixing parameter , similar to Eq. (16b).
Each hadronic vertex obtained from the interaction Lagrangians given in this subsection is multiplied by a phenomenological cutoff function
| (20) |
where and denote the four-momenta of the two baryons, and is the four-momentum of the meson at the three-point vertex. Here, we use
| (21) |
where the cutoff MeV is taken the same for all the baryons , and is given by
| (22) |
with for a scalar or a pseudoscalar meson and for a vector meson. denotes the mass of meson . The values of are taken the same as those used in Ref. NSL02 .
B.3 Energy-dependent resonance widths
Our formalism is adapted to accommodate energy-dependent resonance widths with the appropriate threshold behavior.
For a spin-1/2 resonance propagator, we use the ansatz
| (23) |
where is the mass of the resonance with four-momentum . is the width function whose functional behavior will be given below.
For spin-3/2, the resonant propagator reads in a schematic matrix notation
| (24) |
All indices are suppressed here, i.e., is the metric tensor and is the Rarita–Schwinger tensor written in full detail as
| (25) |
where , , and enumerate the four indices of the -matrix components (summation over is implied). The inversion in (24) is to be understood on the full 16-dimensional space of the four Lorentz indices and the four components of the gamma matrices.
In both cases, we write the width as a function of according to
| (26) |
where the sums over accounts for decays of the resonance into two- or three-hadron channels and into radiative decay channels. The total static resonance width is denoted by and the numerical factors describes the branching ratios into the various decay channels, i.e.,
| (27) |
Similar to Refs. walker ; arndt90 ; lvov97 ; drechsel , we parameterize the width functions (which is normalized to unity at ) to provide the correct respective threshold behaviors. The details may be found in Ref. NH06 .
References
- (1) K. Nakayama and H. Haberzettl, Phys. Rev. C 69, 065212 (2004).
- (2) S. Capstick and N. Isgur, Phys. Rev. D 34, 2809 (1986); S. Capstick and W. Roberts, ibid. 47, 1994 (1993); 49, 4570 (1994); 57, 4301 (1998); 58, 074011 (1998).
- (3) M. Dugger et al., Phys. Rev. Lett. 96, 062001 (2006); Erratum-ibid. 96, 169905 (2006).
- (4) M. Williams et al., Phys. Rev. C 80, 045213 (2009).
- (5) V. Crede et al., Phys. Rev. C 80, 055202 (2009).
- (6) I. Jaegle et al., Eur. Phys. J. A 47, 11 (2011).
- (7) P. Klaja et al., Phys. Lett. B 684, 11 (2010).
- (8) F. Hibou et al., Phys. Lett. B 438, 41 (1998); P. Moskal et al., Phys. Rev. Lett. 80, 3202 (1998); P. Moskal et al., Phys. Lett. B 474, 416 (2000).
- (9) F. Balestra et al., Phys. Lett. B 491, 29 (2000).
- (10) A. Khoukaz et al., COSY-11 Collaboration, Eur. Phys. J. A 20, 345 (2004).
- (11) J. Klaja et al., Phys. Rev. C 81, 035209 (2010).
- (12) K. Nakayama and H. Haberzettl, Phys. Rev. C 73, 045211 (2006).
- (13) P. Collins, B. G. Ritchie, M. Dugger, E. Pasyuk, F. Klein et al., to be published.
- (14) F. N. Afzal (CBELSA/TAPS Collaboration), EPJ Web of Conferences 37, 09001 (2012).
- (15) Xian-Hui Zhong and Qiang Zhao, Phys. Rev. C 84, 065204 (2011).
- (16) J. Beringer et al. (Particle Data Group), Phys. Rev. D 86, 010001 (2012).
- (17) A. Sibirtsev, J. Haidenbauer, S. Krewald, and U.-G. Meißner, Eur. Phys. J. A 46, 359 (2010).
- (18) K. Nakayama, Yongseok Oh, H. Haberzettl, J. Korean Phys. Soc. 59, 224 (2011).
- (19) W. T. Chiang, S. N. Yang, L. Tiator, M. Vanderhaegen, and D. Drechsel, Phys. Rev. C 68, 045202 (2003).
- (20) B. Krusche et al., Phys. Lett. B 358, 40 (1995).
- (21) A. V. Anisovich et al., Eur. Phys. J. A 41, 31 (2009).
- (22) M. Abdel-Bary et al., (COSY-TOF Collaboration), Eur. Phys. J. A 16, 127 (2003).
- (23) P. Moskal et al., Phys. Rev. C 79, 015208 (2009); P. Moskal et al., Phys. Rev. C 69, 025203 (2004).
- (24) K. Nakayama, J. Haidenbauer, C. Hanhart, and J. Speth, Phys. Rev. C 68, 045201 (2003).
- (25) A. Deloff, Phys. Rev. C 69, 035206 (2004).
- (26) J. P. Dufey, B. Gobbi, M. A. Pouchon, A. M. Cnops, G. Finocchiaro, J. C. Lassalle, P. Mittner, and A. Müller, Phys. Lett. B 26, 410 (1968); M. Basile et al., Nuovo Cim. A 3, 371 (1971); M. Basile et al., Nucl. Phys. B 33, 29 (1971).
- (27) P. K. Rader et al., Phys. Rev. D 6, 3059 (1972); J. Bensinger, A. R. Erwin, M. A. Thompson, and W. D. Walker, Phys. Lett. B 33, 505 (1970); R. J. Miller, S. Lichtman, and R. B. Willmann, Phys. Rev. 178, 2061 (1969).
- (28) A. Baldini, V. Flaminio, W. G. Moorhead, and D. R. O. Morrison, Total Cross-Sections for Reactions of High Energy Particles, Landolt-Börnstein, edited by H. Schopper (Springer, Berlin, 1988), Vol I/12a.
- (29) Xu Cao and Xi-Guo Lee, Phys. Rev. C 78, 035207 (2008).
- (30) K. Nakayama, J. Speth, and T.-S. H. Lee, Phys. Rev. C 65, 045210 (2002).
- (31) D. Rönchen, M. Döring, F. Huang, H. Haberzettl, J. Haidenbauer, C. Hanhart, S. Krewald, U.-G. Meißner, and K. Nakayama, Eur. Phys. J. A 49, 44 (2013).
- (32) H. Haberzettl, F. Huang, and K. Nakayama, Phys. Rev. C 83, 065502 (2011).
- (33) F. Huang, M. Döring, H. Haberzettl, J. Haidenbauer, C. Hanhart, S. Krewald, U.-G. Meißner, and K. Nakayama, Phys. Rev. C 85, 054003 (2012).
- (34) P. Benz et al., Nucl. Phys. B 65, 158 (1973).
- (35) K. Nakayama, H. F. Arellano, J. W. Durso, and J. Speth, Phys. Rev. C 61, 024001 (1999).
- (36) Ch. Hanhart and K. Nakayama, Phys. Lett. B 454, 176 (1999).
- (37) SAID Data Analysis Center, Institute for Nuclear Studies, The George Washington University, Washington, DC 20052, USA. http://gwdac.phys.gwu.edu.
- (38) M. Lacombe, B. Loiseau, J. M. Richard, R. Vinh Mau, J. Côté, P. Pirès, and R. de Tourreil, Phys. Rev. C 21, 861 (1980).
- (39) V. Herrmann and K. Nakayama, Phys. Rev. C 46, 2199 (1992).
- (40) H. Garcilazo and E. Moya del Guerra, Nucl. Phys. A 562, 521 (1993).
- (41) R. Machleidt, Adv. Nucl. Phys. 19, 189 (1989).
- (42) R. L. Walker, Phys. Rev. 182, 1729 (1969).
- (43) R. A. Arndt, R. L. Workman, Z. Li, and L. D. Roper, Phys. Rev. C 42, 1864 (1990).
- (44) A. I. L’vov, V. A. Petrun’kin, and M. Schumacher, Phys. Rev. C 55, 359 (1997).
- (45) D. Drechsel, O. Hanstein, S. S. Kamalov, and L. Tiator, Nucl. Phys. A 645, 145 (1999).