Satellites and Halos of Dwarf Galaxies
Abstract
We study the abundance of satellite galaxies as a function of primary stellar mass using the SDSS/DR7 spectroscopic catalogue. In contrast with previous studies, which focussed mainly on bright primaries, our central galaxies span a wide range of stellar mass, , from dwarfs to central cluster galaxies. Our analysis confirms that the average number of satellites around bright primaries, when expressed in terms of satellite-to-primary stellar mass ratio (), is a strong function of . On the other hand, satellite abundance is largely independent of primary mass for dwarf primaries (). These results are consistent with galaxy formation models in the CDM scenario. We find excellent agreement between SDSS data and semi-analytic mock galaxy catalogues constructed from the Millennium-II Simulation. Satellite galaxies trace dark matter substructure in CDM, so satellite abundance reflects the dependence on halo mass, , of both substructure and galaxy stellar mass (). Since dark matter substructure is almost scale-free, the dependence of satellite abundance on primary mass results solely from the well-defined characteristic mass in the galaxy mass-halo mass relation. On dwarf galaxy scales, where models predict a power-law scaling, , similarity is preserved and satellite abundance is independent of primary mass. For primaries brighter than the characteristic mass of the - relation, satellite abundance increases strongly with primary mass. Our results provide strong support for the steep, approximately power-law dependence of dwarf galaxy mass on halo mass envisioned in CDM galaxy formation models.
keywords:
galaxies: dwarf – galaxies: formation – galaxies: haloes1 Introduction
Matching the galaxy luminosity function in the CDM scenario requires that the stellar mass of galaxies, , should vary strongly with the virial111Virial quantities are defined at the radius from the center of each halo where the mean enclosed density equals times the critical density of the Universe and are identified by a subscript. Units assume a Hubble constant of km s-1 Mpc-1 unless otherwise specified. mass, , of their surrounding dark matter halos. This exercise implies that the “efficiency” of galaxy formation, as measured by the ratio , decreases steadily toward both smaller and larger masses from a maximum at (Yang et al., 2003; Vale & Ostriker, 2004; Shankar et al., 2006; Zheng et al., 2007; Kravtsov, 2010; Moster et al., 2010; Behroozi et al., 2010; Guo et al., 2010; Guo et al., 2011). On the scale of dwarf galaxies () these models require a near power-law dependence, , in order to reproduce observations of faint objects (however, see Behroozi et al., 2012). Such a steep - relation implies that dwarfs differing by as much as three decades in stellar mass (e.g., from the Fornax dwarf spheroidal to the Large Magellanic Cloud) inhabit halos spanning just over one decade in virial mass. Furthermore, very few galaxies exceeding are expected to have halos with virial masses below (Ferrero et al., 2011).
These predictions have been recently challenged by a series of observations, including (i) the lack of a characteristic velocity at the faint-mass end of blind HI surveys (expected if most dwarfs live in similar halos, Zwaan et al. 2010; Papastergis et al. 2011); and (ii) the low virial mass (substantially below ) inferred from dynamical data for the dwarf spheroidal companions of the Milky Way (Boylan-Kolchin et al., 2012) and for nearby dwarf irregulars (Ferrero et al., 2011). The evidence, however, is indirect, since halo masses are estimated by extrapolating data that probe only the inner few kiloparsecs, where most baryons reside.
We explore here the possibility of using satellite galaxies to help constrain the virial masses of dwarf galaxies. The orbital motions of satellite companions have often been used to estimate halo masses (see, e.g., Zaritsky et al., 1997; Erickson et al., 1999; McKay et al., 2002; Prada et al., 2003; van den Bosch et al., 2004; Brainerd, 2005; Conroy et al., 2007; Wojtak & Mamon, 2012), but this work has largely been restricted to systems similar to or brighter than the Milky Way. This is partly due to the difficulties in obtaining redshifts for faint objects. In addition, satellite companions are less common around dwarf galaxies than around larger systems: the number of satellites brighter than a certain fraction of the primary luminosity, , declines strongly toward fainter primaries (e.g. Guo et al., 2011; Wang & White, 2012). Dwarf galaxy associations do exist, but only a handful have been observed (e.g., Tully et al., 2006).
In CDM, where satellite galaxies are thought to trace the substructure of cold dark matter halos, satellite systems are expected around all central galaxies, regardless of luminosity. The number of satellites, and their dependence on primary mass, should just reflect the abundance of substructure modulated by the dependence of galaxy formation efficiency on halo mass.
Substructure abundance has been studied extensively through numerical simulations, and shown to be nearly invariant with halo mass when expressed as a function of satellite mass normalized to that of the host (Moore et al., 1999; Kravtsov et al., 2004; Gao et al., 2004; Wang et al., 2012). This result, together with the strict constraints on galaxy formation efficiency mentioned above, imply that satellite number counts provide useful information on the halo mass of dwarf galaxies. In particular, the near self-similarity of cold dark matter halos provides an instructive test: if satellite galaxies trace substructure then the abundance of luminous satellites should also be scale-free on scales where galaxy mass and halo mass are related by a power law.
We explore these issues here by identifying primary-satellite systems in galaxy catalogues constructed from the Sloan Digital Sky Survey and by comparing them with predictions from a semianalytic mock galaxy catalogue based on the Millennium Simulations. The plan for this paper is as follows. Sec. 2 describes briefly the observational and model datasets while Sec. 3 presents our main results. We summarize our main conclusions in Sec. 4.
2 Data and Catalogues
2.1 Satellite and primary galaxies in SDSS/DR7
We select primary galaxies spanning a wide range of stellar mass, , from the spectroscopic New York University Value Added Galaxy Catalog (NYU-VAGC). This catalogue was built on the basis of the seventh data release of the Sloan Digital Sky Survey (SDSS/DR7; Blanton et al., 2005; Abazajian et al., 2009). Stellar masses are taken directly from the NYU-VAGC catalog and are estimated by fitting stellar population synthesis models to the -corrected galaxy colours. They assume a Chabrier (2003) initial mass function.
We ensure isolation by imposing two conditions: (i) each primary must be the brightest of all objects projected within its virial radius with line-of-sight velocities differing by less than three times the corresponding virial velocity; and (ii) no primary can be located within the virial radius of a more massive system. Virial quantities are inferred from the stellar mass, assuming the abundance-matching - relation of Guo et al. (2010) and cosmological parameters consistent with WMAP1 results , and km/s (Spergel et al., 2003). Fainter galaxies within a projected distance and a line-of-sight velocity difference are then classified as satellites (see Sec. 2.2). We have checked that our results are not sensitive to variations by factors of a few in these thresholds, nor to the addition of - dex scatter to the - relation.
We apply volume and edge corrections to our sample in the same way as Wang & White (2012). Completeness for SDSS spectroscopic data is estimated to be for apparent -band magnitudes brighter than (Blanton et al., 2005). This limit applies to satellite and primary galaxies independently. However, satellites are fainter than their centrals, having an absolute magnitude difference . This means that the effective volume where satellites of a given are (almost) complete varies strongly with , or equivalently, with primary mass. For instance, satellites about a magnitude fainter than their hosts will have and for primaries with stellar masses in the ranges and , respectively. In our sample, the limiting distance where satellites can be found with is roughly kpc for primaries with . This halves for primaries with , and drops to for centrals with . Despite the smaller volume surveyed for low mass galaxies, there are still enough galaxies to probe the satellite population of even the faintest primaries we considered.
One might think that the detection of faint objects would be aided by selecting satellites from the photometric catalogue; which is complete down to magnitudes fainter than the spectroscopic sample. This requires the stacking of primary galaxies and a statistical background subtraction in order to identify the excess count corresponding to satellites (Lorrimer et al., 1994; Lares et al., 2011; Liu et al., 2011; Nierenberg et al., 2011; Guo et al., 2011; Strigari & Wechsler, 2012; Wang & White, 2012). However, the signal-to-noise to carry out this subtraction is too low for our faint primaries (). Our sample is then selected purely from the spectroscopic catalogue. We discuss briefly possible biases affecting faint, low surface brightness companions in Sec 3.
2.2 Satellite and primary galaxies in the semi-analytic model
We compare our SDSS results with the semi-analytic catalogue of Guo et al. (2011), based on the dark matter only Millennium-II Simulation (hereafter MS-II, Boylan-Kolchin et al., 2011). The model parameters are carefully tuned to reproduce the observed abundance of low-redshift galaxies over five orders of magnitude in stellar mass and 9 mag in luminosity. The semi-analytic data contain full 3D velocity and positional information for all galaxies, and thus enables the evaluation of potential biases that may be induced by the limited (projected) data available in observational surveys.
Fig. 1 and 9 of Guo et al. (2011) shows that predictions for galaxy mass are reliable in simulated halos resolved with at least - dark matter particles. This corresponds roughly to and in MS-II. We therefore consider only galaxies with in the analysis below.
Galaxies in the semi-analytic catalogue inhabit dark matter halos and subhalos identified using the subfind group-finder algorithm (Springel et al., 2001). Primary galaxies are the central objects of each halo; all other galaxies within the virial radius are considered satellites. The catalogue also includes “orphan” galaxies whose subhalos have been disrupted due to numerical resolution effects. The catalogue contains more than primary galaxies in the mass range .
The semi-analytic data can be “projected” to mimic the same satellite identification algorithm used for SDSS data (see, e.g., Wang & White 2012 for details). Notice that, because of the different identification criteria applied, the projected satellite and primary samples selected from the mock catalogue differ from the 3D samples (where we use information about the condition as central/satellite object from the subfind catalogues). This enables us to calibrate the parameters of the identification procedure in order to minimize the contribution of foreground and background objects in our primary/satellite sample.
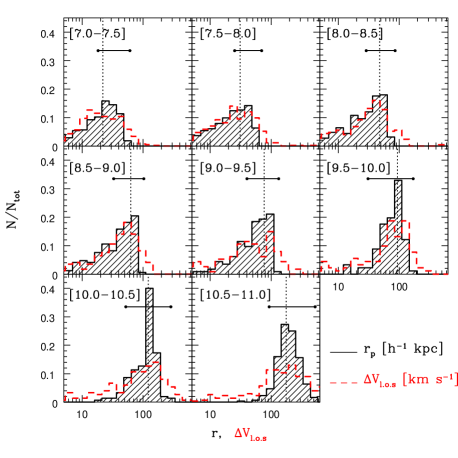
Fig 1 show the distributions of projected distance (, shown in black) and line-of-sight velocity difference (, shown in red) between primaries and “true” satellites, grouped in several bins of primary stellar mass. Primaries in each bin span a range of virial masses given by the - relation and its scatter. For each panel, a horizontal line indicates the minimum and maximum virial radius/velocity of the host haloes contributing to that bin. All histograms peak approximately at the average virial radius and virial velocity of host halos in the subsample, indicated by the vertical dotted line.
Although by definition , the upper bound of the velocity difference is less clear, as the escape velocity typically exceeds the virial velocity of a halo substantially in the inner regions. The red histograms in Fig. 1 suggest that the large majority of true satellites have line-of-sight velocities that differ from their primaries by less than . These considerations justify the choices and made to identify satellite/primary systems in the observational sample (Sec. 2.1).
3 Results
As discussed in Sec. 1, the galaxy-halo mass relation is expected to leave a clear imprint on the abundance of satellites galaxies as a function of primary stellar mass. We explore these ideas in Fig. 2 using the semi-analytic catalogue described in Sec. 2.2.
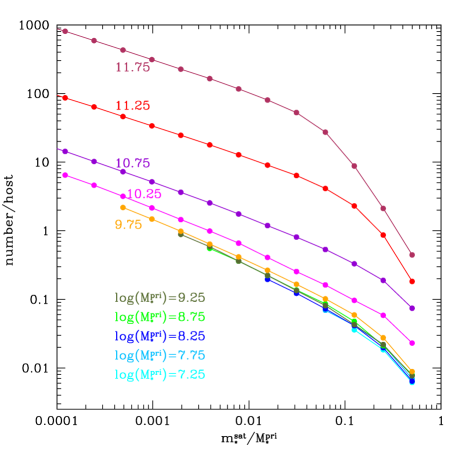
Fig. 2 shows, as a function of satellite-to-primary mass ratio, the average number of satellites orbiting primaries of different mass in the semi-analytic galaxy catalogue. Primaries are binned in logarithmic bins of dex width; the central mass value is quoted in the legend. Satellites are identified in 3D, using the full position and velocity information available in the catalogue.
Fig. 2 shows clearly that the average number of satellites of bright primaries increases strongly with . On average, a primary as massive as is surrounded by roughly satellites more massive than . On the other hand, only of primaries as massive as the Milky Way () have one satellite proportionally as massive. The probability of having a companion with drops further to for .
Interestingly, this trend does not hold for lower primary masses. The satellite abundance, expressed in terms of , becomes independent of primary mass in the dwarf-galaxy regime (). As discussed in Sec. 1, this reflects the featureless power-law scaling between galaxy and halo masses in these scales and is a prime prediction of the model testable by observation.
In order to take into account how projection effects and the presence of interlopers may affect this result, we repeat the analysis using only projected positions and line-of-sight velocities, as described in Sec. 2.2. This enables us to select primaries and satellites in identical ways for both model and observational datasets.
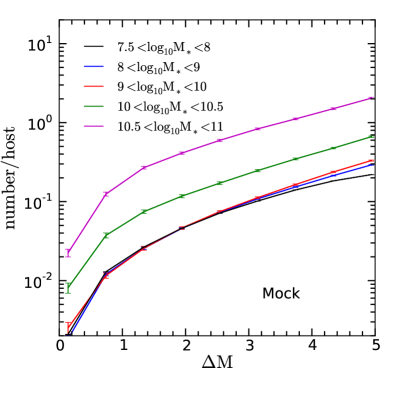
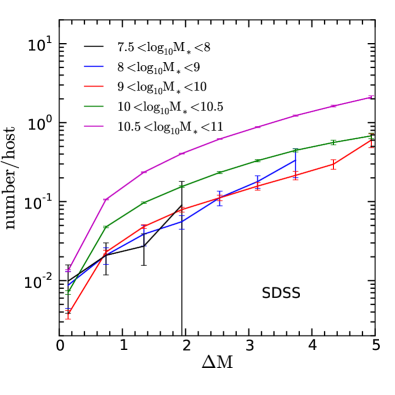
Fig. 3 shows, for the mock (left) and SDSS (right) samples, the average number of satellites with -band magnitude difference equal to or smaller than . This is not only the simplest observational analogue of the stellar mass ratio but also allows a more straightforward derivation of the completeness correction for the catalogue. The use of stellar masses would introduce extra uncertainties that would have to be compensated by more conservative cuts to ensure completeness. Working with magnitudes allows us to increase the effective statistical power of the catalogue. As in Fig. 2, we bin primaries according to their stellar mass, as indicated in the legends. Error bars correspond to 100 bootstrap resamplings of the data.
The left panel in Fig. 3 shows that the projected data behave similarly to the 3D sample: the abundance of satellites at given increases with for bright primaries (Guo et al., 2011; Wang & White, 2012) but becomes independent of mass for dwarf primaries (). The overall behaviour is in strikingly good agreement with the SDSS satellite abundances, shown on the right. Despite the large error bars in the faint-primary bins (an unavoidable consequence of the limited effective volume surveyed by SDSS) the observed trends in satellite count with primary stellar mass closely resemble those in the mock catalogue. We interpret this result as providing strong evidence in support of the nearly power-law dependence of galaxy mass on halo mass on dwarf galaxy scales advocated by semianalytic models of galaxy formation in the CDM scenario.
One concern regarding this interpretation arises from the completeness of SDSS spectroscopic data on dwarf galaxy scales. The sample is, on average, complete at our apparent magnitude limit of . We partially correct for biases by weighting satellites and primaries with their FGOTMAIN value, which characterizes the completeness of SDSS in a given region of the sky due to fiber collision (Blanton et al., 2005). However, the completeness might worsen if objects of low surface brightness, such as many dwarfs, are systematically missed. The results in Fig 3 would then represent lower-limits to the true satellite abundance, but would still provide useful constraints on the halo mass of their hosts. We notice, however, that if our results were strongly affected by low-surface brightness biases, the good agreement between observations and the semianalytic model would be puzzling. Nevertheless, this point requires further validation once surveys with improved surface brightness sensitivity become available.
The deblending of extended objects into multiple spurious “galaxies” could potentially affect our results. As a sanity check, we have repeated the analysis of Fig. 3 using the NASA Sloan Atlas222http://www.nsatlas.org (NSA). This catalogue is based on SDSS-DR8 data but uses a different background substraction technique that specifically improves the identification of galaxies over the original SDSS pipeline, especially for low-redshift extended objects (Blanton et al., 2011; Geha et al., 2012). This catalogue only include galaxies with redshifts and is almost complete for (model) -band magnitudes . Once equivalent cuts are applied to our sample we find that the abundance of satellites in DR7 and NSA are consistent within their error bars; with a small upward offset of DR7 compared to NSA. This shift is negligible for and less than a factor of for fainter primaries, which is comparable to the uncertainties estimated by bootstrap of the samples. Importantly, the apparent mass-independence of satellite counts for primaries less massive than is also found in the NSA sample.
In addition to providing hints about the power-law nature of the - relation at the low-mass end, satellite number counts can also help constrain its slope. Assuming that satellite and primary galaxies follow the same power-law relation and that the unevolved subhalo mass function is self-similar, as predicted by CDM333 for small , where is the ratio of the dark matter masses of subhalo at infall time and host at . Typically (Giocoli et al., 2008; Yang et al., 2011), then the abundance of faint satellites should scale roughly with , where . Notice that this behaviour is only expected over the mass ranges where the substructure mass function is a power law, which typically requires (e.g. Giocoli et al., 2008). This imposes an upper limit on the relative mass of the companions where we expect to hold.
In the semianalytic model, , which is roughly in agreement with the slope of the satellite mass function in Fig. 2 measured for low-mass companions . This relation is independent of , provided the simulation resolves satellites differing by three or more orders of magnitude in stellar mass with respect to . This, in our simulations, happens at . Interestingly, the scatter in stellar mass at fixed halo mass, which in the model is dex for the low-mass objects (Guo et al., 2011), does not seem to impact the slope derived from the simple arguments given previously. However, this would change if the scatter in the - relation were strongly correlated to the halo mass. In our case this correlation is rather mild.
We conclude from Fig. 3 that the good agreement in shape, normalization and slope between SDSS primaries and the mock catalogue strongly favours a power-law relation with a steep slope between stellar mass and halo mass of dwarf galaxies. This agrees with predictions from the semianalytic model of Guo et al. (2011) and from extrapolations of abundance-matching studies (e.g., Moster et al., 2010; Behroozi et al., 2010; Guo et al., 2010).
4 Discussion and Conclusions
We study the abundance of satellites as a function of primary stellar mass in the Sloan Digital Sky Survey. Using the SDSS/DR7 spectroscopic sample from the NYU-VAGC catalogue we are able to extend previous studies to significantly fainter primaries, -. In agreement with previous work, we find that the abundance of satellites exceeding a given satellite-to-primary stellar mass ratio, , depends strongly on for bright primaries. On the other hand, the abundance of satellites around dwarf primaries, , is approximately independent of primary stellar mass.
These results are in excellent agreement with predictions of semi-analytic models within CDM. These trends arise from the mass invariance of substructure in CDM halos and from the varying efficiency of galaxy formation as a function of halo mass. On dwarf galaxy scales, where the relation between galaxy mass and halo mass is well approximated by a steep power law, the invariance of satellite abundance with primary mass reflects directly the scale-free nature of substructure. Around bright galaxies the scaling between galaxy mass and halo mass deviates from a simple power law, leading to the observed strong increase of satellite abundance with increasing primary mass.
Some caveats on the statements above need to be mentioned. The first relates to the definition of halo mass for a galaxy that has entered the virial radius of a larger object. The mass in subhalos is in general ill-defined, depending not only on the identification algorithm (Knebe et al., 2011), but also on time, due to tidal stripping (e.g. Tormen et al., 1998; Klypin et al., 1999; Hayashi et al., 2003). The stellar mass, however, is more resilient to tidal effects and remains approximately constant after accretion onto the host (White & Rees, 1978; Sales et al., 2007; Peñarrubia et al., 2008). Thus for satellite galaxies, the virial mass at the moment of accretion is more closely related to the stellar mass than their present-day dark halo mass. Since the abundance of subhaloes according to their infall mass –termed the “unevolved” subhalo mass function– is also independent of host halo mass when written as a function of the relative mass between satellite and host (e.g. Giocoli et al., 2008; Yang et al., 2011), the arguments given above remain valid.
The second caveat involves the possible dependence of the - relation on redshift and, related to that, whether satellites and primaries follow the same relation between stellar mass and halo mass. Abundance matching models suggest that the link between the stellar mass and halo mass evolves weakly with redshift (Shankar et al., 2006; Conroy & Wechsler, 2009; Wang & Jing, 2010; Leauthaud et al., 2011; Yang et al., 2012; Moster et al., 2012; Behroozi et al., 2012). Given that surviving satellites are preferentially accreted at late times (e.g. Gao et al., 2004; Sales et al., 2007) the - relation for satellites and centrals are expected to be similar. In particular, self-consistent semi-analytical modelling of galaxies shows only small differences between the two (e.g. see Fig. 9 of Guo et al., 2011).
Notice that these arguments do not allow for stripping of the stars from satellites. Arguably, this could complicate the evolution. We note, however, that numerical models for dwarf galaxies suggest that once stellar stripping sets in, total disruption soon follows (Peñarrubia et al., 2008). We therefore expect partial stripping of stars to have minor effects in large statistical samples. On the other hand, several studies have suggested that accounting for total disruption of satellites is needed to match observations (e.g. Weinmann et al., 2006; Kimm et al., 2009). We address this by comparing observational results with a semi-analytic model that explicitly treats satellite disruption by tidal forces.
Under the assumption of a CDM universe, the good agreement in shape and normalization between satellite counts in SDSS and those in the mock catalogue provides support for a steep stellar-halo mass relation for dwarfs, consistent with the predicted both by semi-analytic models and by extrapolations of current abundance-matching analyses. More definitive constraints on the slope of the - relation for dwarf galaxies may come from a robust determination of the slope of satellite abundances around isolated primaries in tandem with studies of the effect of scatter in the stellar mass - halo mass relation. Probing increasingly fainter companions in observational surveys of the surroundings of isolated dwarfs may prove crucial for this goal.
Acknowledgements
The authors are grateful for a prompt and very useful referee report that helped to improve the previous version of the manuscript. We thank Risa Wechsler for stimulating discussions. LVS is grateful for financial support from the CosmoComp/Marie Curie network. The authors thank the hospitality of the Kavli Institute for Theoretical Physics, Santa Barbara during the program “First Galaxies and Faint Dwarfs: Clues to the Small Scale Structure of Cold Dark Matter”, where part of this work was completed. This research was supported in part by the National Science Foundation under Grant No. NSF PHY11-25915.
References
- Abazajian et al. (2009) Abazajian K. N., Adelman-McCarthy J. K., Agüeros M. A., Allam S. S., Allende Prieto C., An D., Anderson K. S. J., Anderson S. F., Annis J., Bahcall N. A., et al. 2009, ApJS, 182, 543
- Behroozi et al. (2010) Behroozi P. S., Conroy C., Wechsler R. H., 2010, ApJ, 717, 379
- Behroozi et al. (2012) Behroozi P. S., Wechsler R. H., Conroy C., 2012, ArXiv 1207.6105
- Blanton et al. (2011) Blanton M. R., Kazin E., Muna D., Weaver B. A., Price-Whelan A., 2011, AJ, 142, 31
- Blanton et al. (2005) Blanton M. R., Schlegel D. J., Strauss M. A., Brinkmann J., Finkbeiner D., Fukugita M., Gunn J. E., Hogg D. W., Ivezić Ž., Knapp G. R., Lupton R. H., Munn J. A., Schneider D. P., Tegmark M., Zehavi I., 2005, AJ, 129, 2562
- Boylan-Kolchin et al. (2011) Boylan-Kolchin M., Besla G., Hernquist L., 2011, MNRAS, 414, 1560
- Boylan-Kolchin et al. (2012) Boylan-Kolchin M., Bullock J. S., Kaplinghat M., 2012, MNRAS, 422, 1203
- Brainerd (2005) Brainerd T. G., 2005, ApJL, 628, L101
- Chabrier (2003) Chabrier G., 2003, ApJL, 586, L133
- Conroy et al. (2007) Conroy C., Prada F., Newman J. A., Croton D., Coil A. L., Conselice C. J., Cooper M. C., Davis M., Faber S. M., Gerke B. F., Guhathakurta P., Klypin A., Koo D. C., Yan R., 2007, ApJ, 654, 153
- Conroy & Wechsler (2009) Conroy C., Wechsler R. H., 2009, ApJ, 696, 620
- Erickson et al. (1999) Erickson L. K., Gottesman S. T., Hunter Jr. J. H., 1999, ApJ, 515, 153
- Ferrero et al. (2011) Ferrero I., Abadi M. G., Navarro J. F., Sales L. V., Gurovich S., 2011, ArXiv 1111.6609
- Gao et al. (2004) Gao L., White S. D. M., Jenkins A., Stoehr F., Springel V., 2004, MNRAS, 355, 819
- Geha et al. (2012) Geha M., Blanton M., Yan R., Tinker J., 2012, ArXiv 1206.3573
- Giocoli et al. (2008) Giocoli C., Tormen G., van den Bosch F. C., 2008, MNRAS, 386, 2135
- Guo et al. (2011) Guo Q., Cole S., Eke V., Frenk C., 2011, MNRAS, 417, 370
- Guo et al. (2011) Guo Q., White S., Boylan-Kolchin M., De Lucia G., Kauffmann G., Lemson G., Li C., Springel V., Weinmann S., 2011, MNRAS, 413, 101
- Guo et al. (2010) Guo Q., White S., Li C., Boylan-Kolchin M., 2010, MNRAS, 404, 1111
- Hayashi et al. (2003) Hayashi E., Navarro J. F., Taylor J. E., Stadel J., Quinn T., 2003, ApJ, 584, 541
- Kimm et al. (2009) Kimm T., Somerville R. S., Yi S. K., van den Bosch F. C., Salim S., Fontanot F., Monaco P., Mo H., Pasquali A., Rich R. M., Yang X., 2009, MNRAS, 394, 1131
- Klypin et al. (1999) Klypin A., Gottlöber S., Kravtsov A. V., Khokhlov A. M., 1999, ApJ, 516, 530
- Knebe et al. (2011) Knebe A., Knollmann S. R., Muldrew S. I., Pearce F. R., Aragon-Calvo M. A., Ascasibar Y., et al. 2011, MNRAS, 415, 2293
- Kravtsov (2010) Kravtsov A., 2010, Advances in Astronomy, 2010
- Kravtsov et al. (2004) Kravtsov A. V., Berlind A. A., Wechsler R. H., Klypin A. A., Gottlöber S., Allgood B., Primack J. R., 2004, ApJ, 609, 35
- Lares et al. (2011) Lares M., Lambas D. G., Domínguez M. J., 2011, AJ, 142, 13
- Leauthaud et al. (2011) Leauthaud A., Tinker J., Behroozi P. S., Busha M. T., Wechsler R. H., 2011, ApJ, 738, 45
- Liu et al. (2011) Liu L., Gerke B. F., Wechsler R. H., Behroozi P. S., Busha M. T., 2011, ApJ, 733, 62
- Lorrimer et al. (1994) Lorrimer S. J., Frenk C. S., Smith R. M., White S. D. M., Zaritsky D., 1994, MNRAS, 269, 696
- McKay et al. (2002) McKay T. A., Sheldon E. S., Johnston D., Grebel E. K., Prada F., Rix H.-W., Bahcall N. A., Brinkmann J., Csabai I., Fukugita M., Lamb D. Q., York D. G., 2002, ApJL, 571, L85
- Moore et al. (1999) Moore B., Ghigna S., Governato F., Lake G., Quinn T., Stadel J., Tozzi P., 1999, ApJL, 524, L19
- Moster et al. (2012) Moster B. P., Naab T., White S. D. M., 2012, ArXiv 1205.5807
- Moster et al. (2010) Moster B. P., Somerville R. S., Maulbetsch C., van den Bosch F. C., Macciò A. V., Naab T., Oser L., 2010, ApJ, 710, 903
- Nierenberg et al. (2011) Nierenberg A. M., Auger M. W., Treu T., Marshall P. J., Fassnacht C. D., 2011, ApJ, 731, 44
- Papastergis et al. (2011) Papastergis E., Martin A. M., Giovanelli R., Haynes M. P., 2011, ApJ, 739, 38
- Peñarrubia et al. (2008) Peñarrubia J., Navarro J. F., McConnachie A. W., 2008, ApJ, 673, 226
- Prada et al. (2003) Prada F., Vitvitska M., Klypin A., Holtzman J. A., Schlegel D. J., Grebel E. K., Rix H.-W., Brinkmann J., McKay T. A., Csabai I., 2003, ApJ, 598, 260
- Sales et al. (2007) Sales L. V., Navarro J. F., Abadi M. G., Steinmetz M., 2007, MNRAS, 379, 1464
- Shankar et al. (2006) Shankar F., Lapi A., Salucci P., De Zotti G., Danese L., 2006, ApJ, 643, 14
- Spergel et al. (2003) Spergel D. N., Verde L., Peiris H. V., Komatsu E., Nolta M. R., Bennett C. L., Halpern M., Hinshaw G., Jarosik N., Kogut A., Limon M., Meyer S. S., Page L., Tucker G. S., Weiland J. L., Wollack E., Wright E. L., 2003, ApJS, 148, 175
- Springel et al. (2001) Springel V., Yoshida N., White S. D. M., 2001, New Astronomy, 6, 79
- Strigari & Wechsler (2012) Strigari L. E., Wechsler R. H., 2012, ApJ, 749, 75
- Tormen et al. (1998) Tormen G., Diaferio A., Syer D., 1998, MNRAS, 299, 728
- Tully et al. (2006) Tully R. B., Rizzi L., Dolphin A. E., Karachentsev I. D., Karachentseva V. E., Makarov D. I., Makarova L., Sakai S., Shaya E. J., 2006, AJ, 132, 729
- Vale & Ostriker (2004) Vale A., Ostriker J. P., 2004, MNRAS, 353, 189
- van den Bosch et al. (2004) van den Bosch F. C., Norberg P., Mo H. J., Yang X., 2004, MNRAS, 352, 1302
- Wang et al. (2012) Wang J., Frenk C. S., Navarro J. F., Gao L., Sawala T., 2012, MNRAS, p. 3369
- Wang & Jing (2010) Wang L., Jing Y. P., 2010, MNRAS, 402, 1796
- Wang & White (2012) Wang W., White S. D. M., 2012, MNRAS, p. 3394
- Weinmann et al. (2006) Weinmann S. M., van den Bosch F. C., Yang X., Mo H. J., Croton D. J., Moore B., 2006, MNRAS, 372, 1161
- White & Rees (1978) White S. D. M., Rees M. J., 1978, MNRAS, 183, 341
- Wojtak & Mamon (2012) Wojtak R., Mamon G. A., 2012, ArXiv 1207.1647
- Yang et al. (2003) Yang X., Mo H. J., van den Bosch F. C., 2003, MNRAS, 339, 1057
- Yang et al. (2012) Yang X., Mo H. J., van den Bosch F. C., Zhang Y., Han J., 2012, ApJ, 752, 41
- Yang et al. (2011) Yang X., Mo H. J., Zhang Y., van den Bosch F. C., 2011, ApJ, 741, 13
- Zaritsky et al. (1997) Zaritsky D., Smith R., Frenk C., White S. D. M., 1997, ApJ, 478, 39
- Zheng et al. (2007) Zheng Z., Coil A. L., Zehavi I., 2007, ApJ, 667, 760
- Zwaan et al. (2010) Zwaan M. A., Meyer M. J., Staveley-Smith L., 2010, MNRAS, 403, 1969