Revealing the origin of the vertical hysteresis loop shifts in an exchange biased Co/YMnO3 bilayer
Abstract
We have investigated exchange bias effects in bilayers composed by the antiferromagnetic o-YMnO3 and ferromagnetic Co thin film by means of SQUID magnetometry, magnetoresistance, anisotropic magnetoresistance and planar Hall effect. The magnetization and magnetotransport properties show pronounced asymmetries in the field and magnetization axes of the field hysteresis loops. Both exchange bias parameters, the exchange bias field as well as the magnetization shift , vanish around the Néel temperature K. We show that the magnetization shift is also measured by a shift in the anisotropic magnetoresistance and planar Hall resistance having those a similar temperature dependence as the one obtained from magnetization measurements. Because the o-YMnO3 film is highly insulating, our results demonstrate that the shift originates at the interface within the ferromagnetic Co layer. To show that the main results obtained are general and not because of some special characteristics of the o-YMO3 layer, similar measurements were done in Co/CoO micro-wires. The transport and magnetization characterization of the micro-wires supports the main conclusion that these effects are related to the response of the ferromagnetic Co layer at the interface.
pacs:
75.60.-d,75.70.Cn1 Introduction
Exchange bias effects are observed when a ferromagnetic (FM) thin layer is in atomic contact with an antiferromagnetic (AFM) layer. These effects are therefore directly related to an exchange coupling at their interface. Experimentally, they are generally observed as a shift of the hysteresis loop on the field axis when the bilayer is cooled from a temperature below the Curie temperature of the FM layer but above the respective Néel temperature () of the AFM layer, to a temperature in the presence of an external magnetic field . While magnetometry studies of the exchange bias effect and its shift in the field axis [1, 2, 3] have been deeply performed since its discovery by Meiklejohn and Bean [4] when they investigated Co particles surrounded by their native antiferromagnetic oxide, there are a few comparative studies that used magnetotransport properties to elucidate exchange bias phenomena [5, 6, 7, 8, 9, 10]. Specially rare are the studies using the Hall effect [11]. Recently, however, the measurement of the exchange bias effects using the planar Hall effect has received considerable interest because of the higher signal-to-noise ratio compared with the magnetoresistance or spin valve configuration [12, 13, 14], a feature that might be promising for technology applications. On the other hand, the study of metal/oxide interfaces is a very attracting field that is gaining more relevance in the condensed matter community [15].
In the present work, we have investigated the exchange bias effects in a novel bilayer composed by a polycrystalline ferromagnetic (FM) Co film and a low temperature antiferromagnetic (AFM) oxide, namely o-YMnO3 film. A further aim of this work is to study the exchange bias effects using different properties namely, SQUID magnetometry, longitudinal magnetoresistance (MR), anisotropic magnetoresistance (AMR) and the planar Hall effect (PHE). Besides the usual field shift effect characterized by the exchange bias field , of particular interest was the study of the magnetization shift , an exchange bias effect much less study in the past probably because of the smaller signal amplitude and technical difficulties, although recent reports in special exchange bias systems [16, 17] already showed that its magnitude can be large. In this work we show that this magnetization shift not only can be systematically found in all measured properties but it has a similar temperature dependence as . The observation of these effects does not only support the existence of exchange bias in this system and its influence in both hysteresis loop axes, but it also demonstrates clearly that the magnetization shift is directly related to the pinning of magnetic entities (magnetic moments or domain walls) [18, 19] within the FM Co layer at the interface and not in the AFM layer, in agreement with magnetization measurements reported recently in La0.7Sr0.3MnO3/o-YMnO3 bilayers [16]. This main conclusion of this study was possible simply because the transport properties do detect only the FM film and not the AFM film due to its highly insulating state at the temperatures of the measurements.
Because the o-YMO3 layer is not a common AFM but a so called diluted antiferromagnet in external magnetic field (DAFF), as will become clear in section 3.2.1, we decided to characterize both exchange bias effects, i.e. in the field as well as in the magnetization axis, in the archetype of exchange bias effects, namely in Co/CoO micro-wires. Our transport as well as magnetization characterization of the exchange bias effects not only agree each other but supports the main conclusion we get from the studies on the Co/o-YMO3 bilayers, namely that the observed effects originate within the ferromagnetic Co layer, certainly due to the influence of the AFM layer at the interface. This was possible to conclude because of the negligible conductance of the CoO layer in comparison with that of Co. In this case the magnetoresistance measurements probe the FM Co layer and therefore may also contribute to the understanding of the FM depth profile[20].
2 Experimental Details
We prepared bilayers of FM Co thin films (selected for its weak anisotropy and small coercivity) covering an AFM orthorhombic o-YMnO3 (o-YMO) layer grown on (100) SrTiO3 substrates of area mm2. For the depositions of the o-YMO layer a KrF excimer laser (wavelength 248 nm, pulse duration 25 ns) was used. The growth parameters used for o-YMO were 1.7 J/cm2 with 5 Hz repetition rate, C substrate temperature and 0.10 mbar oxygen pressure during preparation. The thickness of the o-YMO film for the bilayer discussed in this report was 350 nm. The Co films were prepared by thermal evaporation under high vacuum (pressure mbar) using a high purity Co (99,95%) precursor material. For the magnetization measurements we used a superconducting quantum interferometer device (SQUID) from Quantum Design. The substrate containing the AFM o-YMO layer was covered completely with 35 nm Co thin film. For the magneto-transport measurements we used a mask with defined shape to be able to measure the longitudinal and Hall resistances, see inset in Fig.6(b). These measurements were carried out immediately after the Co deposition and contacting the corresponding electrodes in a chip carrier.
The epitaxial growth of the o-YMO phase was confirmed by X-ray diffraction. The electrical transport measurements of the bilayer (at the temperature of the measurements the electrical transport is due only to the Co film) were performed with a high resolution AC bridge (LR700 from Linear Research) in a commercial cryostat in the temperature range between 5 K and 300 K with magnetic fields up to 4 T. The resistance of the highly resistive o-YMO film was measured using a Keithley 6517A electrometer. During the measurements, the temperature stability was better than 10 mK. A commercial Hall sensor and a resistance thermometer attached close to the sample were used to measure the magnetic field and temperature. The exchange bias effects were studied with the SQUID and magneto-transport under similar experimental conditions. Namely, the sample was heated up to 100 K and a selected field was applied parallel to the main area of the sample. Then the sample was cooled down under this field to the selected temperature of the measurements. After the temperature was stabilized, the field was swept in opposite direction and turned back to the initial field. This process was repeated for each selected temperature. A systematic study of the influence of the amplitude of the field used to prepare the field cooled state showed that the effects of minor loops, as for example any dependence of the coercive field, are negligible at T. As was shown already in Ref. [16] for other bilayer exchange bias systems, the observed exchange bias effects reported here cannot be attributed to minor loop effects.
Cobalt thin films ( nm thickness) were deposited by thermal PVD at a base pressure of 10-7mbar on a commercial 5 5 mm2 p-boron doped silicon (100) substrates, capped with a 150nm Si3N4 layer. The cobalt micro-wires were produced using electron beam lithography (EBL) in a FEI NanoLab XT 200 Dual Beam microscope with a Raith ELPHY Plus extension at 10KV acceleration voltage. For the lithography process a commercial positive-working PMMA (950K) spin-coated on the substrates with a thickness of about 400 nm was used. The samples were prepared in up to three lithography processes. First the structure for the electrical contacts was written, which was sputtered in Ar atmosphere with a 5-10nm Pt/15-25nm Au bilayer. The base pressure of the vacuum chamber was 10-6mbar, while the working pressure of the Ar sputter gas was 10-3 mbar. After lift-off and a new resist cover, the structures for the Co nanowires were written. In this paper we present the results of two Co/CoO samples, a single micro-wire of dimension (length between voltage electrodes width) m m, and an array of 8,500 micro-wires for the magnetization measurements (length 50m, 1m width), with a spacing of 20m to avoid interaction. The surface of the deposited cobalt films was analyzed ex situ by AFM measurements. The crystallite size ranges from 25 nm to 40 nm; the surface roughness is rather small with a peak to peak height variation smaller than 4 nm. The measurements of the samples were done after leaving them two months in normal atmosphere for the formation of a natural, nm thick oxide film at the Co free surface.
The temperature dependence of the resistivity showed a linear behavior as one expects for a metal. Below 50 K a quadratic temperature dependence dominates. The residual resistivity ratio (300K)/(4K) is rather small () indicating that the nanowires are highly disordered. From the residual resistivity (4K) cm we calculated the mean free path nm 8 nm (using the simple Drude formula , with ), a factor of five smaller than the observed grain size. The temperature dependent resistivity (300K)-(4K) cm is quite close to the literature values [21] giving 10.3cm in c-direction and 5.5cm in the perpendicular plane resulting in 7.1cm for a polycrystalline sample as is our case. This and the consistency throughout all of our samples indicate the good quality of the deposited material.
3 Results and discussion
3.1 X-ray characterization
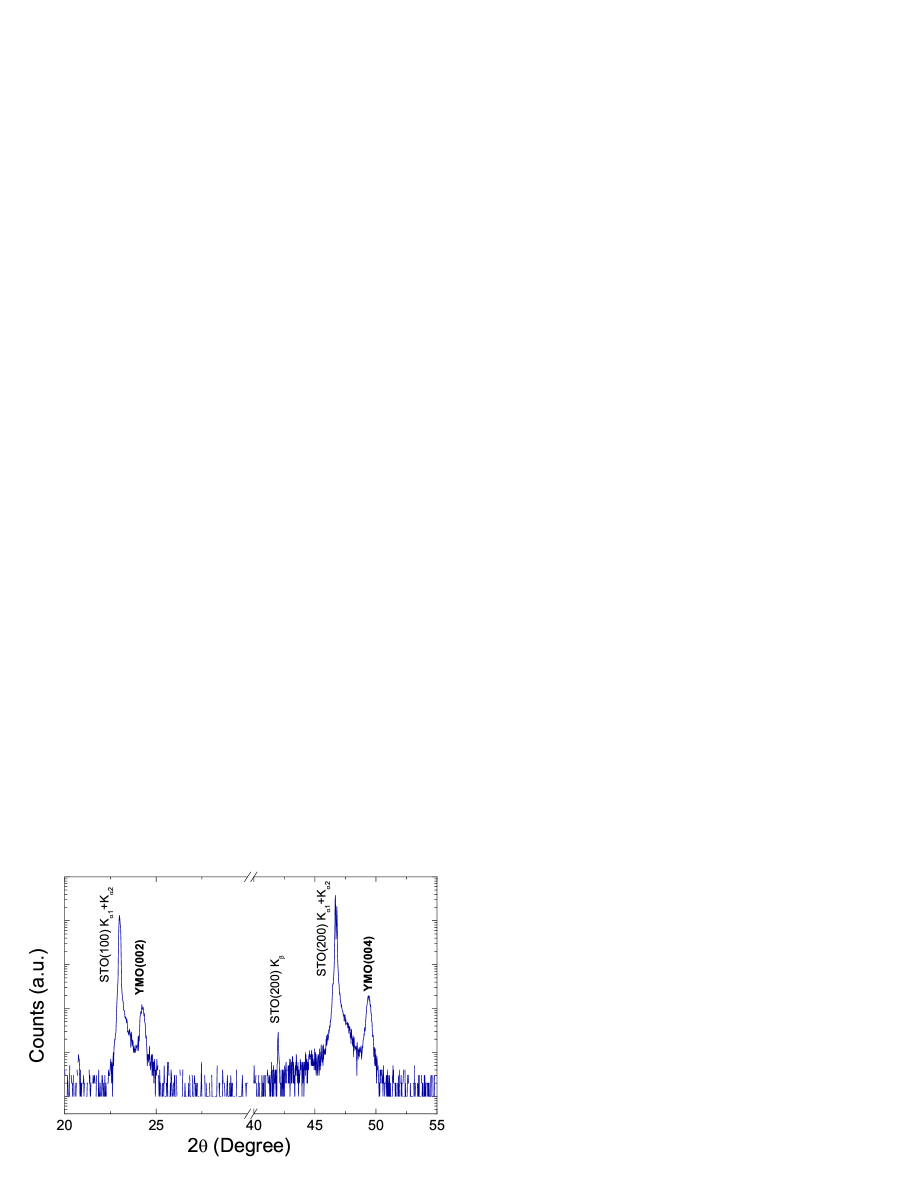
The manganite of yttrium (bulk) usually has a hexagonal structure [22] but under high pressure and temperature it is transformed in the metastable orthorhombic phase [23, 24]. This energetically unfavorable phase in standard conditions can be reached in thin films if it grows pseudomorphic with the substrate [25]; in this case it can present different crystal domain structures and lattice strains [26]. We have prepared stable orthorhombic phase of YMO (o-YMO) epitaxially grown thin films on oriented (100) SrTiO3 (STO) substrates by pulsed laser deposition, as has been reported earlier [27]. The phase of our prepared YMO samples was confirmed by X-ray diffraction using Cu-Kα line, see Fig. 1. The preferential growth of the (00l) planes is evident and corresponds to the orthorhombic YMO phase [27, 28]. According to our experimental resolution our film is purely orthorhombic but the presence of grain boundaries or certain texture should not be discarded. From the position peaks in the -scan, the out-of-plane lattice parameter is , in good agreement with literature data [27, 28]. The peaks corresponding to the STO substrate are also present, see Fig. 1.
3.2 SQUID Magnetometry
3.2.1 Single o-YMnO3 layer
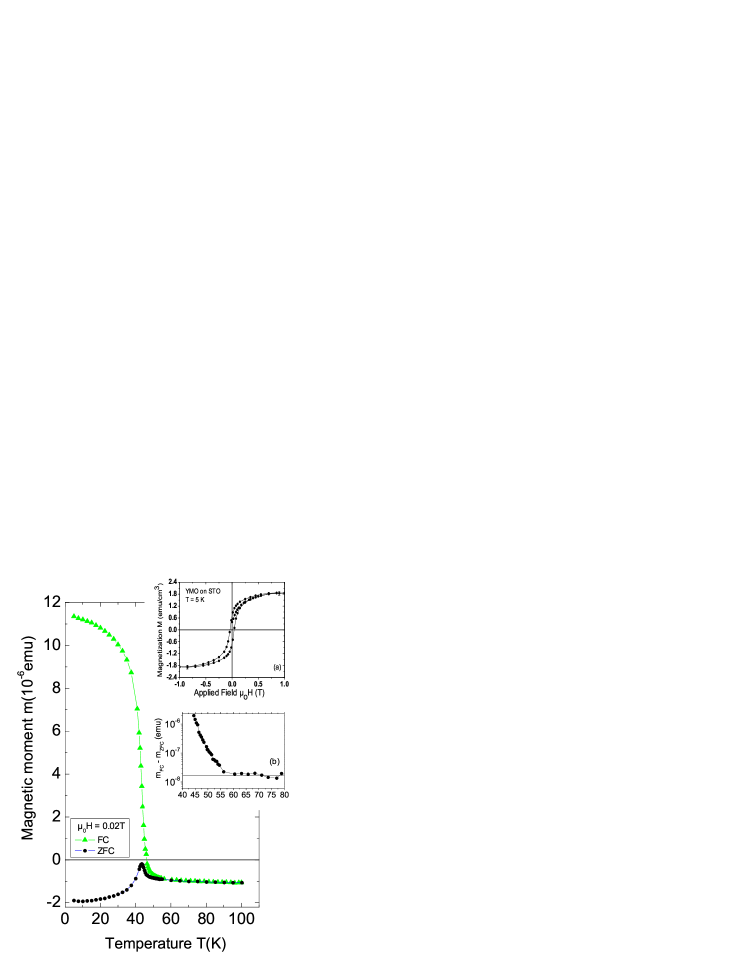
According to literature [29, 30] the o-YMO phase is AFM with Néel temperature K. In Fig. 2 we show the magnetic moment of a o-YMO thin film measured on warming after zero-field cooling (ZFC) and field cooling (FC) with an applied field mT. From the ZFC state we recognize a typical antiferromagnetic behavior. If we define the characteristic Néel temperature where the ZFC magnetic moment shows a maximum we obtain K from the data in Fig. 2. If we define , however, at the onset of a significant difference in magnetic moment between the FC and ZFC states K, see inset (b) in Fig. 2. It is also known that AFM fluctuations of the order parameter are established above[31] the actual , overestimating in this way the value extracted from SQUID measurements. Whether the lowest or the upper temperature is the one where the exchange bias effects vanish, it will depend on the used experimental method and its sensitivity.
The behavior observed in the FC state, see Fig. 2, as well as in previous studies of o-YMO thin films [16], resembles that of diluted antiferromagnets in external magnetic field (DAFF). This suggests us to consider the domain state model (DS) [32, 33, 34, 35, 36] to describe the physical behavior of o-YMO films. It is well known that DAFF develop a domain state when cooled below (sometimes showing a spin-glasslike behavior [37]) that leads to a net magnetization which couples to the external field. The work in Ref. [33] has demonstrated the broad range of applicability of this model, being possible to use it not only for single crystalline AFM, but also for any deviation of the perfect crystalline structure of the AFM, such as punctual defects, grain or twin boundaries. In particular, it has been applied in the exchanged-bias Co/Co1-yO bilayer, where the Co1-yO AFM layer presents crystallite sizes between and nm. Finally, it is important to note that the magnetic moment at saturation of our YMO film in the FC state is orders of magnitude smaller than that of the Co film. The inset (a) in Fig. 2 shows the hysteresis loop of the magnetization of the YMO single layer at 5 K, a loop characteristic of an AFM, being symmetric and without any vertical or horizontal shift. The magnetic moment at saturation and at 5 K is equal to 23 emu. This means that the magnetic moment ratio at saturation between the FM and AFM layers for the bilayer sample is . The tendency to saturation of at a field of only 0.02 T shown in Fig. 2 is also typical for conventional DAFF materials.
Taking into account the results on the Co/CoO micro-wires we present below in section 4 we believe that a further discussion on whether our thin o-YMnO3 layer behaves or not as a typical DAFF or whether this material is what we have at the interface with the layer Co, does not appear to us relevant, as will become clear after the presentation and discussion of the main results.
3.2.2 Bilayer Co/o-YMnO3
It is well known that the exchange bias corresponds to an exchange field transferred from the surface of the AFM into the FM, but its direction depends on the type of exchange coupling at the interface between the FM and AFM layers [36, 38]. Upon the magnetic characteristics of the layers material used (and in some cases also on the intensity of the applied field [39]) it is possible to found negative (usual case) as well as positive exchange bias [40] if the shift of the hysteresis loop along the field axis is in the opposite or same direction as the applied field, respectively. On the other hand, a vertical (magnetization) shift is observed if a number of frozen magnetic moments in one of the layers at the interface remains uncompensated due to the proximity to the other layer. Their orientation can be parallel or antiparallel with respect to the FM layer generating in this way a shift upwards of the hysteresis loops in case of a direct exchange or a shift downward in case of an indirect exchange mechanism [36, 41].
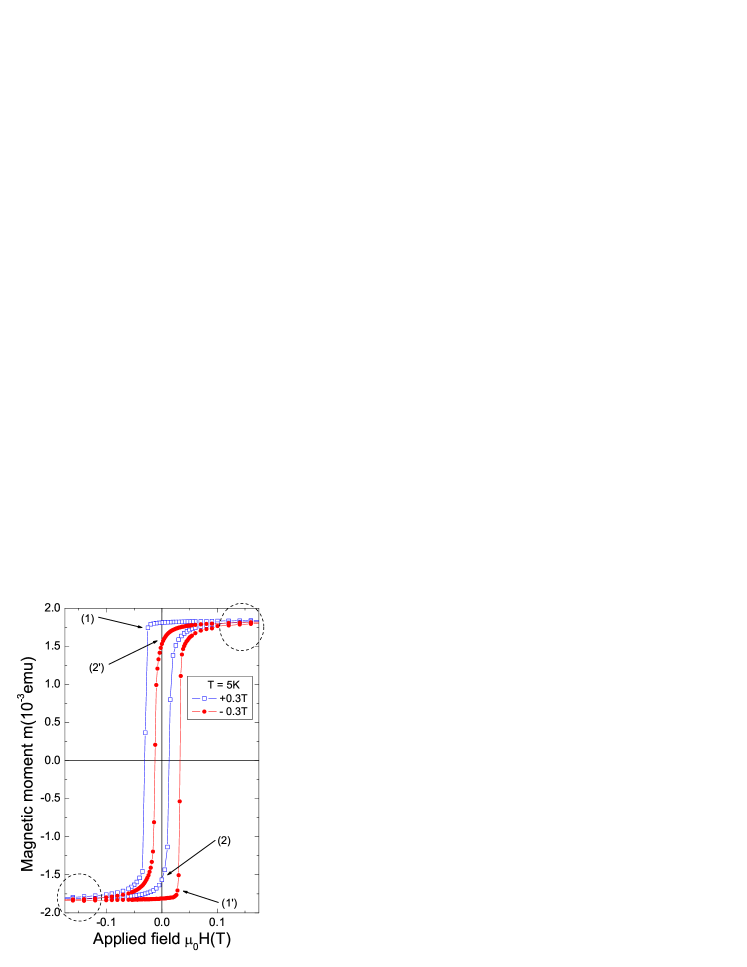
In order to corroborate the existence of the above described effects in our bilayer we have measured it by cooling with positive and negative magnetic fields (T). The results obtained at K are shown in Fig. 3. The shift in the magnetic field axis is clearly observed. We use the phenomenological definition for the strength of this effect characterized by the “exchange bias field” defined as , where and are the coercive fields at positive and negative fields. In Fig. 3 we observe that the expected hysteresis shift depends on the sign of the . Within experimental resolution the absolute value of KmT is similar for both directions of .
The hysteresis loops show an asymmetry near the coercive fields where a change in the magnetization direction occurs. When the field is swept in the opposite direction as the one of , the magnetization remains constant up to the coercive field (positions (1) and (1’) in Fig. 3) before a sudden change in the magnetic moment occurs. After reaching the saturation and reversing the field to the initial value, the magnetization curve remains nearly constant till the other coercive field is reached where the magnetic moment shows a rounded edge (arrows 2 and 2’). This asymmetric behavior in the magnetization is already known and it may have two different origins in an exchange bias system. One of them is related to a stable interface without training effect producing asymmetries explained in terms of a competition between magnetic field orientation, ferromagnetic and exchange-bias anisotropies [42]. The other one is intimately related to irreversible changes of the domain structure during the magnetization reversal, i.e. a training effect found in CoO/Co bilayers [43, 44, 45], for example. It is directly linked to a change in the magnetization reversal mechanism as a consequence of domain wall nucleation, domain wall propagation and rotation of the magnetization of the domains [35], i.e. an origin directly related to the ferromagnetic layer influenced by the interface. Although we do not present a direct study of training effects, the similarities of the observed asymmetries in the field loops in the magnetoresistance, a property directly related to the Co layer only, see Fig. 12(a), suggest that the observed asymmetry features have the same origin as in Co/CoO bilayers [43, 44, 45].
A detailed inspection of the data in Fig. 3 reveals a small but systematic shift in the magnetic moment axis. This shift (at the regions within the dashed circles in Fig. 3) depends on the field direction used during the cooling process. In order to quantify the effect we define the magnetic moment shift as , where and are the saturation moments at certain positive and negative fixed fields with the same absolute value. Our experimental setup for magnetic moment measurements uses a home developed sample holder [46], which allows a reproducibility and sensitivity of emu at a field of 1 T. At the field of T the reproducibility is of the order of emu. From the data in Fig. 3 we obtain at K a emu at T (see Fig. 5), nearly two orders of magnitude larger than our resolution and reproducibility limits. Note that this magnetic moment shift is huge, compared with the total magnetic moment at saturation of the AFM layer alone. In fact and taking the magnetization of the YMO layer alone, see inset (a) in Fig. 2, the total magnetic moment at saturation of the YMO layer is emu. The observed emu would mean that about 135 nm YMO thick layer should contribute to the shift, a value obviously much larger than the expected exchange bias interface thickness. On the other hand magnetization loops of the YMO alone at different cooling fields show hysteresis loops without any vertical or horizontal shifts. Therefore, the origin of the effect should not be in the YMO but in the Co layer at the interface, as the transport measurements also indicate.
The effect in our bilayer can be interpreted as follows. After field cooling in an external field and due to the presence of the interfacial exchange field of the ferromagnetic layer, the AFM layer develops a frozen domain state that controls the exchange bias and the magnetic domains within the FM/AFM interface layer producing an irreversible surplus of magnetization at the FM side, as the experimental results indicate and in agreement with observations on La0.7Sr0.3MnO3/o-YMnO3 and La0.67Ca0.33MnO3/o-YMnO3 bilayers [16]. The formation and number of the domains within the FM Co layer that take part in the exchange bias coupling with the AFM layer can be enhanced leading to an increase of . Therefore, the measured can be easily explained by pinned moments (or magnetic domains by domain wall pinning) within the FM layer at the interface, i.e. a pinned thickness of the order of 0.2 nm Co layer would be enough to produce the observed .
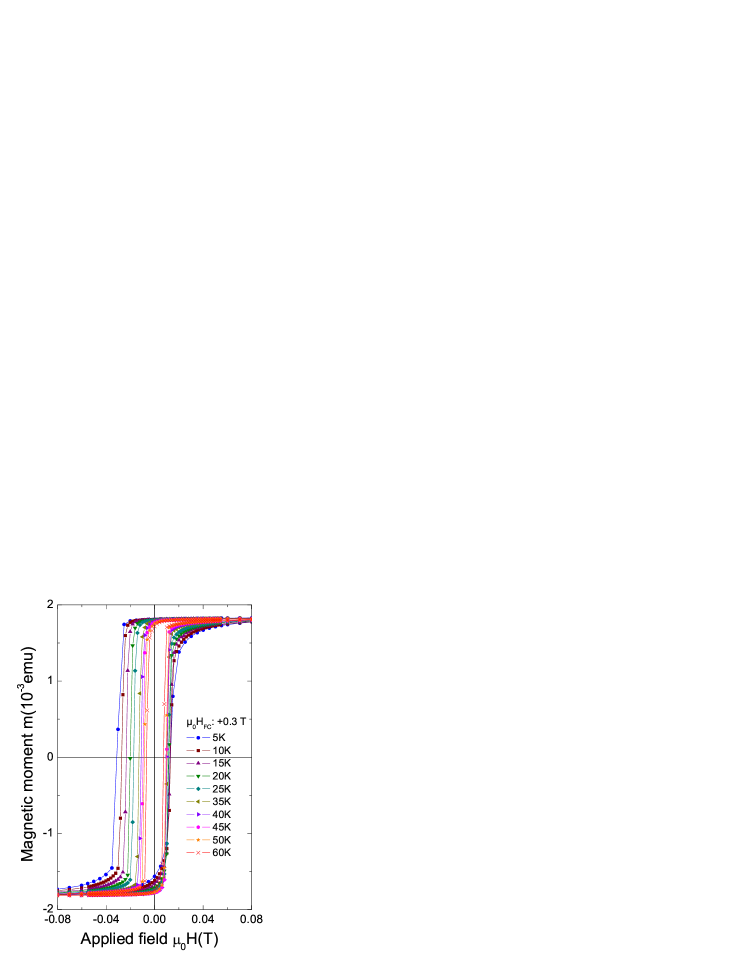
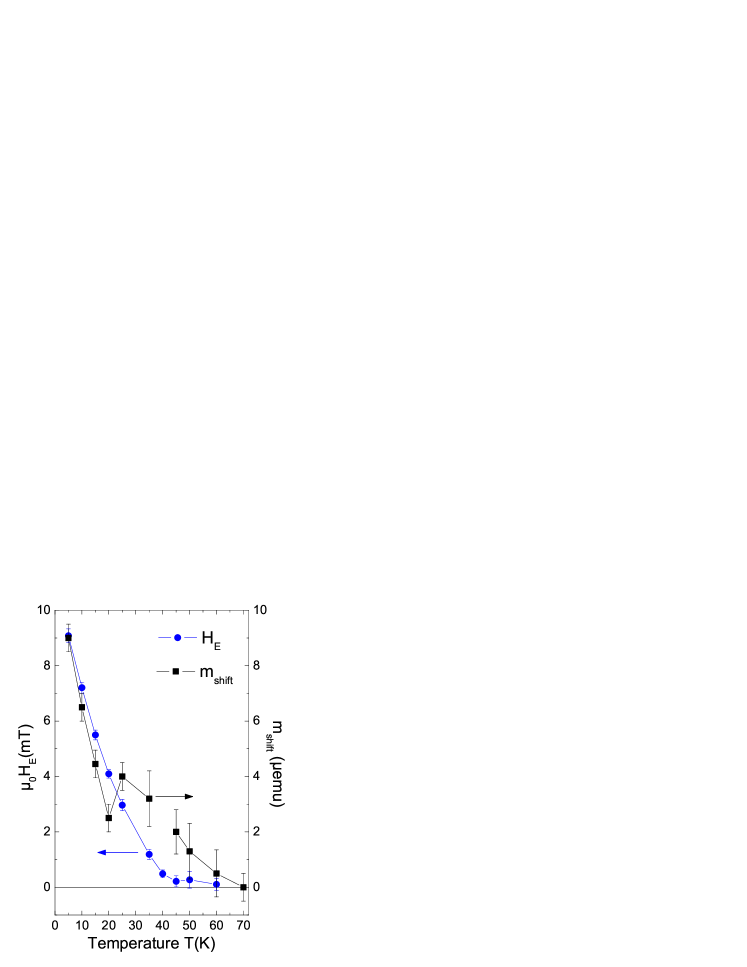
Figure 4 shows all the performed SQUID measurements at different temperatures when the sample was cooled with a positive . The exchange bias field as well as the vertical shift in the magnetic moment obtained from the data in Fig. 4 are shown as a function of temperature in Fig. 5. These two quantities vanish between 45 K and 60 K, near the onset of the AFM transition, see Fig. 2, indicating that the measured effects should be a result of the exchange bias effect. At K the exchange bias field follows , where K is a kind of blocking temperature in general lower than the Néel temperature [1]. This linear dependence in has also been observed in bilayer systems like FeO/Fe, CoO/Co and NiO/Ni [1] and theoretically predicted assuming a cubic anisotropy for the AFM material [47]. Note that the first sudden change in the magnetization (at (1) in Fig. 3) begins to be rounded when the temperature approaches , see Fig. 4, as a consequence of the weakening of the exchange coupling when the temperature increases. We note that both parameters and show a similar – but not identical – temperature dependence, see Fig. 5. In particular there is a clear change of slopes at K and K in , which is not observed in within the resolution of the experiment. This anomaly in the temperature dependence is related very probably to the ferroelectric transition of o-YMO observed at K [29, 30].
3.3 Magneto-transport measurements
In our bilayer the o-YMO layer deposited on STO serves as a dielectric substrate allowing us to measure the transport properties of the structured Co film deposited on the top. In order to warranty that the resistance contribution of the o-YMO layer is negligible compared to the Co layer, we have characterized similar YMO films using an electrometer with an upper resistance limit of . The corresponding results are plotted in Fig. 6(a). The resistance of the o-YMO layer of similar thickness and area as the one used for the bilayer, shows a resistance of M at 290 K, in contrast to the resistance of the Co layer, see Fig. 6(b). The increase in the resistance of the o-YMO layer decreasing temperature is huge and for K the resistance is larger than the maximum we can measure. The resistance of the o-YMO film follows a variable range hopping (VRH) behavior given by the Efros-Shklovskii VRH dependence [48], as the inset in Fig. 6(a) indicates. The small deviation at low temperatures is an artifact due to the upper limit of the electrometer. Consequently, especially for temperatures K the o-YMO layer behaves as an insulator in comparison to the resistance of the Co layer, giving us the possibility to explore the exchange-bias effects using magneto-transport properties that provide us direct information about the magnetic behavior of the FM layer and the influence of the exchange coupling of the AFM layer on it.
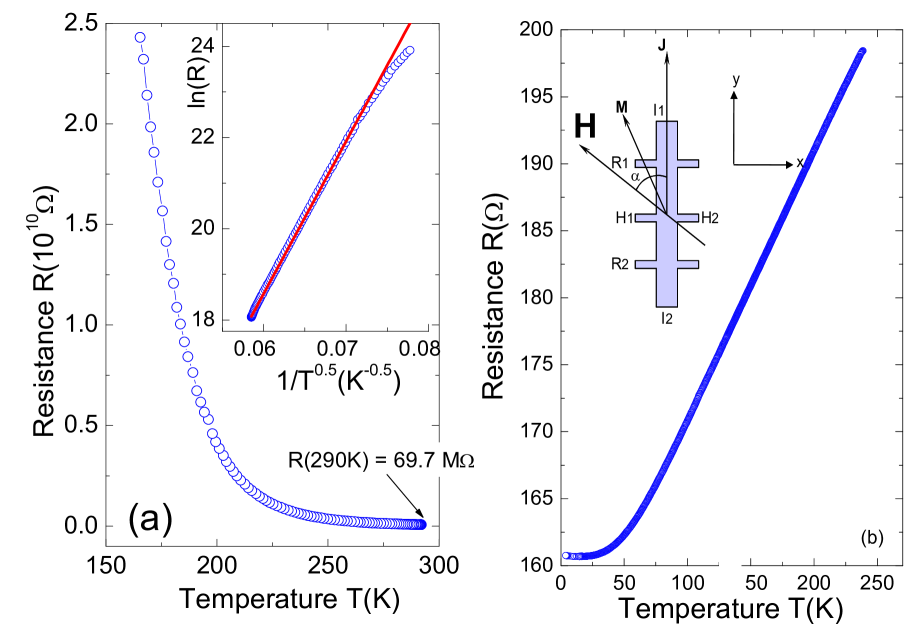
Figure 6(b) shows the temperature dependence of the resistance of the Co film deposited on the top of the o-YMO film. As expected, the observed behavior is typical for polycrystalline metallic Co in agreement with reported data [49]. The inset in this figure shows a sketch of the patterning of the Co sample used in this measurement and the magnetic field and electrical current directions.
Our experimental setup allows us to perform angular dependent measurements changing the angle , see Fig. 6(b), from to . It is known that magneto-electrical transport measurements on conducting ferromagnets can provide information about their magnetic properties, as, e.g., the transition temperature, the easy axis direction, the coercivity, etc. We have measured the so called anisotropic magnetoresistance (AMR) and the planar Hall effect (PHE). The experimental conditions for such measurements are similar to the classical magnetoresistance (MR) and Hall effect, but the magnetic field H is applied parallel to the sample main plane formed by x and y (see Fig. 6(b)). For this field direction the AMR is the resistance measured between electrode R1 and R2 of Fig. 6(b)), and the PHE is the voltage measured between electrodes H1 and H2 of Fig. 6(b). Assuming a single-domain model, the AMR as a function of the angle is given by
| (1) |
and the PHE is
| (2) |
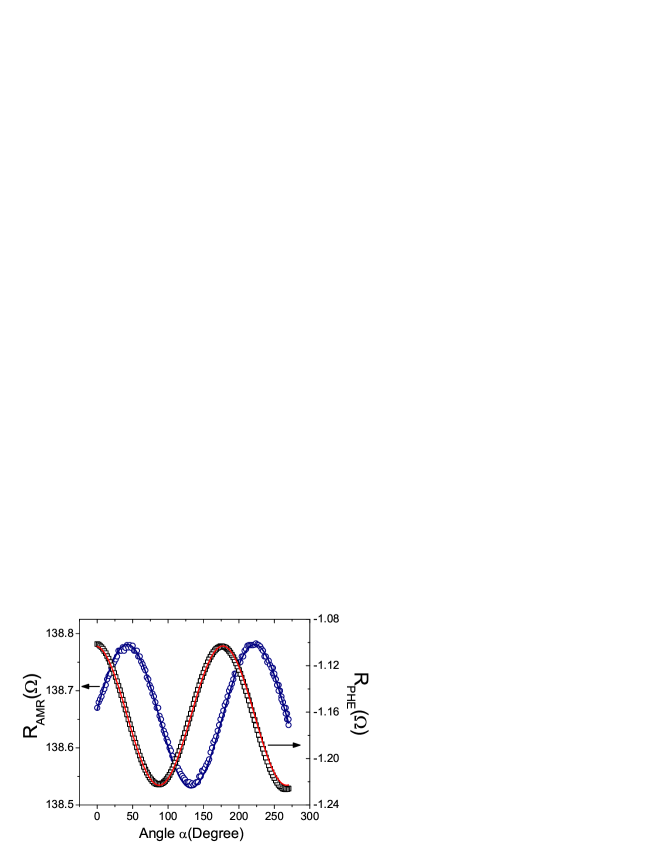
where and are the resistances when the magnetization is parallel and perpendicular to the current, respectively. The difference between and is the origin for the anisotropic magnetoresistance and the planar Hall effect. Figure 7 shows the AMR and PHE at room temperature as a function of the angle . The good fits using the above equations confirm the single-domain model assumption at the applied field. Due to the large value of , one can realize that the relative change in the PHE is larger than the one of AMR, making the first one a more sensitive tool to study magnetic effects produced by the exchange bias.
We have performed the PHE measurements in a ZFC state at different constant temperatures, i.e. above and below , and the angular dependent measurements cycling from to and back to . At temperatures above K the results follow Eq. (2), see Fig. 8, while below K a hysteresis is observed although there is no difference between the initial and final values within experimental resolution. This reversibility of the initial and final values after cycling the field remains also at different applied fields as Fig. 9 shows. From these results we conclude that independently of the applied field, starting always from a ZFC state, there is no irreversibility between the initial and final values of the PHE after cycling the angle. The hysteresis observed at angles is a natural consequence of the cobalt ferromagnetic hysteresis.
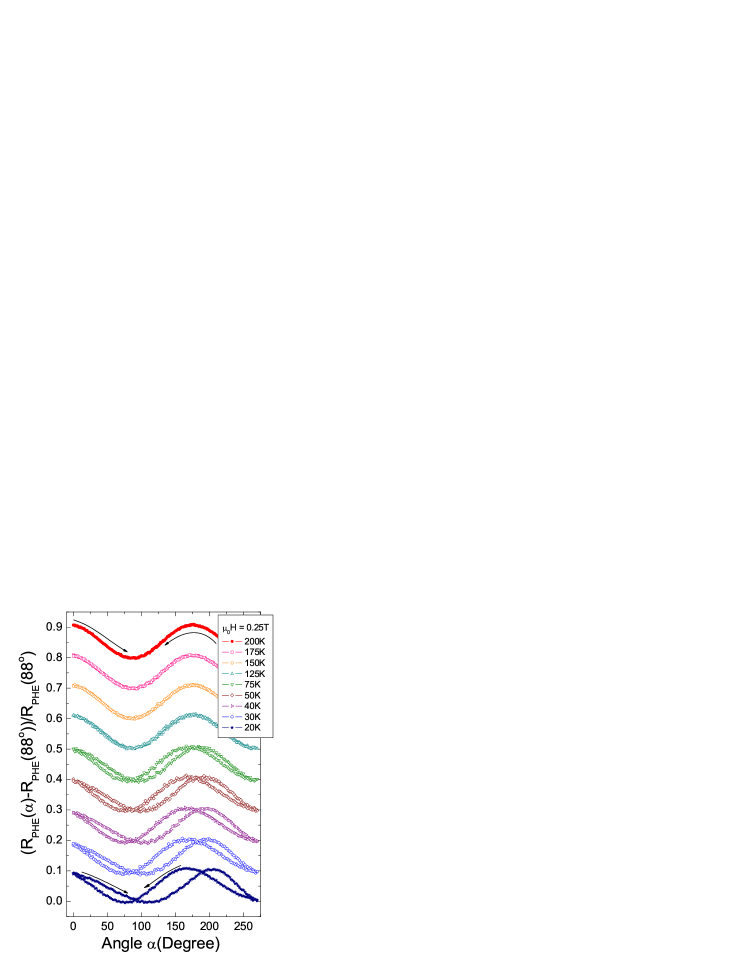
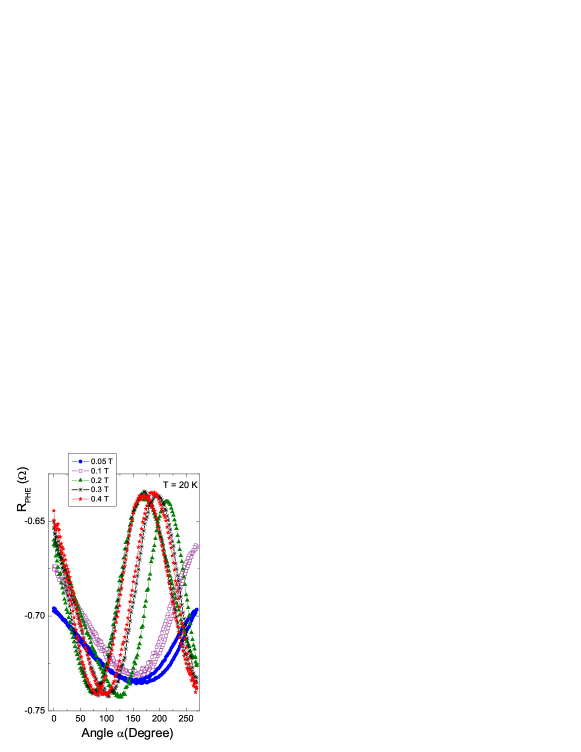
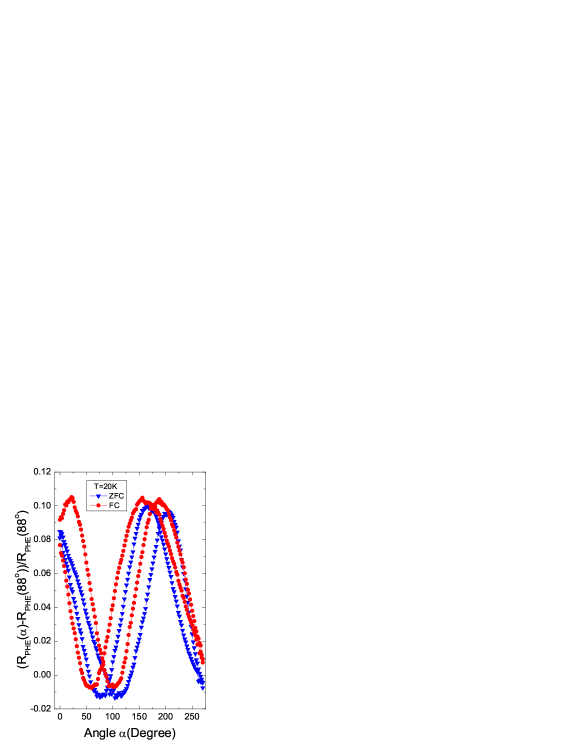
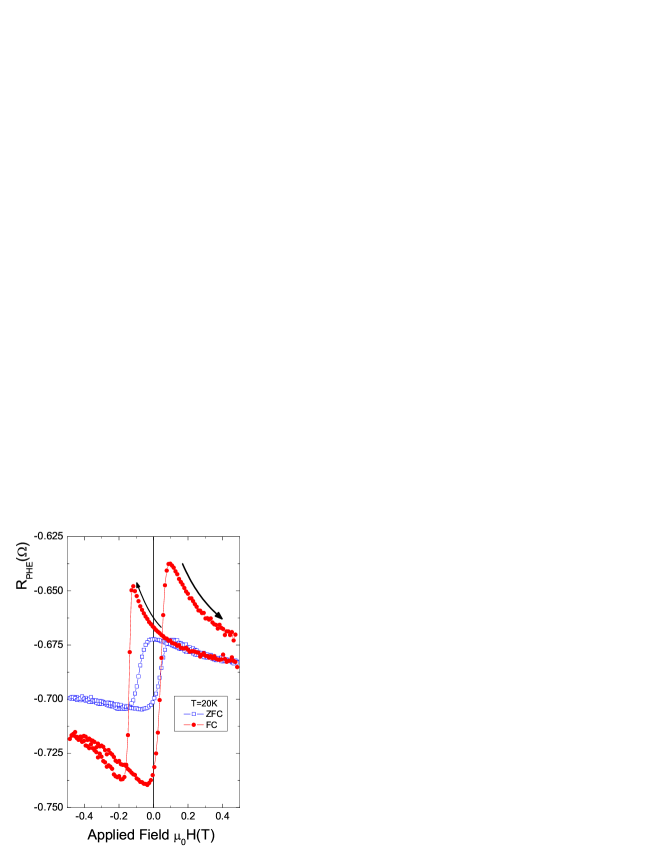
Figure 10 shows PHE measurements in the FC state where it becomes evident that after a cycle the PHE resistance at the end of the cycle is not the same, i.e. a clear PHE-shift appears at the end of the loop in clear contrast to the ZFC measurements. On the other hand, the hysteresis observed at angles in ZFC is also present in the FC state. Consequently, this hysteretic feature, the PHE-shift at the end of cycle, should be directly related to an exchange bias effect. After this experimental observation we have fixed the angle such that M was parallel to the main axis of the sample and performed a field dependent measurement of the PHE at FC and ZFC states, see Fig. 11. We found open and close hysteretic loops for the FC and ZFC state, respectively, in good agreement with the results of Fig. 10. For a fixed magnetic field value, see Fig. 11, the PHE resistance increases in the FC state indicating that it is highly sensitive to the exchange bias effects due to pinned magnetic moments or domains at the interface. These results are compatible with a scenario where an interfacial domain structure is present in the ferromagnetic Co layer [35, 45].
These results suggest us to use the transport properties to investigate the exchange-bias effect, as a way to strengthen the interpretation of the magnetization measurements done with the SQUID. Similar to the SQUID measurements shown in Fig. 3, Fig. 12 shows the MR and PHE measurements at two different temperatures and after cooling the sample with a positive and negative magnetic field of T. We observe that after the first reversal process (arrows (1) and (1’)) the MR shows a sharp change, while in the second reversal process (arrows (2) and (2’)) the change is more rounded and larger in amplitude compared to the first one. This indicates that during the first magnetization reversal there are less moments contributing to the magnetization rotation compared to the subsequent reversal process [45]. The field shifting and asymmetries observed in the MR and PHE are in agreement with the ones observed in the SQUID measurements indicating that the same effects (domain wall propagation and nucleation) contribute in a similar manner in these properties. In both kinds of measurements, we observe that at the fields of, e.g. +0.5 T or -0.5 T, the initial and final values are not the same, i.e. the MR and PHE show a clear irreversible behavior after completing the field cycle. This irreversibility is more evident in the PHE compared to the AMR results, and both strengthen the existence of the effect measured with the SQUID.
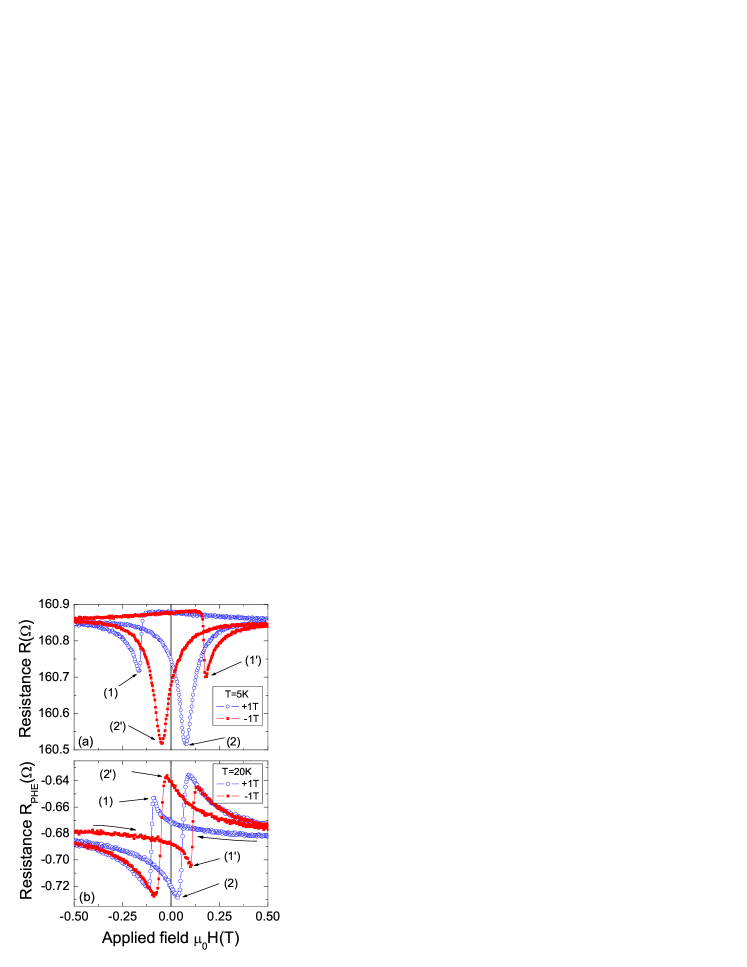
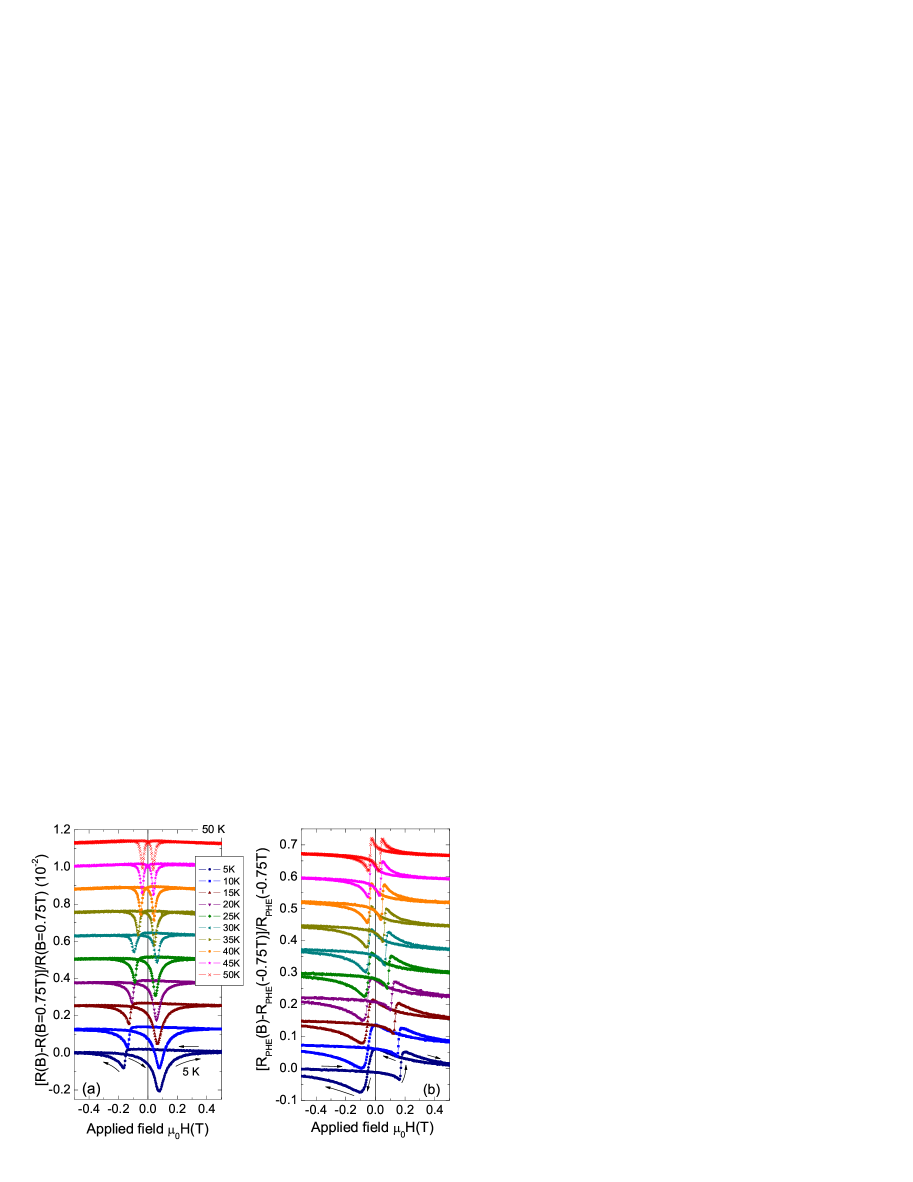
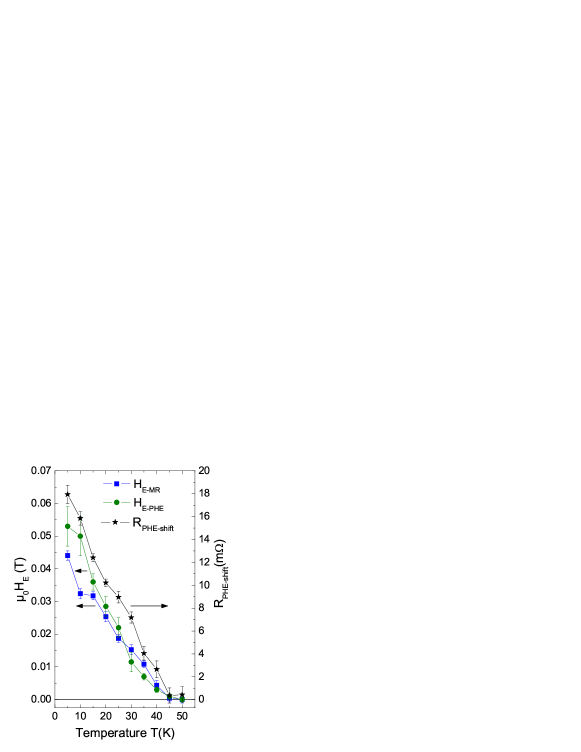
Figure 13 shows the results obtained for the MR and the PHE as a function of applied field at cooling fields T at different constant temperatures. The exchange bias effects are manifested in: - the field and saturation asymmetries, - the different shape at the fields where the magnetization direction changes, and - by the smearing of these characteristics increasing temperature and their vanishing at or just above the Néel temperature. Assuming that the two minima in the MR and the sharp steps in the PHE define the coercive fields, we apply a similar definition as before to estimate the exchange bias field from these two properties and . The temperature dependence of these exchange fields are shown in Fig. 14. The nearly linear behavior agrees with that obtained from the SQUID measurements, see Fig. 5. Note that the absolute values obtained from the transport data (Fig. 14) are larger than for the SQUID data (Fig. 5) just because we compare data obtained at different .
The analogous to the magnetic moment shift observed in the SQUID measurement appears also in the MR and PHR measurements, i.e. an irreversibility in the resistance or Hall resistance at the same field after completing a field cycle. As in the case of magnetization measurements, we quantify this irreversibility by the definition, in case of the PHE shift, T) T), where T) means the planar Hall resistance at -0.4 T increasing field from T and T) the value obtained at the same field but coming from positive fields. Figure 14 shows the obtained temperature dependence of the parameter . From the comparison with , it is reasonable to assume that the origin of the exchange bias parameter is the same as the from SQUID measurements and should be directly correlated with the pinning of domains or magnetic moments of the FM Co layer due to its common interface with the AFM layer. We stress that although the measured transport properties provide information only of the Co layer, it is clear that all exchange bias effects are related to the influence of the AFM layer on the Co layer at the interface.
Note that does appear to show slight changes of slope at 30 K and 20 K, which may be related to the ferroelectric transition of the o-YMO layer, although they are not as clear as for the obtained from the SQUID measurements. This difference between the temperature dependence of these two quantities, and , is related to the different used and in part to the field we used to calculate . Note that the dependence of the is non monotonous, i.e. for as well as at , as has been shown for LaMnO3/o-YMO bilayers [16].
4 Magneto-transport and SQUID measurements of the Co/CoO wires
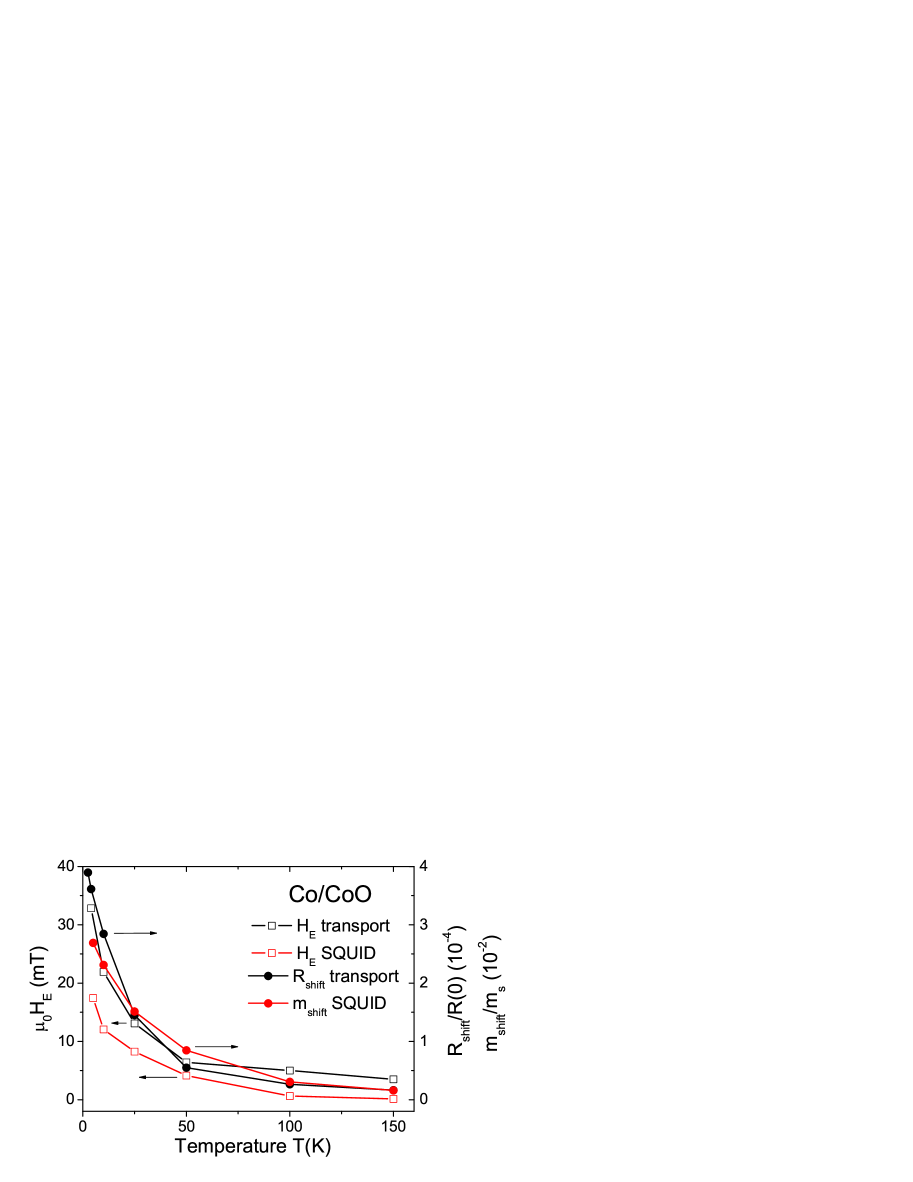
The exchange bias effects of the array of 8,500 micro-wires were measured with a SQUID. For the FC measurements the sample was mounted in the SQUID after the corresponding was applied. These measurements reveal shifts in both axis of the hysteresis, similar to that shown in Fig. 3 for the Co/YMO bilayer and we do not need to show them here. Figure 15 shows the temperature dependence of the exchange bias field defined as before and the magnetization shift (-effect) normalized by its value at saturation. The vertical magnetic moment shift is defined as before and at 0.1 T. One can clearly recognize in Fig. 15 that both exchange bias effects (red symbols) show a similar temperature dependence.
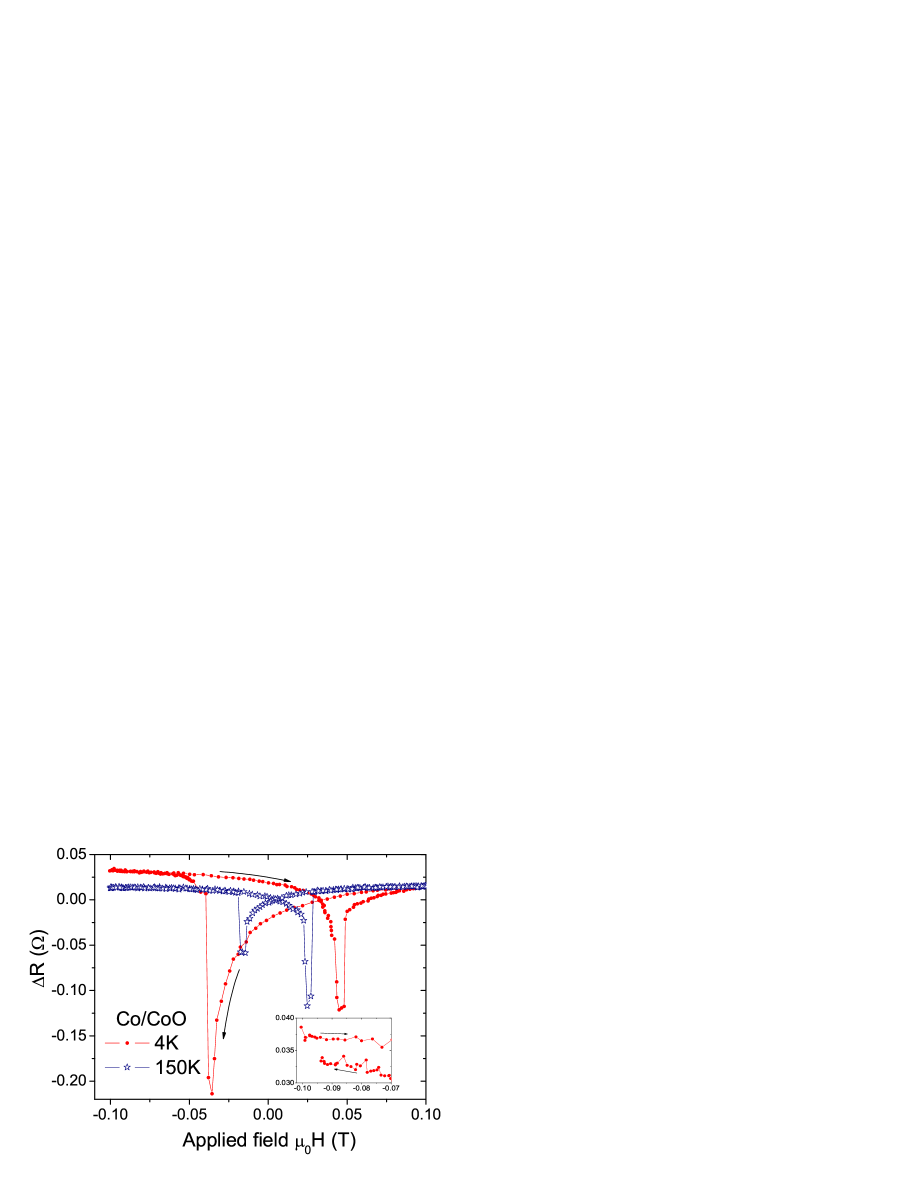
A typical hysteresis in the magnetoresistance of a single Co/CoO micro-wire is shown in Fig. 16 after cooling the sample in a field of -8 T at two different temperatures. The asymmetry in the coercive field (at the minima) as well as in the saturation region TT) can be clearly recognized in the figure at 4 K, similarly to the one obtained for the bilayer Co/YMO, see Fig. 12(a). The red curve at 4K shown in the main panel is the hysteresis measured the second time after one cycle to +0.1 T T. In the inset we show the irreversibility in the resistance after the first hysteresis, similar to the irreversibility measured in the Co-YMO bilayer, see Fig. 12(a). The two exchange bias effects obtained from transport measurements of a single micro-wire show similar temperature dependence between each other and to the SQUID results, see Fig. 15. In our samples the exchange bias effects vanish at about 150 K. This may be due to the small thickness of the AF CoO layer. A blocking temperature in this range has been reported for equally thin layers [50]. We think that the results in Co/CoO micro-wires leave little doubt about the existence of both exchange bias effects. Because of the negligible conductance of the oxide layer in comparison with the Co part at the temperature of the measurements, the transport results also indicate that the origin of the magnetization shift comes from the AFM Co layer at the interface with the CoO layer, in agreement with the main results obtained for the Co/YMO bilayer.
5 Conclusion
In the present work we have systematically investigated the exchange bias phenomenon in the novel Co/YMO bilayer using SQUID magnetometry and magneto-transport properties. The extracted exchange bias anomalies show the expected field asymmetry, decreasing nearly linearly with temperature. Additionally, a vertical shift is observed in all measurements, which is related to the pinning of magnetic entities of the ferromagnetic Co layer at the interface with the o-YMO layer. Both exchange bias shifts vanish at or just above the Néel temperature confirming also that these are related to the exchange bias phenomenon. From the magnetization values of Co and o-YMO layers and the observed we can also conclude that the measured effect in the bilayer is a direct contribution from the FM layer. The magneto-transport results provide a clear support to this conclusion. The results obtained from similar magnetization and transport measurements in Co/CoO micro-wires support the main conclusions given above, and stress that the observed phenomena are general and not because of any special magnetic characteristics of the o-YMO layer.
References
References
- [1] M. Gruyters and D. Riegel. Phys. Rev. B, 63:052401, 2000.
- [2] M. H. Francombe and R. W. Hoffman, editors. Physics of thin films, volume 6. Academic Press, New York, 1971.
- [3] G. T. Rado and H. Suhl, editors. Magnetism. Academic Press, New York, 1963.
- [4] W. H. Meiklejohn and C. P. Bean. Phys. Rev., 102:1413, 1956.
- [5] T. Gredig, I. N. Krivorotov, and E. D. Dahlberg. Journal of Applied Physics, 91:7760, 2002.
- [6] D. Tripathy and A. O. Adeyeye. Phys. Rev. B, 79:064413, 2009.
- [7] Y. Shimazu, M. Ohkubo, and K. Morinaga. J. Magn. Magn. Mater., 240:17, 2002.
- [8] D. W. Kim, D.-W. Kima, T. W. Noha, H. Tanakac, and T. Kawaic. Sol. State. Comm., 125:305–309, 2003.
- [9] S. Nicolodi, L.G. Pereira, J.E. Schmidt, L.C.C.M. Nagamine, A.D.C. Viegas, C. Deranlot, F. Petroff, and J. Geshev. Physica B: Condensed Matter, 384(1 2):141 – 143, 2006.
- [10] L.C.C.M. Nagamine, J.E. Schmidt, M.N. Baibich, E.B. Saitovitch, and J. Geshev. Physica B: Condensed Matter, 384(1 2):132 – 134, 2006.
- [11] T. R. McGuire and R. I. Plotter. IEEE Trans. Magn., MAG-11:1018, 1975.
- [12] L. Ejsing, M. F. Hansen, A. K. Menon, H. A. Ferreira, D. L. Graham, and P. P. Freitas. Appl. Phys. Lett., 84:4729, 2004.
- [13] C. D. Damsgaard, S. C. Freitas, P. P. Freitas, and M. F. Hansen. Journal of Applied Physics, 103:07A302, 2008.
- [14] A. D. Henriksen, B. T. Dalslet, D. H. Skieller, K. H. Lee, F. Okkels, and M. F. Hansen. Appl. Phys. Lett., 97:013507, 2010.
- [15] H. Y. Hwang, Y. Iwasa, M. Kawasaki, B. Keimer, N. Nagaosa, and Y. Tokura. Nature Materials, 11:103–113, 2012.
- [16] C. Zandalazini, P. Esquinazi, G. Bridoux, J. Barzola-Quiquia, H. Ohldag, and E. Arenholz. J. Magn. Magn. Mater., 323:2892–2898, 2011.
- [17] J. de la Venta, M. Erekhinsky, Siming Wang, K. G. West, R. Morales, and Ivan K. Schuller. Phys. Rev. B, 85:134447, Apr 2012.
- [18] M. R. Fitzsimmons, B. J. Kirby, S. Roy, Zhi-Pan Li, Igor V. Roshchin, S. K. Sinha, and I. V. Schuller. Phys. Rev. B, 75:214412, 2007.
- [19] Hendrik Ohldag, Hongtao Shi, Elke Arenholz, Joachim Stöhr, and David Lederman. Phys. Rev. Lett., 96:027203, 2006.
- [20] R. Morales, Z.-P. Li, O. Petracic, X. Battle, I. K. Schuller, J. Olamit, and K.. Liu. Appl. Phys. Lett., 89:072504, 2006.
- [21] I. Campbell and A. Fert. Ferromagnetic Materials, volume 3, page 762. North-Holland Publishing Company, Amsterdam, 1982.
- [22] H.L. Yakel, W. D. Koehler, E. F. Bertaut, and F. Forrat. Acta Crystallogr., 16:957, 1963.
- [23] A. Waintal and J. Chenavas. Compt. Rend., 264:B 168, 1967. see also Mat. Res. Bull. 2, 819 (1967).
- [24] V. E. Wood, A.E. Austin, and E. W. Collings. J. Phys. Chem. Solids, 34:859, 1973.
- [25] O. Yu Gorbenko, S. V. Samoilenkov, I. E. Graboy, and A. R. Kaul. Chem. Mater., 14:4026, 2002.
- [26] X. Martí, F. Sánchez, V. Skumryev, V. Laukhin, C. Ferrater, M. V. García-Cuenca, M. Varela, and J. Fontcuberta. Thin Sol. Films, 516:4899–4907, 2008.
- [27] P. A. Salvador, T. D. Doan, B. Mercey, and B. Raveau. Chem. Mater., 10:2592, 1998.
- [28] X. Martí, F. Sánchez, J. Fontcuberta, M.V. García-Cuenca, C. Ferrater, and M. Varela. Journal of Applied Physics, 99:08P302, 2006.
- [29] C. C. Hsieh, T. H. Lin, H. C. Shih, C.-H. Hsu, C. W. Luo, J.-Y. Lin, K. H. Wu, T. M. Uen, and J. Y. Juang. Journal of Applied Physics, 104:103912, 2008.
- [30] J. Kim, S. Jung, M. S. Park, Sung-Ik Lee, H. D. Drew, H. Cheong, K. H. Kim, and E. J. Choi. Phys. Rev. B, 74:052406, 2006.
- [31] F. Demmel and T. Chatterji. Phys. Rev. B, 76:212402, 2007.
- [32] P. Miltényi, M. Gierlings, J. Keller, B. Beschoten, G. Güntherodt, U. Nowak, and K. D. Usadel. Phys. Rev. Lett., 84:4224, 2000.
- [33] J. Keller, P. Miltényi, B. Beschoten, G. Güntherodt, U. Nowak, and K. D. Usadel. Phys. Rev. B, 66:014431, 2002.
- [34] U. Nowak, A. Misra, and K. D. Usadel. J. Magn. Magn. Mat., 240:243–247, 2002.
- [35] F. Radu, M. Etzkorn, R. Siebrecht, T. Schmitte, K. Westerholt, and H. Zabel. Phys. Rev. B, 67:134409, 2003.
- [36] F. Radu and H. Zabel. Magnetic Heterostructures, volume 227 of STMP. H. Zabel and S. D. Bader (eds.), Springer Berlin, Heidelberg, 2008.
- [37] A. Muñoz, J. A. Alonso, M. T. Casais, M. J. Martinez-Lopez, J. L. Martinez, and M. T. Fernandez-Diaz. J. Phys.: Condens. Matter, 14:3285–3294, 2002.
- [38] J. Nogués and I. K. Schuller. J. Magn. Magn. Mat., 192:203–232, 1999.
- [39] J. Nogués, D. Lederman, T. J. Moran, and I. K. Schuller. Phys. Rev. Lett., 76:4624, 1996.
- [40] M. Kiwi, J. Mejía-López, R. D. Portugal, and R. Ram rez. Solid State Commun., 166:315–319, 2000.
- [41] C. Nogués, C. Leighton, and I. K. Schuller. Phys. Rev. B, 61:1315, 2000.
- [42] Julio Camarero, Jordi Sort, Axel Hoffmann, Jose Miguel García-Martín, Bernard Dieny, Rodolfo Miranda, and Josep Nogués. Phys. Rev. Lett., 95:057204, 2005.
- [43] M. Gierlings, M. J. Prandolini, H. Fritzsche, M. Gruyters, and D. Riegel. Phys. Rev. B, 65:092407, 2002.
- [44] A. Hoffmann. Phys. Rev. Lett., 63:097203, 2004.
- [45] S. Brems, D. Buntinx, K. Temst, and C. Van Haesendonck. Phys. Rev. Lett., 95:157202, 2005.
- [46] J. Barzola-Quiquia, P. Esquinazi, M. Rothermel, D. Spemann, A. Setzer, and T. Butz. Nucl. Instrum. Methods Phys. Res. B, 256:412–418, 2007.
- [47] A. P. Malozemoff. Journal of Applied Physics, 63:3874, 1988.
- [48] A. L. Efros and B. I. Shklovskii. Journal of Physics C: Solid State Physics, 8:L49, 1975.
- [49] W. Gil, D. Görlitz, M. Horisberger, and J. Kötzler. Phys. Rev. B, 72:134401, 2005.
- [50] D. Buntinx, S. Brems, A. Volodin, K. Temst, and C. Van Haesendonck. Phys. Rev. Lett., 94:017204, 2005.