A correlation between intrinsic brightness and average decay rate of Swift UVOT GRB optical/UV light curves
Abstract
We examine a sample of 48 Swift/UVOT long Gamma-ray Burst light curves and find a correlation between the logarithmic luminosity at 200s and average decay rate determined from 200s onwards, with a Spearman rank coefficient of -0.58 at a significance of 99.998% (4.2). We discuss the causes of the correlation, finding it to be an intrinsic property of long GRBs, and not resulting from the selection criteria. We find two ways to produce the correlation. One possibility is that there is some property of the central engine, outflow or external medium that affects the rate of energy release so that the bright afterglows release their energy more quickly and decay faster than the fainter afterglows. Alternatively, the correlation may be produced by variation of the observers viewing angle, with observers at large viewing angles observing fainter and slower decaying light curves.
keywords:
gamma-rays: bursts1 Introduction
Gamma-ray bursts (GRBs) are intense flashes of gamma-rays that are usually accompanied by an afterglow, longer lived emission that may be detected at X-ray to radio wavelengths. Our understanding of GRB X-ray and optical/UV afterglows was revolutionised by the launch of Swift, a satellite dedicated to the detection of GRBs and observation of their -ray, X-ray and optical/UV emission (Gehrels et al., 2004). The best studied subclass of GRB are the long GRBs (LGRBs), which have observed prompt -ray emission durations of s (Kouveliotou et al., 1993). Several studies have investigated the X-ray emission of LGRBs, using large samples, to identify characteristic temporal and spectral behaviours (i.e Nousek et al., 2006; Evans et al., 2007, 2009). Similar investigations have been performed at optical/IR wavelengths (i.e Melandri et al., 2008; Rykoff et al., 2009; Oates et al., 2009), but these have tended to have much smaller samples, due to the lower detection rate of the optical emission in comparison to the X-rays (the detection rate for Swift’s X-ray and ultra-violet optical telescopes are (Burrows et al., 2008) and (Roming et al., 2009), respectively for LGRBs). The low detection rate is generally attributed to extinction due to high levels of dust in the host (Fynbo et al., 2001), and/or to high redshift at which the optical/UV emission will be absorbed by neutral hydrogen along the line of sight (Groot et al., 1998); see also Greiner et al. (2011) for a recent study on the cause of optically dark GRBs. However, Swift has now observed over 600 GRBs and we are now in a position to collate a large number of well-sampled IR/optical/UV LGRB afterglows from which we can draw a representative picture of their behaviour and collective properties (see recent papers by Kann et al., 2010; Li et al., 2012).
In Oates et al. (2009), we performed a statistical investigation of 26 optical/UV LGRB afterglows, finding a correlation between the observed -band magnitude at 400s and the average UVOT light curve decay rate determined from 500s. We also tested for an equivalent rest frame correlation, but, due to the small sample size, this could not be confirmed or excluded. Here we use a larger sample of 48 high quality LGRB UVOT light curves to re-examine if there is a correlation between optical/UV afterglow intrinsic brightness and light curve decay rate.
This paper is organized as follows. In § 2 we describe the data reduction and analysis. The main results are presented in § 3. Discussion and conclusions follow in § 4 and 5, respectively. All uncertainties throughout this paper are quoted at 1. The temporal and spectral indices, and , are given by the expression .
2 Data Reduction and Analysis
2.1 SAMPLE
Our sample began with 69 LGRBs from the second Swift UVOT GRB afterglow catalogue (Roming et al., in prep.), which were observed between April 2005 and December 2010. The sample was selected using the same criteria as Oates et al. (2009): the optical/UV light curves must have a peak UVOT -band magnitude of 17.89 (equivalent to 1 ct ), UVOT must observe within the first 400s until at least s after the BAT trigger and the colour of the afterglows must not evolve significantly with time, meaning that at no stage should the light curve from a single filter significantly deviate from any other filter light curve when normalized to the filter. Only GRBs 060218 and 100814A were excluded as we considered them to have strong colour evolution. These criteria ensure that a high signal-to-noise (SN) light curve, covering both early and late times, can be constructed from the UVOT multi-filter observations.
In order to obtain the best SN light curve for each GRB, a single light curve was constructed from the multi-filter light curves, following the method in Oates et al. (2009). The main steps are to normalize the multi-filter light curves to the filter and then to group them together using a binsize of . Following Oates et al. (2009), for each GRB, we take the onset of the prompt -ray emission as the start time of the UVOT light curve. Since the BAT may not trigger at the start of the prompt emission, we take the start time of the parameter111The parameter is determined from the gamma-ray event data for each GRB, by the BAT processing script. The results of the processing are publicly available and are provided for each trigger at http://gcn.gsfc.nasa.gov/swift_gnd_ana.html.to be the start time for the UVOT light curve.
2.2 Luminosity Light curve
Luminosity light curves were produced for all GRBs with spectroscopic or photometric redshifts in the literature and for which host E(B-V) values could be determined. For a further 3 GRBs we were able to derive photometric redshifts from joint XRT-UVOT Spectral Energy Distributions (SEDs), following the method of Krühler et al. (2011): for GRB 060510A, for GRB 090401B and for GRB 100805A. For 13 GRBs, no redshift was available nor could we derive a photometric redshift.
For each of the 56 GRBs with host E(B-V) and redshift measurements, we converted the single filter count rate light curve to luminosity at a common rest frame wavelength. In order to select the common wavelength and determine the resulting k-correction factor for each light curve, an SED was computed for each GRB following the methodology in Oates et al. (2009) and using the count rate-to-flux conversion factors given in Breeveld et al. (2011). The common rest frame wavelength was selected to maximise the number of GRBs with SEDs that covered this wavelength and to be relatively unaffected by host extinction. As was found in Oates et al. (2009), the wavelength that best satisfies these conditions is Å. For each GRB, the k-correction factor, , was taken as the flux density at the wavelength that corresponds to 1600Å in the rest frame, , divided by the flux density at the observed central wavelength of the filter (5402Å), , which was multiplied by , where is the redshift of the GRB such that . For those GRBs with SEDs not covering 1600Å, an average value was determined from the other GRBs in the sample, which have SEDs covering both 1600Å and the filter rest frame wavelength.
To convert to luminosity, the count rate light curves were initially corrected for Galactic extinction and then converted into flux per unit frequency. These flux densities were then converted to luminosity at 1600Å using:
| (1) |
where is the luminosity at a 1600Å and is the luminosity distance. Finally, the luminosity light curves were corrected for host extinction, which was calculated from the host values reported in Schady et al. (2010). For those not reported in Schady et al. (2010), we used the same method to determine the host .
3 Results
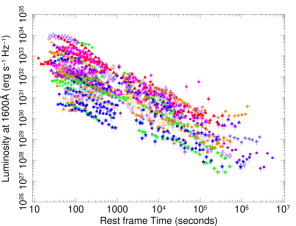
In Figure 1, we show the luminosity light curves at 1600 Å, in units of . The light curves are clustered in a single group, having the largest range in luminosity at the earliest epochs, which becomes narrower as the light curves decay. This characteristic is also seen in the light curves given in Kann et al. (2010). The narrowing of the range in luminosity with time suggests that the most luminous GRBs decay the quickest and the less luminous GRBs decay more slowly. In the next section, we determine if there is a statistically significant correlation between the brightness and decay rate and quantify this correlation.
3.1 Luminosity Decay Correlation
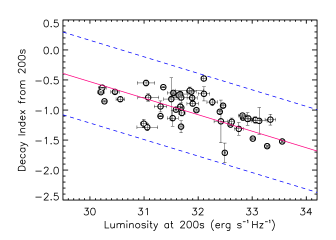
In order to test for a correlation we determined the intrinsic brightness at 200s and the average decay rate determined from 200s onwards. To determine the intrinsic brightness, we used the IDL interpolation function, interpol, on the data between 100 and 2000s and interpolated the logarithmic luminosity at 200s, . For the average decay rate, , using error weighted least squares we fit a single power law to the light curves from 200s onwards. A restframe time of 200s was chosen as by this time all the light curves in the sample have observations. For six GRBs, there were too few data points between 100 and 2000s to constrain the luminosity at 200s and we excluded two further GRBs for which the error on the decay index was greater than 3 times the sample mean decay error. The resulting values for and are shown in Fig. 2. A Spearman rank test of against , gives a correlation coefficient of -0.58 at a significance of 99.998% (4.2). This indicates that and are statistically correlated and confirms that luminous optical/UV afterglows decay more quickly than less luminous ones.
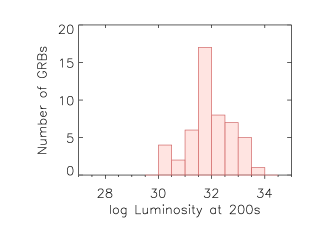
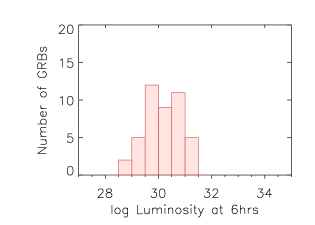
In Fig. 3, we show the distributions of the logarithmic luminosity at 200s and 6 hours, . If the brighter optical/UV afterglows decay more quickly than the fainter ones then at late epochs the luminosity distribution must become narrower and the correlation should become weaker and/or insignificant. We observe both of these effects in our sample. In Fig. 3, the 6hr luminosity distribution has a standard deviation of 0.69 which is smaller than the standard deviation of the 200s luminosity distribution, which is 0.84 (see also Kann et al., 2010), and, a Spearman rank test of and indicates no significant correlation with a coefficient of 0.01 and a significance of 8%.
In order to quantify the relationship between and , we performed a linear regression using the IDL routine, fitexy, which takes into account the errors on both parameters. This analysis provides a linear relationship of , given as a solid red line in the left panel of Fig. 2. All GRBs reside within the rms deviation, indicated by blue dotted lines.
We looked to see if the correlation was due to both parameters being related to redshift, . A Spearman rank correlation between these parameters gives: a coefficient of 0.62 at a significance of for , and a coefficient of -0.33 at a significance of for . The correlation between and redshift is expected as we are able only to detect GRBs at high redshift if they are very luminous. The correlation between and redshift is much weaker than the correlation between and suggesting that the correlation is not due to the implicit correlation between these two parameters and redshift. To confirm this, we calculate the partial Spearman rank correlation, which measures the degree of correlation between two parameters, and , excluding the effect of a third, in this case redshift (see Kendall & Stuart, 1979, for further details). Using this method we obtain a correlation coefficient of -0.50 with a confidence of (3.5), only a small reduction in the correlation coefficient from the standard Spearman rank correlation. This indicates that the correlation between and is not a result of the implicit correlation between these two parameters and redshift.
The correlation could be due to chance or be a result of selecting the sample by their observed frame properties, specifically the exclusion of LGRB optical afterglows that were fainter than 17.89 in UVOT -band and/or were not observed within 400s after the trigger. In order to eliminate these possibilities, we performed a Monte Carlo simulation. For each of a total of trials, we simulated a distribution of 48 pairs of data points selected at random from linear distributions of and , which have the same ranges as the observed sample. For each pair of data points, we produced a synthetic observed frame light curve using and and randomized values for redshift, host and Galactic extinction and ; where, , was used to determine the k-correction factor (; Lamb & Reichart, 2000). Similar to the simulated and points, these parameters were sampled randomly from linear distributions, which have the same range as the observed light curves. In order to simulate the time it takes for Swift to point its narrow field instruments at the GRB location, we selected at random an observed frame light curve from our sample and used the time sampling of this light curve, i.e photometry times and durations, as the time sampling for the simulated observed frame light curve. We then determined if the simulated observed frame light curve met our selection criteria. For those that did not meet the selection criteria, we discarded the corresponding data point and drew a new pair of values until the selection criteria were met. Once 48 pairs of and had been found with synthetic observed frame light curves that met the selection criteria, a Spearman rank correlation was performed on the simulated distribution.
Of the trials, only 34 have a correlation coefficient equal to or indicating a stronger correlation than the real distribution. This indicates that, at confidence, the correlation is not due to our selection criteria nor does it occur by chance and therefore implies that the correlation is intrinsic to LGRBs.
4 Discussion
Using 48 optical/UV light curves, we have found a significant correlation between the intrinsic brightness and average decay rate of LGRB optical/UV afterglows. A similar correlation was found by Panaitescu & Vestrand (2008), who found for those GRBs with an observed rise in the optical light curves, there was a correlation between peak flux and post-peak power-law decay rate. The correlation reported by Panaitescu & Vestrand (2008) is limited to only those GRBs which are observed to rise. Since the majority of rising afterglows cease rising by s (Oates et al., 2009), which is typically earlier than restframe 200s (i.e s), the correlation determined in this work can be applied to optical afterglows with all types of early behaviour. Furthermore, as the UVOT typically begins observing within the first s after the BAT trigger, the majority of GRBs observed by Swift, with a detected optical counterpart, can be included in the correlation reported in this paper. In the following, we shall examine the possible ways to produce a correlation between and .
4.1 Is the correlation predicted by the standard afterglow model?
4.1.1 The basic model
The correlation may be a natural result of the jet interacting with the external medium, producing synchrotron emission. Here we assume an isotropic, collimated outflow which is not energy injected. In this model, the luminosity is related to and by , and and are related linearly by the closure relations (e.g Sari, Piran & Narayan, 1998), defined by the external medium density profile and the ordering of the synchrotron frequencies. For the GRBs in this sample, due to our selection criteria requiring no colour evolution, we may conclude that does not vary during the course of our observations. We now examine two scenarios to determine if the correlation is a result of the basic afterglow model.
In the simplest scenario, all optical afterglows arise from a single closure relation, in which is not a fixed value. In this scenario, and are related linearly and therefore a correlation between and should be expected. However, only a weak correlation is observed between and and there is no evidence for a correlation between and (see Fig 4), with Spearman rank coefficients of 0.26 (92%) and -0.15 (68%), respectively. This scenario is therefore not likely the cause of the correlation.
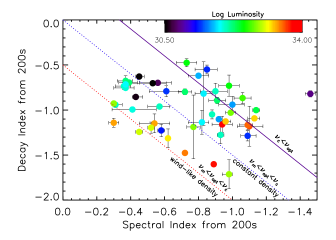
However, we do not expect all optical afterglows to be on the same phase of the synchrotron spectrum. In the second scenario, we assume that the correlation is a result of more than one closure relation, which requires the use of multiple spectral segments and different density profiles. The spectral segments most commonly found to satisfy optical afterglow production are: and , where is the cooling frequency and is the peak frequency. The spectral segment requires different closure relations for when the ejecta interacts with a constant density medium and a wind-like density medium. The spectral segment, , is independent of the external medium density profile. The expected relations between and for these scenarios are indicated by lines in Fig. 4. If the correlation was produced by the optical afterglows resulting from multiple closure relations, in Fig. 4 we would observe the and data points with similar luminosities to cluster around a given closure relation. In Fig. 4, the data points do not appear to display this trend and therefore we find it unlikely that the basic standard model is causing the correlation.
4.1.2 Complex afterglow model
The afterglow model is likely to be more complex than we previously assumed and there may be some mechanism or parameter that regulates the energy release in GRB afterglows and their decay rate. To satisfy our observations, this must occur in such a way that when the energy is released quickly the result is an initially bright afterglow which decays quickly. Conversely, if the energy is released slowly over a longer period, the afterglow will be less bright initially and decay at a slower rate. This may indicate that there is a narrow range of energy provided to the outflow. One possible way to regulate energy release could be continued energy injection. If the central engine does not initially release all its energy, but releases it over a much longer period, the result could be a fainter afterglow which decays slowly.
4.2 Observing angle, jet structure and degree of collimation
The correlation may instead be due to a range in observing angle (i.e observer’s angle relative to the jet axis), , with the fainter optical afterglows being observed at larger observing angles (e.g Ramirez-Ruiz et al., 2005; Panaitescu & Vestrand, 2008). Panaitescu & Vestrand (2008) show in their fig. 3. that, for a jet with uniform velocity distribution, an off-axis observer, i.e , where is the jet opening angle, will observe a shallower decay and observe the afterglow to be less luminous in comparison to an observer who is observing closer to the edge of the jet, i.e . This effect should be observed for both constant density and wind-like external media. This model is more complex if structured outflows are considered. For structured outflows, off-axis viewers will also observe a shallower and fainter light curve in comparison with on-axis observers, but the convergence time and the range of decay rates will vary, depending on how the outflow is structured.
A couple of tests may provide support for the correlation resulting from jet structure and observer viewing angle. First, we should expect to see convergence of the light curves at late times to a similar decay rate for all observing angles. And second, since afterglows that are viewed more off-axis will rise later, we should also observe a correlation between afterglow brightness and peak time, though this may be complicated by jet structure. Panaitescu & Vestrand (2008) tested for this correlation using 11 optical light curves with rises and find a strong correlation between peak luminosity and peak time consistent with this hypothesis though their test could not be applied to the GRBs without observed rises (c.f Kann et al., 2010).
5 Conclusions
We computed luminosity light curves at 1600Å for 48 optical/UV GRB afterglows. We find a correlation between luminosity at 200s and average decay rate from 200s onwards with a significance of 99.998% (4.2). Regression analysis indicates a linear relationship between decay rate and luminosity of .
We used a Monte Carlo simulation to determine, at 4.1 confidence, that the correlation is intrinsic and not due to chance or our selection criteria. We determined that this correlation is not likely to be a natural consequence of the basic synchrotron afterglow model. Instead we find two possible ways to produce the correlation. The first is that there is some property of the central engine, outflow or external medium that affects the rate of energy release and rate of light curve decay, in such a way that for brighter afterglows the energy is released more quickly and decays more rapidly than the fainter afterglows. Alternatively, the correlation may be produced by a range in observing angles, with observers at large viewing angles witnessing fainter and slower decaying light curves. Understanding the origin of this correlation will have important consequences on our understanding of the physics and geometry behind GRBs.
6 Acknowledgments
This research has made use of data obtained from the High Energy Astrophysics Science Archive Research Center (HEASARC) and the Leicester Database and Archive Service (LEDAS), provided by NASA’s Goddard Space Flight Center and the Department of Physics and Astronomy, Leicester University, UK, respectively. SRO, AAB, NPMK and MJP acknowledge the support of the UK Space Agency.
References
- Breeveld et al. (2011) Breeveld A. A., Landsman W., Holland S. T., Roming P., Kuin N. P. M., Page M. J., 2011, in American Institute of Physics Conference Series, Vol. 1358, American Institute of Physics Conference Series, J. E. McEnery, J. L. Racusin, & N. Gehrels, ed., pp. 373–376
- Burrows et al. (2008) Burrows D. N. et al., 2008, ArXiv e-prints
- Evans et al. (2009) Evans P. A. et al., 2009, Mon. Not. R. Astr. Soc., 397, 1177
- Evans et al. (2007) —, 2007, Astron. Astrophys., 469, 379
- Fynbo et al. (2001) Fynbo J. U. et al., 2001, Astron. Astrophys., 369, 373
- Gehrels et al. (2004) Gehrels N. et al., 2004, Astrophys. J., 611, 1005
- Greiner et al. (2011) Greiner J. et al., 2011, A&A, 526, A30
- Groot et al. (1998) Groot P. J. et al., 1998, Astrophys. J. Letters, 493, L27+
- Kann et al. (2010) Kann D. A. et al., 2010, ApJ, 720, 1513
- Kendall & Stuart (1979) Kendall M., Stuart A., 1979, The advanced theory of statistics. Vol.2: Inference and relationship
- Kouveliotou et al. (1993) Kouveliotou C., Meegan C. A., Fishman G. J., Bhat N. P., Briggs M. S., Koshut T. M., Paciesas W. S., Pendleton G. N., 1993, Astrophys. J. Letters, 413, L101
- Krühler et al. (2011) Krühler T. et al., 2011, A&A, 526, A153
- Lamb & Reichart (2000) Lamb D. Q., Reichart D. E., 2000, ApJ, 536, 1
- Li et al. (2012) Li L. et al., 2012, ArXiv e-prints
- Melandri et al. (2008) Melandri A. et al., 2008, Astrophys. J., 686, 1209
- Nousek et al. (2006) Nousek J. A. et al., 2006, Astrophys. J., 642, 389
- Oates et al. (2009) Oates S. R. et al., 2009, Mon. Not. R. Astr. Soc., 395, 490
- Panaitescu & Vestrand (2008) Panaitescu A., Vestrand W. T., 2008, Mon. Not. R. Astr. Soc., 387, 497
- Ramirez-Ruiz et al. (2005) Ramirez-Ruiz E., Granot J., Kouveliotou C., Woosley S. E., Patel S. K., Mazzali P. A., 2005, Astrophys. J. Letters, 625, L91
- Roming et al. (2009) Roming P. W. A. et al., 2009, Astrophys. J., 690, 163
- Roming et al. (in prep.) —, in prep.
- Rykoff et al. (2009) Rykoff E. S. et al., 2009, ApJ, 702, 489
- Sari, Piran & Narayan (1998) Sari R., Piran T., Narayan R., 1998, Astrophys. J. Letters, 497, L17
- Schady et al. (2010) Schady P. et al., 2010, MNRAS, 401, 2773