Comment on “Casimir Force and In Situ Surface Potential Measurements on Nanomembranes”
In Ref. 1 the frequency shift of an oscillator under the influence of the residual electric force and the Casimir force was measured between Au-coated surfaces of a sphere and a membrane. Using the model for with two fitting parameters it was claimed that the data for frequency shift are best described by the Drude model approach to the Casimir force ( and -probability to exceed 35%) and excludes the plasma model approach ( and the probability of about 1%). We demonstrate that these results are incorrect, and that the data of Ref. 1 are inconsistent with both theoretical approaches.
First, we note that although a mistake in Eq. (2) in Ref. 1 , indicated by us earlier com , was corrected in an Erratum er , the factor , where is the r.m.s. amplitude of membrane vibrations and is separation, remained incorrect. In dynamic experiments the corrections due to surface roughness must be included in an expression for the external force, whereas vibrations determine the frequency shift according to corrected Eq. (2). Because of this, the factor used on p.4 to correct separations must be replaced with .
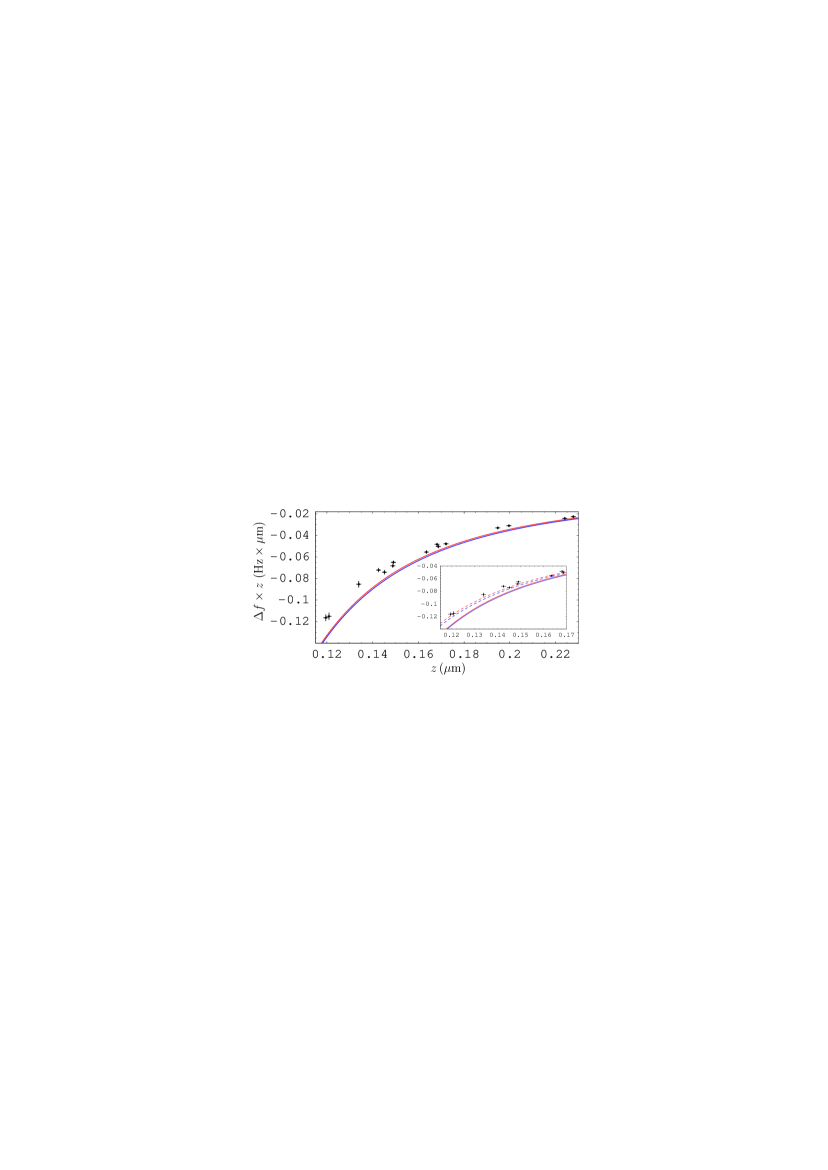
Next, we recalculated using the tabulated optical data of Au 2 extrapolated to zero frequency using either the Drude BS or the plasma 4 model with parameters eV and eV which, according to Refs. 1 ; 3 , best fit the optical data. In Fig. 1, our computational results for using corrected Eq. (2) and the Drude- and plasma-model extrapolations are shown by the upper and lower solid lines, respectively, for from 0.118 to m where, as stated in Ref. 1 , the electrostatic force is negligible. The experimental data taken from Fig. 4(c) of Ref. 1 are indicated as crosses whose arms show the experimental errors (the values of were extracted from the electrostatic force and corrected by a factor in the Letter 1 ).
As is seen in Fig. 1, all 15 data points of the total 32 exclude both the Drude- and plasma-model approaches to the Casimir force. For any fit, the contribution of these data to will exceed 300 and 419, respectively. The 17 data points, measured in Ref. 1 at larger separations, where may be not negligible, can only increase these values. As a result, for both approaches the -probability is much less than %. Our computational results do not coincide with the theoretical results in Fig. 4(c) of Ref. 1 . The latter are reproduced when one disregards the optical data and uses instead simple Drude and plasma models over the entire frequency region and Eq. (2) with only the first term (see the upper and lower dashed lines on an inset to Fig. 1, respectively). It is known, however, that at m core electrons contribute significantly to the dielectric permittivity, so that simple Drude and plasma models cannot be used to calculate the Casimir force 4 . Note that the effect of surface roughness only increases the magnitude of , thus, increasing a disagreement between experiment and theory.
To summarize, the calculations presented here demonstrate strong disagreement between the experimental data of Ref. 1 and both theoretical approaches to the Casimir force, thus, suggesting the presence of an unaccounted systematic error in the data.
This work was supported by the DFG grant BO 1112/21–1.
M. Bordag,1 G. L. Klimchitskaya,1,2
and V. M. Mostepanenko1,2
1Institute for Theoretical
Physics, Leipzig University,
D-04009, Leipzig, Germany
2Central Astronomical Observatory
at Pulkovo of the Russian Academy of Sciences,
St.Petersburg, 196140, Russia
PACS numbers: 85.85.+j, 07.10.Pz, 42.50.Lc
References
- (1) D. Garcia-Sanches, K. Y. Fong, H. Bhaskaran, S. Lamoreaux, and H. X. Tang, Phys. Rev. Lett. 109, 027202 (2012).
- (2) M. Bordag, G. L. Klimchitskaya, and V. M. Mostepanenko, arXiv:1208.1757v1.
- (3) D. Garcia-Sanches, K. Y. Fong, H. Bhaskaran, S. Lamoreaux, and H. X. Tang, Phys. Rev. Lett. 109, 159902 (2012).
- (4) Handbook of Optical Constants of Solids, vol I, ed. E. D. Palik (Academic, New York, 1985).
- (5) M. Boström and B. E. Sernelius, Phys. Rev. Lett. 84, 4757 (2000).
- (6) G. L. Klimchitskaya, U. Mohideen, and V. M. Mostepanenko, Rev. Mod. Phys. 81, 1827 (2009).
- (7) A. O. Sushkov, W. J. Kim, D. A. R. Dalvit, and S. K. Lamoreaux, Nature Phys. 7, 230 (2011).