Tetragonal to Orthorhombic Transition of GdFeAsO Studied by Single-Crystal Synchrotron X-Ray Diffraction
Abstract
A study of the tetragonal to orthorhombic phase transition of GdFeAsO is presented. Planes of the reciprocal space were reconstructed form single-crystal synchrotron X-ray diffraction data. By cooling below the structural transition temperature splitting of the Bragg reflections was observed corresponding to four different twin domain orientations. A model was developed to quantify the distortion of the lattice from the position of the splitted reflections relative to each other. Constrained 2D-Cauchy fits of several splitted reflections provided positions of the reflections. The influence of the structural distortion was detectable already above the structural transition temperature hinting at fluctuations in the tetragonal phase.
pacs:
61.50.Ks 61.66.Fn, 74.62.Bf, 74.70.Xa,I Introduction
With the discovery of high-temperature superconductivity in layered iron containing compounds (iron pnictides) Kamihara et al. (2006, 2008); Paglione and Greene (2010), a new system of phases was added to the study of unconventional superconductivity. Since the understanding of the phenomenon of high- superconductivity is still limited, the question of the differences and similarities towards other high- compounds such as the cuprates arisesTohyama (2012).
The cuprates as well as many iron pnictides become superconducting by doping of a non-superconducting antiferromagnetic “parent” compound. Whereas the superconductivity in the cuprates is believed to originate from the Mott-insulator properties of the “parent” compound, the iron pnictides do not exhibit this electronic correlation. However, a common feature is the antiferromagnetic ordering, which has to be suppressed to achieve superconductivity and is thus considered significant.
Iron pnictides, such as FeAsO, ( = rare-earth metal) and Fe2As2 ( = Ca, Sr, Ba, and Eu), show antiferromagnetic transitions accompanied by structural distortions from tetragonal to orthorhombic symmetry upon cooling. While the structrual transition and the magnetic ordering occur simultaneously in Fe2As2Rotter et al. (2008); Tegel et al. (2008), the structural transition in FeAsO compounds is observed at slightly higher temperatures than the magnetic orderingde la Cruz et al. (2008); Klauss et al. (2008); Luo et al. (2009); Jesche et al. (2010); Klingeler et al. (2010).
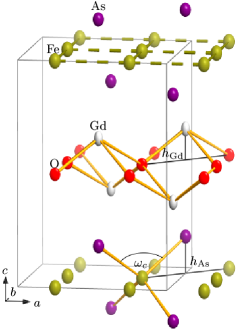
The FeAsO room-temperature phases of ZrCuSiAs-type structure (space-group type ) undergo a translationengleiche transition of index 2 to the low-temperature structure with space-group type de la Cruz et al. (2008) (Fig. 1, for structural relations see also Ref. Johrendt et al., 2011).
A similar transition occurs in the Fe2As2 compounds ( to ). Tanatar et al.Tanatar et al. (2009) and Blomberg et al.Blomberg et al. (2012) studied the formation of lamellar transformation twins by single-crystal X-ray diffraction of Fe2As2 and the influence of the domain structure on the anisotropy of the resistivity in directions of the basal plane. Due to the analogous mechanism of the structural transition for FeAsO, the question arises, if the twin formation is similar to Fe2As2.
Here, we present the first single-crystal X-ray diffraction study of the structural evolution and the twin formation of FeAsO compounds with GdFeAsO as representative. Doped GdFeAsO has one of the highest (K) in this class of superconductorsWang et al. (2008), which has been associated with the vanishing distortion of the FeAs4 tetrahedraLee et al. (2008). This concept has been the starting point of an ongoing investigation on the structural changes associated with the transition to the superconducting phase and its physical implications.
II Experimental
Preparation and characterization of the crystal used for single-crystal synchrotron X-ray diffraction has been described elsewhereNitsche et al. (2010). Diffraction data for this study were recorded with a mm MAR-CCD detector mounted on a Huber four-circle diffractometer at beamline D3 at DESY. The measurements were performed in the temperature range of –K using an open flow Oxford Diffraction Helijet cryostat. -scans were recorded with an increment of , a detector distance of mm, and a wavelength of Å. The detector distance and the wavelength were refined by comparing the experimental lattice parameters of a standard corundum single-crystal to literature data. The raw frames from the MAR-CCD detector were converted using the APEXII suiteAPE (2009). Integration and corrections for oblique incidence and polarization were performed within SAINT+SAI (2009). For data reduction and absorption correction SADABSSheldrick (2008) was used. The structures were solved and refined with SHELXS and SHELXLSheldrick (2007). Details concerning the structure analysis of GdFeAsO at different temperatures can be obtained from the Fachinformationszentrum KarlsruheNote (1).
III Results and Discussion
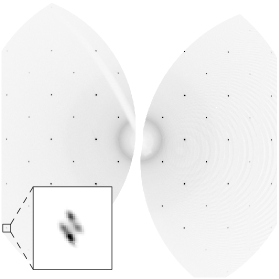
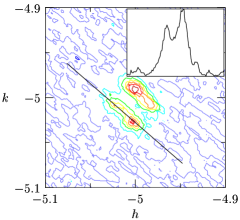
When cooling below the temperature of the structural transition, K, splitting of reflections at high diffraction angles was observed in the synchrotron experiment. To assess the metric distortion during the structural transition, a program was written in MATLABMAT (2011), that allows reconstruction of planes of the reciprocal space with high lateral resolution (Fig. 2).
The metric distortion of the structure is the only degree of freedom generated by the structural transition. A model has been developed, which allows to determine the metrical distortion from the observed splitting of reflections. For convinient comparison of the tetragonal (indicated by subscript t) and orthorhombic (subscipt o) structures, the -centered orthorhombic cell is transformed into a monoclinic (subscript m) primitive cell (upper right panel in Fig. 3) by
The distortion of the structure is then defined by the angle (i.e. in reciprocal space).

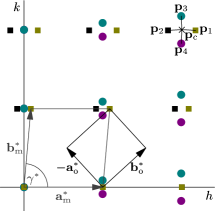
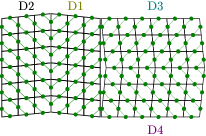
The twin domains join in common planes that are indexed and in the C-centered cell, i.e. and in the primitive cell. Thus four different orientations of the domains in the low-temperature phase result. In the diffraction pattern fourfold splitting of reflections in general positions can be observed, especially at higher diffraction angles (Inset in Fig. 2). The position vectors , , , and of the reflections belonging to the four domains can be derived from their common center and the distortion angle (Fig. 3) by
Blomberg et al.Blomberg et al. (2012) detwinned BaFe2As2 crystals by tensile stress and showed that the relative positions of the reflections is dependent on the domain fractions. If, for example, the domain fraction of D4 in Fig. 3 increases, the orientation of the two sets of domains changes towards each other. In the geometrical model described here, the correlation of the reflection positions to their intensity is achieved by linear scaling of the transformations shown above. This approximation is acceptable due to the small differences of the intensities and the local fit of the reflections. In summary, the positions of the reflections are constrained to their common center of all the four reflections, the monoclinic distortion angle , and the intensities of the reflections. This enables the parameter refinement of overlapping reflections.
To quantify the distortion, an algorithm was written in MATLAB to fit the splitted reflections by a linear combination of four elliptical 2D-Lorentz (Cauchy) functions (concerning multivariate t-distributions see Ref. Kotz and Nadarajah, 2004, 2D-Gaussian fit of neutron data see Refs. McIntyre and Visser, 1986; McIntyre et al., 1988). A Lorentzian type profile function was chosen empirically by investigating 1D-sections of the 2D-distribution (see Fig. 4).
The fitting parameters were the center of the splitted reflections , the distortion angle (), the ellipticity of the reflections, the width of the 2D-Lorentz distributions, and the individual intensities of the reflections.
For the structural investigation reflections of each measurement, exhibiting reflection splitting, were fitted to obtain an average distortion angle and a corresponding standard deviation. The reflection data were integrated with a tetragonal cell since splitting was not wide enough to perform multidomain integration. Using the tetragonal lattice parameters, which correspond to , and the obtained distortion angle, the orthorhombic lattice parameters were obtained by
All reflections could be fitted with this model. No signs for a deviation from the low-temperature orthorhombic structure towards true monoclinic symmetry was observed. Furthermore, no superstructure reflections could be identified in the reconstructed images of the reciprocal space. This confirms the tetragonal to orthorhombic transition established by powder diffractionde la Cruz et al. (2008).
The order parameter of the tetragonal to orthorhombic transition is proportional to the spontaneous deformation and can be fitted by a power law (upper panel in Fig. 5),
with the critical exponent and a transition temperature of K.
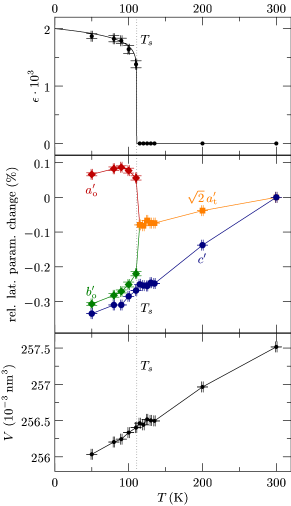
The critical exponent is very small but comparable to the order parameters found for SrFe2As2 and EuFe2As2 ( and , respectivelyTegel et al. (2008)), where structural and magnetic transition occur at the same temperature. Tegel et al. explained the small critical exponent by an ordering following the two-dimensional Ising model of the iron subsystem, which should yield a critical exponent of . In the case of GdFeAsO the structural transition occurs at temperatures above the magnetic transition, which could be the reason for the even lower critical exponent determined, indicating that the structural transition of GdFeAsO is close to first order (concerning multiferroic transformation and the connection to first order phase transition see also Refs. Jacobs, 2000; Salje and Carpenter, 2011).
The structural transition temperature K obtained from the fit is lower than determined by Luo et al.Luo et al. (2009) with powder X-ray diffraction and resistivity measurements. This deviation might be caused by a systematic temperature error from the open flow helium cryostat used for this single-crystal X-ray diffraction study.
The lattice parameters and the volume of the tetragonal phase (middle and lower panel of Fig. 5) decrease in the course of cooling. However, there are hints that there is an anomaly just above the structural transition (e.g. different slope for below K), as it was also observed for the thermal expansion of GdFeAsO by Klingeler et al.Klingeler et al. (2010) and assigned to a competition of differently ordered phases.
Interestingly, the height of the gadolinium atom above the oxygen layer ( in Fig. 1) remains almost constant over the whole temperature range, while the arsenic atom height over the iron layer () diminishes with decreasing lattice parameter . The angle of the coordination polyhedron around Fe (Fig. 6)
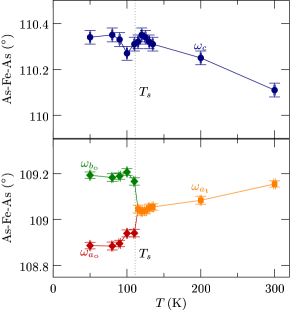
with its bisector parallel to the -direction first increases upon cooling and then becomes almost constant already above the structural transition and does not change much upon further cooling. This indicates structural fluctuations by softening of the lattice or vibrational modes above the structural distortion which is also mirrored in other properties (e.g. thermal expansionKlingeler et al. (2010) and X-ray reflection broadeningMcGuire et al. (2008)). The angles with the angle bisector parallel and do not exhibit this anomaly and merely differentiate corresponding to the tetragonal to orthorhombic transition.
Although, the overall structural changes upon cooling are subtle, they indicate a response of the structure already at temperatures above the onset of the metric distortion. It is clear that higher resolution of the structural investigations is needed to further study the interplay of structure and physical properties of both the “parent” and superconducting phases.
IV Conclusion
A geometrical model was developed for single-crystal synchrotron X-ray diffraction measurements to quantify the metric distortion and twin formation of GdFeAsO induced by the tetragonal to orthorhombic structural transition.
Subtle changes in the structure are detectable. Fitting the spontaneous deformation by a power law lead to a small critical exponent of , which is lower than expected for a two-dimensional Ising model, pointing towards a transition close to first order. This may be caused by the separation of the magnetic and the structural transition in temperature. The lattice parameters decrease with decreasing temperature, and the and axes differentiate at temperatures below the structural transition. The deformation is abrupt and preceeded by a stagnation of the decrease of the cell parameters. This indicates long-range fluctuations of the lattice or softening of a vibrational mode at temperatures above the structural transition, which were also observed by other methods (e.g. Ref. Hahn et al., 2012). If this feature is linked to the superconductivity is not yet clear.
Although the presented structural information from single-crystal X-ray diffraction show the subtle structural changes around the tetragonal to orthorhombic phase transition, data with higher resolution is needed to unreavel more details of the interplay of the structure and properties of the “parent” compounds of iron-based superconductivity.
V Acknowledgement
Parts of this research were carried out at the light source DORIS III at DESY, a member of the Helmholtz Association. We would like to thank Martin Tolkiehn and Mathias Herrmann for their assistance at beamline D3. The authors also like to thank Jutta Krug, Karoline Stolze, Eike Ahrens for their help with sample preparation and measurements.
References
- Kamihara et al. (2006) Y. Kamihara, H. Hiramatsu, M. Hirano, R. Kawamura, H. Yanagi, T. Kamiya, and H. Hosono, J. Am. Chem. Soc. 128, 10012 (2006).
- Kamihara et al. (2008) Y. Kamihara, T. Watanabe, M. Hirano, and H. Hosono, J. Am. Chem. Soc. 130, 3296 (2008).
- Paglione and Greene (2010) J. Paglione and R. L. Greene, Nat. Phys. 6, 645 (2010).
- Tohyama (2012) T. Tohyama, Jpn. J. Appl. Phys. 51, 010004 (2012).
- Rotter et al. (2008) M. Rotter, M. Tegel, D. Johrendt, I. Schellenberg, W. Hermes, and R. Pöttgen, Phys. Rev. B 78, 020503 (2008).
- Tegel et al. (2008) M. Tegel, M. Rotter, V. Weiß, F. M. Schappacher, R. Pöttgen, and D. Johrendt, J. Phys.: Condens. Matt. 20, 452201 (2008).
- de la Cruz et al. (2008) C. de la Cruz, Q. Huang, J. W. Lynn, J. Li, W. R. II, J. L. Zarestky, H. A. Mook, G. F. Chen, J. L. Luo, N. L. Wang, and P. Dai, Nature 453, 899 (2008).
- Klauss et al. (2008) H.-H. Klauss, H. Luetkens, R. Klingeler, C. Hess, F. J. Litterst, M. Kraken, M. M. Korshunov, I. Eremin, S.-L. Drechsler, R. Khasanov, A. Amato, J. Hamann-Borrero, N. Leps, A. Kondrat, G. Behr, J. Werner, and B. Büchner, Phys. Rev. Lett. 101, 077005 (2008).
- Luo et al. (2009) Y. Luo, Q. Tao, Y. Li, X. Lin, L. Li, G. Cao, Z.-A. Xu, Y. Xue, H. Kaneko, A. V. Savinkov, H. Suzuki, C. Fang, and J. Hu, Phys. Rev. B 80, 224511 (2009).
- Jesche et al. (2010) A. Jesche, C. Krellner, M. de Souza, M. Lang, and C. Geibel, Phys. Rev. B 81, 134525 (2010).
- Klingeler et al. (2010) R. Klingeler, L. Wang, U. Köhler, G. Behr, C. Hess, and B. Büchner, J. Phys.: Conf. Ser. 200, 012088 (2010).
- Johrendt et al. (2011) D. Johrendt, H. Hosono, R. Hoffmann, and R. Pöttgen, Z. Kristallogr. 226, 435 (2011).
- Tanatar et al. (2009) M. A. Tanatar, A. Kreyssig, S. Nandi, N. Ni, S. L. Bud’ko, P. C. Canfield, A. I. Goldman, and R. Prozorov, Phys. Rev. B 79, 180508 (2009).
- Blomberg et al. (2012) E. C. Blomberg, A. Kreyssig, M. A. Tanatar, R. M. Fernandes, M. G. Kim, A. Thaler, J. Schmalian, S. L. Bud’ko, P. C. Canfield, A. I. Goldman, and R. Prozorov, Phys. Rev. B 85, 144509 (2012).
- Wang et al. (2008) C. Wang, L. Li, S. Chi, Z. Zhu, Z. Ren, Y. Li, Y. Wang, X. Lin, Y. Luo, S. Jiang, X. Xu, G. Cao, and Z. Xu, Europhys. Lett. 83, 67006 (2008).
- Lee et al. (2008) C. Lee, A. Iyo, H. Eisaki, H. Kito, M. T. Fernandez-Diaz, T. Ito, K. Kihou, H. Matsuhata, M. Braden, and K. Yamada, J. Phys. Soc. Japan 77, 083704 (2008).
- Nitsche et al. (2010) F. Nitsche, A. Jesche, E. Hieckmann, T. Doert, and M. Ruck, Phys. Rev. B 82, 134514 (2010).
- APE (2009) “APEX2 (Version 2009.9),” (2009), Bruker AXS Inc.
- SAI (2009) “SAINT+ (Version 7.68A),” (2009), Bruker AXS Inc.
- Sheldrick (2008) G. M. Sheldrick, “SADABS (Version 2008/1),” (2008), Bruker AXS Inc.
- Sheldrick (2007) G. M. Sheldrick, Acta Crystallogr. Sect. A 64, 112 (2007).
- Note (1) Fachinformationszentrum Karlsruhe, D-76344 Eggenstein-Leopoldshafen, Germany, quote the depository numbers (CSD-No.) 425005 (300 K), 425006 (200 K), 425007 (135 K), 425008 (130 K), 425009 (125 K), 425010 (120 K), 425011 (115 K), 425012 (110 K), 425013 (1100 K), 425014 (90 K), 425015 (80 K), and 425016 (50 K).
- MAT (2011) “MATLAB (Version 7.12.0.635 R2011a),” (2011), The MathWorks Inc.
- Kotz and Nadarajah (2004) S. Kotz and S. Nadarajah, Multivariate T-Distributions and Their Applications (Cambridge University Press, 2004).
- McIntyre and Visser (1986) G. J. McIntyre and D. Visser, J. Phys. Colloques 47, 75 (1986).
- McIntyre et al. (1988) G. J. McIntyre, A. Renault, and G. Collin, Phys. Rev. B 37, 5148 (1988).
- Jacobs (2000) A. E. Jacobs, Phys. Rev. B 61, 6587 (2000).
- Salje and Carpenter (2011) E. K. H. Salje and M. A. Carpenter, J. Phys.: Condens. Matter 23, 462202 (2011).
- McGuire et al. (2008) M. A. McGuire, A. D. Christianson, A. S. Sefat, B. C. Sales, M. D. Lumsden, R. Jin, E. A. Payzant, D. Mandrus, Y. Luan, V. Keppens, V. Varadarajan, J. W. Brill, R. P. Hermann, M. T. Sougrati, F. Grandjean, and G. J. Long, Phys. Rev. B 78, 094517 (2008).
- Hahn et al. (2012) S. E. Hahn, G. S. Tucker, J.-Q. Yan, A. H. Said, B. M. Leu, R. W. McCallum, E. E. Alp, T. A. Lograsso, R. J. McQueeney, and B. N. Harmon, “Magnetism dependent phonon anomaly in LaFeAsO observed via inelastic x-ray scattering,” (2012), arXiv:cond-mat/1206.1096 .