Herschel††thanks: Herschel is an ESA space observatory with science instruments provided by European-led Principal Investigator consortia and with important participation from NASA. observations of extended atomic gas in the core of the Perseus cluster
Abstract
We present Herschel observations of the core of the Perseus cluster of galaxies. Especially intriguing is the network of filaments that surround the brightest cluster galaxy, NGC 1275, previously imaged extensively in H and CO. In this work, we report detections of far-infrared (FIR) lines, in particular, [Cii] 158 m, [Oi] 63 m, [Nii] 122 m, [Oib] 145 m and [Oiii] 88 m, with Herschel. All lines are spatially extended, except [Oiii], with the [Cii] line emission extending up to 25 kpc from the core. [Cii] emission is found to be cospatial with H and CO. Furthermore, [Cii] shows a similar velocity distribution to CO, which has been shown in previous studies to display a close association with the H kinematics. The spatial and kinematical correlation among [Cii], H and CO gives us confidence to model the different components of the gas with a common heating model.
With the help of FIR continuum Herschel measurements, together with a suite of coeval radio, submm and infrared data from other observatories, we performed a spectral energy distribution fitting of NGC 1275 using a model that contains contributions from dust emission as well as synchrotron AGN emission. This has allowed us to accurately estimate the dust parameters. The data indicate a low dust emissivity index, , a total dust mass close to , a cold dust component with temperature K and a warm dust component with temperature of K. The FIR-derived star formation rate (SFR) is , which is in agreement with the FUV-derived SFR in the core, determined after applying corrections for both Galactic and internal reddening. The total infrared luminosity in the range 8 m to 1000 m is inferred to be , making NGC 1275 a luminous infrared galaxy (LIRG).
We investigated in detail the source of the Herschel FIR and H emissions emerging from a core region kpc in radius. Based on simulations conducted using the radiative transfer code, cloudy, a heating model comprising old and young stellar populations is sufficient to explain these observations. The optical line ratios indicate that there may be a need for a second heating component. However, stellar photoionization seems to be the dominant mechanism.
We have also detected [Cii] in three well-studied regions of the filaments. Herschel, with its superior sensitivity to FIR emission, can detect far colder atomic gas than previous studies. We find a [Oi]/[Cii] ratio about 1 dex smaller than predicted by the otherwise functional Ferland (2009) model. That study considered optically thin emission from a small cell of gas and by design did not consider the effects of reasonable column densities. The line ratio suggests that the lines are optically thick, as is typical of galactic PDRs, and implies that there is a large reservoir of cold atomic gas. This was not included in previous inventories of the filament mass and may represent a significant component.
1 Introduction
The Perseus cluster of galaxies is preeminent among the class of cool-core galaxy clusters (those with gas cooling times shorter than the Hubble time). This is in large part due to its close proximity (), allowing detailed studies to be conducted in varying astrophysical contexts. It is the X-ray brightest galaxy cluster and has a strongly peaked surface-brightness profile. The intracluster gas in the inner few tens of kpc has a very short radiative cooling time (200 Myr to 300 Myr). In the absence of heating, the expected X-ray mass deposition rate is several . FUSE observations, on the other hand, suggest an actual cooling rate of (Bregman et al., 2006) and XMM-Newton RGS observations suggest an even lower residual cooling rate of (Fabian et al., 2006, and references therein).
Perseus is the prototype of cluster radio “mini-haloes” (e.g. Pedlar et al., 1990; Gitti et al., 2002). The brightest cluster galaxy of Perseus (a giant cD galaxy), NGC 1275, is host to a powerful radio source, 3C 84. It has a Seyfert-like spectrum and a bolometric radio core-luminosity of order erg s-1 (e.g Vermeulen et al., 1994). 3C 84 is inferred to undergo episodic bursts of activity, blowing out jets of plasma which interact with the intracluster medium. Chandra X-ray images, when compared with radio emission at different wavelengths (e.g. Böhringer et al., 1993; Fabian et al., 2000; Fabian et al., 2006; Sanders et al., 2005; Sanders & Fabian, 2007) reveal the extent to which the central radio source has caused havoc in the intracluster-medium (ICM) in the form of bubbles of various kinds (inner, outer, ghost), sound waves and shocks. On VLBI/VLBA (milliarcsec) scales, the radio morphology consists of a bright southern jet (e.g. Vermeulen et al., 1994; Taylor et al., 2006) believed to be pointed towards the observer and a dim northern counter jet pointed away. The radio source shows a clear double-lobed morphology on smaller scales () that extends into a more amorphous one on larger scales ().
One of the most intriguing aspects of Perseus is the spectacular network of ionized (H) and molecular (CO and H2) gas filaments well beyond the optical stellar emission of the brightest cluster galaxy (BCG). A significant number of BCGs in cool-core (CC) clusters show similarly extended filamentary structures, such as NGC 4696 (Centaurus), Abell 1795 and Hydra-A (Johnstone et al., 1987; Heckman et al., 1989; Sparks et al., 1989; Crawford et al., 1999; McDonald et al., 2010). The source of excitation of the filaments is currently one of the most pertinent issues in our understanding of CC galaxy clusters. In the case of NGC 1275, the filaments extend as far as kpc out from the cluster-centric AGN, with the mean surface-brightness declining much slower than the inverse-square law. Photoionization from a central AGN thus seems unlikely. Similarly, ionizing radiation from hot stars, such as O and B type, has been ruled out based on anomalous emission lines in the spectra of the filaments (Johnstone & Fabian, 1988; Johnstone et al., 2007; Ferland et al., 2008). Motivated by the observations of strong molecular hydrogen lines in NGC 4696 and NGC 1275, Ferland et al. (2009) showed that non-radiative heating, such as collisional heating from ionizing particles, can produce the observed emission. The importance of collisional excitation by energetic (ionizing) particles was suggested more than two decades ago by Johnstone & Fabian (1988). Candidate sources for these particles are either cosmic rays or the thermal electrons of the X-ray emitting intracluster medium. Motivated by the spatial correspondence between the brightest low-energy X-rays and the H filaments, Fabian et al. (2011) considered the penetration of cold filaments by the surrounding hot X-ray gas through reconnection diffusion. More recently, Sparks et al. (2012) reported a detection with the HST ACS camera and also the COS spectrograph, of [Civ] line emission spatially coincident with the H line emission in M87 in Virgo. The [Civ] line emission is indicative of gas at K. They suggest the origin of this line emission as being due to thermal conduction, i.e., the transport of energy by hot electrons from the hot ICM to the cold filament gas.
Various independent studies have provided strong evidence of the presence of dust in cool-core BCGs. These include dust continuum observations (e.g. Edge et al., 1999; Chapman et al., 2002; Egami et al., 2006; O’Dea et al., 2008; Rawle et al., 2012) and HST observations of BCGs with dust absorption features in them (e.g. McNamara et al., 1996; Pinkney et al., 1996; Laine et al., 2003; Oonk et al., 2011). Furthermore, observations of H2 and CO molecular gas (e.g. Donahue et al., 2000; Edge, 2001; Edge et al., 2002; Salomé et al., 2006) suggest that there are substantial amounts of dust present which provide shielding. In Mittal et al. (2011), we demonstrated the need for an overabundance of dust (low gas-to-dust mass ratio) and metallicity to explain measurements in NGC 4696. In most of the cases, the gas-to-dust mass ratios are consistent with Galactic values (Sparks et al., 1989; Edge, 2001), however, there is clearly an overabundance of dust in the filaments relative to the surrounding hot gas. The origin of the dust in the filaments is not yet clear. More recently, Voit & Donahue (2011) have suggested that the main source of dust in BCGs of CC clusters may be the stars of the central galaxy themselves. Thus, a stellar origin is plausible although in the case of NGC 1275 that seems unlikely given the filaments exist out to a large radius from the galaxy core. Even though the sputtering timescale for dust grains is short compared to the gas cooling time, optical observations have revealed magnificent dust lanes in some objects, which in many cases correlate spatially with the H filaments (Crawford et al., 2005; Sparks et al., 1989; Donahue & Voit, 1993). Fabian (1994) and Voit & Donahue (1995) have proposed that gas-phase reactions create dust in the cold clouds that cool out of the ICM, which can then lead to an increase in dust through accretion onto existing grains. In contrast, several studies argue (e.g. Sparks et al., 1989; Farage et al., 2010) that the ionized gas and dust filaments originate from the stripping of a dust-rich neighbouring galaxy which may be in the process of merging with the BCG. The origin of the molecular and ionized filaments mixed with dust is to date an open question.
In this paper, we present Herschel observations of the core of the Perseus cluster. The main goal of this work is to investigate the source of the various emissions originating from the filaments. Far-infrared data from Herschel (Pilbratt et al., 2010) have proven to be useful diagnostics of the heating mechanisms that account for the filaments in cool-core clusters (e.g. Rawle et al., 2012; Mittal et al., 2011; Edge et al., 2010a, b; Pereira et al., 2010). This work is part of a Herschel Open Time Key Project (PI: Edge) aimed at understanding the origin of cold gas and dust in a representative sample of 11 BCGs. We describe the data used and the analysis in section 2. We present some basic results in section 3 and move on to discuss the heating mechanisms prevailing in the core of NGC 1275 in section 4 and those prevailing in the filaments of NGC 1275 in section 5. We finally give our conclusions in section 6. We assume throughout this paper the CDM concordance Universe, with km s-1 Mpc-1, and . This translates into a physical scale of kpc and a luminosity distance of 75.3 Mpc at the redshift of NGC 1275 (). This distance is consistent with the independent distance inferred from the 2005 Type Ia supernova SN2005mz (Hicken et al., 2009). The right ascension and declination coordinates in figures are in J2000 equinox. Lastly, NGC 1275 comprises two systems – a low-velocity system (LVS) consisting of gas at 5200 km s-1 associated with the BCG and a high-velocity system (HVS) consisting of gas at 8200 km s-1 associated with a foreground galaxy north-west of the BCG. In this work, NGC 1275 refers to the LVS system only unless otherwise mentioned. For calculation of line velocities we assume the velocity of the LVS to be the systemic velocity.
| Line | Peak Rest | ObsID | Duration | Bandwidth | Spectral FWHM | Spatial FWHM | Mode | ||
|---|---|---|---|---|---|---|---|---|---|
| ( m) | (s) | ( m) | (km s-1) | ( m) | (km s-1) | ||||
| OI | 63.184 | 1342189962 | 9600 | 0.266 | 1250 | 0.017 | 79 | 5x5 raster, step size | |
| CII | 157.741 | 1342214362 | 8600 | 1.499 | 2820 | 0.126 | 237 | 5x5 raster, step size | |
| NII | 121.90 | 1342214363 | 3440 | 1.717 | 4180 | 0.116 | 280 | pointed | |
| OIb | 145.525 | 1342202581 | 3440 | 1.576 | 3215 | 0.123 | 250 | pointed | |
| OIII | 88.356 | 1342214363 | 3680 | 0.495 | 1660 | 0.033 | 110 | pointed | |
| SiI | 68.473 | 1342202581 | 3840 | 0.218 | 945 | 0.014 | 62 | pointed | |
2 Data and analysis
2.1 Herschel data
We used the PACS spectrometer (Poglitsch et al., 2010) to observe the [Cii] line at 157.74 m and the [Oi] line at 63.18 m, the two primary coolants of the interstellar-medium (ISM). The [Cii] and [Oi] fine-structure lines are very often the brightest emission lines in galaxy spectra. In addition, we observed [Oib] at 145.52 m, [Sii] at 68.470 m, [Nii] at 121.90 m and [Oiii] at 88.36 m. The [Oi] and [Cii] lines were observed in the raster-mapping mode, consisting of 5 raster lines and 5 points per line with a line step of , whereas the rest of the lines were observed in a single-pointing mode. The observational parameters are summarized in Table 1. The line observations were conducted in the line-spectroscopy mode using the chopping and nodding technique (using a chopper throw of ) to subtract the telescope background, the sky background and the dark current.
The PACS photometric observations were made in large-scan mapping mode at a speed of s-1 at blue-short (BS) (70 m), blue-long (BL) (100 m) and red (R) (160 m) wavelengths (PI: E. Sturm, ObsIDs: 1342204217, 1342204218, 1342216022 and 1342216023). The scans consisted of 18 scan line legs of length and of a cross-scan step of . The “scan” and orthogonal “cross-scan” observations were individually calibrated before being combined into a single map of . The PACS photometer has a resolution of and at 70 m, 100 m and 160 m respectively. The PACS photometer performs observations at BS and BL simultaneously with the R band so we have two sets of scans in the R band. The SPIRE photometric observations was also made in the large-scan mapping mode and the data were recorded simultaneously at 250 m, 350 m and 500 m (PI: E. Sturm, ObsID: 1342203614). The SPIRE photometer (Griffin et al., 2010) has a resolution of about , and at these wavelengths, respectively.
The basic calibration of the data (spectral and photometric) was done using the Herschel Interactive Processing Environment (HIPE) (Ott, 2010) version 7.0 CIB 1931. For the PACS spectral data, the standard pipeline routines described in the PACS data reduction guideline (PDRG) were adopted to process the spectral data from their raw to a fully-calibrated level. HIPE 7.0.1931 contains PACS calibration files that provide the response calibration based on in-orbit measurements. Hence, no ground-to-flight correction factors had to be applied. The PACS cubes were rebinned in wavelength using the Nyquist-Shannon sampling, corresponding to oversample=2 and upsample=1. The spatial full-width at half maximum (FWHM) varies from for the [Sii] 68.47 m line to for the [Cii] 157.74 m line. The line fluxes were determined using the method described in Mittal et al. (2011). Briefly, the routine specproject was used to obtain a final projection of the different pointings and nods onto the sky plane. These maps can be readily used to conduct ‘aperture photometry’ and measure fluxes. For PACS photometry, the data were reduced using the pipeline for the ScanMap observing mode, particularly designed to detect extended emission (). The pipeline employs a second-level deglitching algorithm, which uses the redundancy in a pixel to flag outliers, so that bright sources are not erroneously flagged as glitches. For SPIRE photometry, the data were reduced using the pipeline for the LargeScanMap observing mode and the naïve map-maker.
2.2 H data
The H flux measurements were made using the continuum-subtracted data from Conselice et al. (2001). Based on comparison with our newer HST data (Fabian et al., 2008), the calibration of the WIYN data appears to over-estimate the flux by a factor of about three. The source of this discrepancy is yet not clear and is under thorough investigation (Johnstone et al. 2012, in prep.). To verify the calibration offset of the WIYN continuum-subtracted image, we calculated the total flux in the WIYN H image in counts s-1 and converted it into erg s-1 cm-2 using the conversion given in Conselice et al. (2001). We were only able to derive the total luminosity quoted in Conselice et al. (2001), and which is in good agreement with Heckman et al. (1989), after lowering the total flux by a factor of three. Hence we have scaled down the measured WIYN H fluxes by a factor of three.
The HST broad band filter F625W admits light from the [Oi], [Nii] and [Sii] doublets as well as H. The ratios of these lines to H are variable with position in the nebula. Such spectroscopic data are available for only a small fraction of the total area covered by the entire nebula. For the WIYN data the contamination is only from the [Nii] doublet. This is the main reason why we prefer to use the WIYN data.
Hatch et al. (2006) found a radial gradient in the ratio [Nii]/H, which may be due to a spatially varying metallicity or excitation mechanism (see also Johnstone & Fabian, 1988). They used the multi-object spectrograph instrument on Gemini and found that the [Nii]/H ratio varies from 0.5 to 0.85 in the Horseshoe region. Assuming that the [Nii]/H ratio does not change significantly with azimuthal angle, we subtracted the contribution of [Nii] from the measured H flux in the Horseshoe, southwest and Blue Loop knots, using an average ratio of [Nii]/H=0.65. The Gemini measurement close to the nucleus indicates a [Nii]/H ratio close to unity, therefore we halved the measured H flux in the core region. Similarly, we also corrected for the [Nii]6548 line, usually a third in intensity of the [Nii] line (Hatch et al., 2006).
Due to the uncertainties in the [Nii]/H ratio and the calibration of the WIYN data, we caution the reader concerning the absolute values of the H fluxes. However, the relative values of H flux between spatial positions should be accurate. The H amplitude plays a role in section 4, where the Herschel and H measurements are used as constraints to determine the heating mechanisms giving rise to the various emissions. Fortunately, there are enough FIR-derived constraints that the best-fit model parameters do not rely solely on the H flux measurement.
2.3 Dust Extinction
SCUBA observations of NGC 1275 have been used to infer the presence of a large amount of dust () present (Irwin et al., 2001). The source of dust is not yet clear and understanding it is one of the goals of this study. However, dust also presents a hindrance due to the extinction it causes at optical and higher frequencies. In this work, both the Galactic and internal extinction corrections, such as for H (section 2.2) and far-ultraviolet measurements (section 4.3), were calculated with the help of the mean extinction laws given in Cardelli et al. (1989). We assumed the Galactic extinction law, , and an value of 0.163 from the NASA/IPAC Extragalactic Database (NED111http://nedwww.ipac.caltech.edu). Internal extinction was calculated using the observed Balmer decrements, which were compared to the Case-B value of H/H= 2.86. For the filaments located far out from the core, an internal extinction of was estimated based on the Galactic-extinction corrected Balmer decrement, H/H= 4.2, as measured in the Horseshoe knot (Ferland et al., 2009). For the core, a similar internal extinction was estimated, , based on the Galactic-extinction corrected Balmer decrement, H/H=4.08, as measured SW of the nucleus by Kent & Sargent (1979). Note that Kent & Sargent (1979) obtain an internal reddening of assuming a Galactic extinction of . We obtain a lower internal reddening due to the higher Galactic extinction adopted.
The correction factor for the internal reddening is model-dependent. If the H and H emissions are produced by another mechanism than case-B recombination, then the Balmer decrement will be different from the expected value of 2.86. For example, if particle heating is responsible for the H and H emissions, then the intrinsic Balmer decrement will be higher and consequently the deduced internal reddening lower.
3 Results
| Line | (m) | Offset (km s-1) | FWHM (km s-1) | Line Flux | Spatial Extent (Radius) | |||
|---|---|---|---|---|---|---|---|---|
| zbcg | zcl | Obs. | Intrinsic | ( W/m2) | (′′) | (kpc) | ||
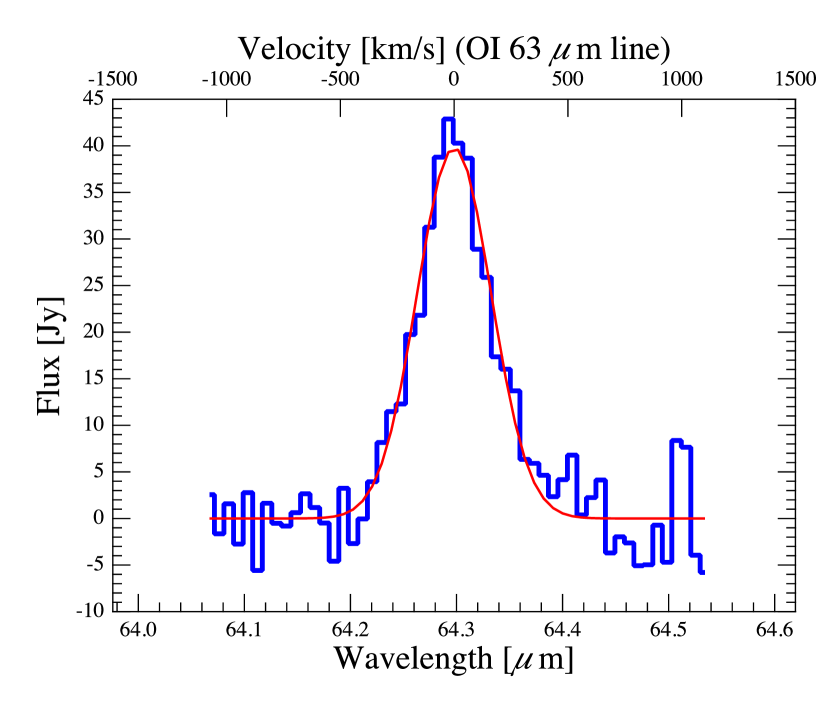
| [Oi] | 64.2980.002 | 399 | -619 | 38320 | 37520 | 2525.873.7 | 12 | |
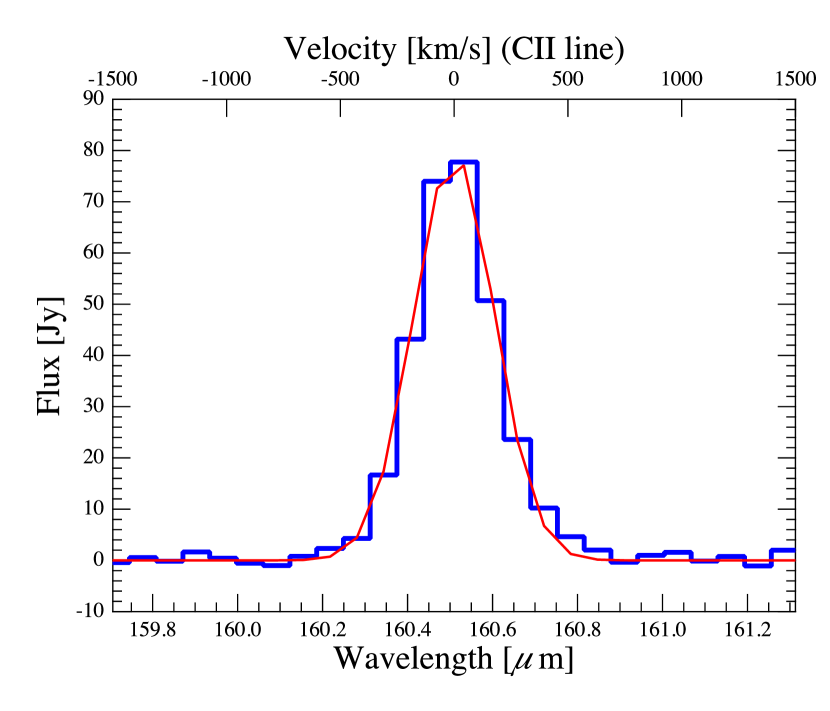
| [Cii] | 160.5100.002 | -0.64 | -1004 | 4199 | 34711 | 2205.326.5 | 25 | |
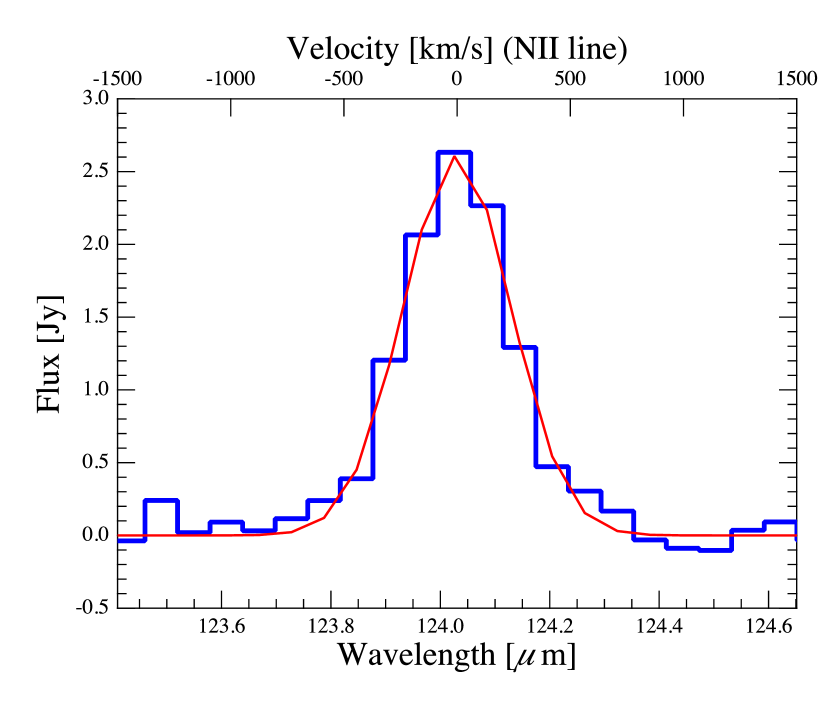
| [Nii] | 124.0310.004 | -2410 | -12410 | 55822 | 48225 | 125.02.8 | 10 | |
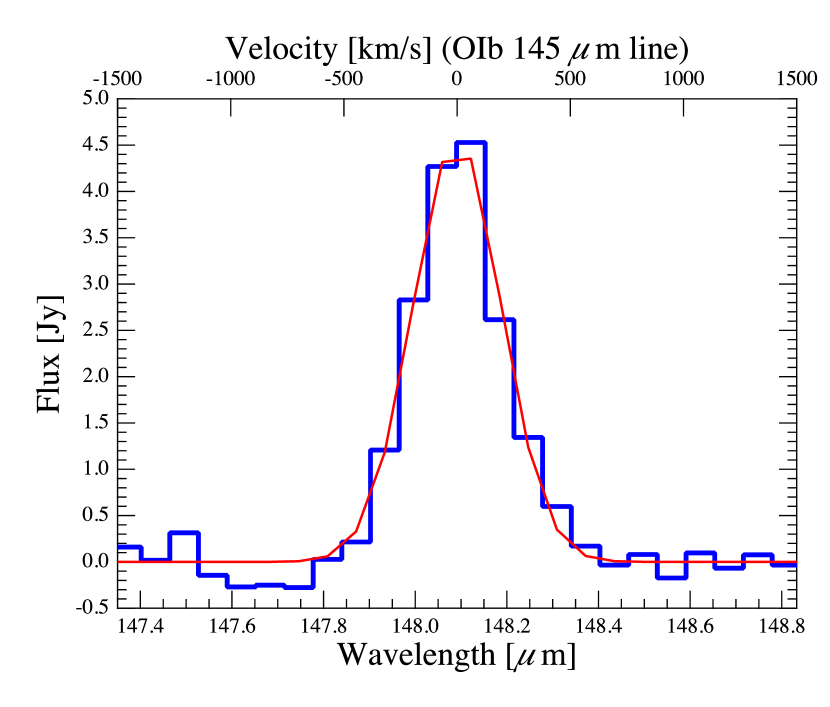
| [Oib] | 148.0910.003 | 327 | -687 | 45817 | 38420 | 150.53.1 | 10 | |
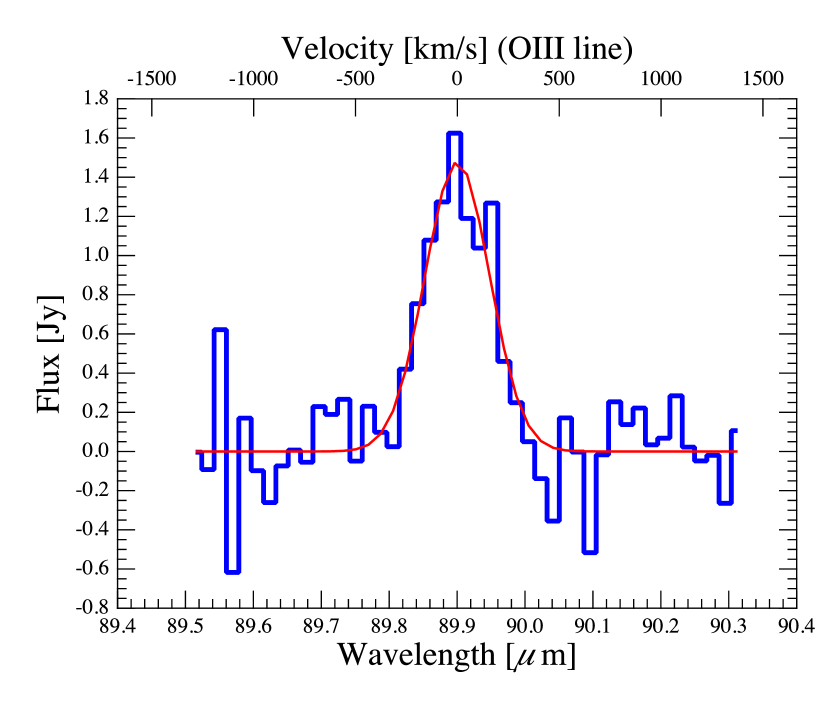
| [Oiii] | 89.9000.005 | -3717 | 13717 | 37542 | 35844 | 65.64.1 | ||
| [Sii] | … | … | … | … | … | … | … | |
Of the six lines observed, we detected all except [Sii] at 68.47 m. Even though only [Cii] and [Oi] observations were designed to detect extended emission, all the detected lines except [Oiii] are spatially extended. The integrated line profiles are shown in Fig. 1 and their relative spatial extensions in Fig. 2, where the pixel threshold has been set to SNR2. The SNR corresponds to the ratio of the line peak to the standard deviation of the data about the fitted model. Listed in Table 2 are the integrated line properties.
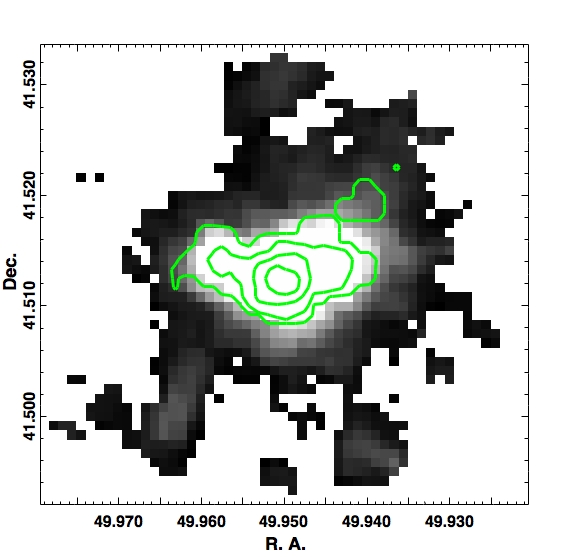
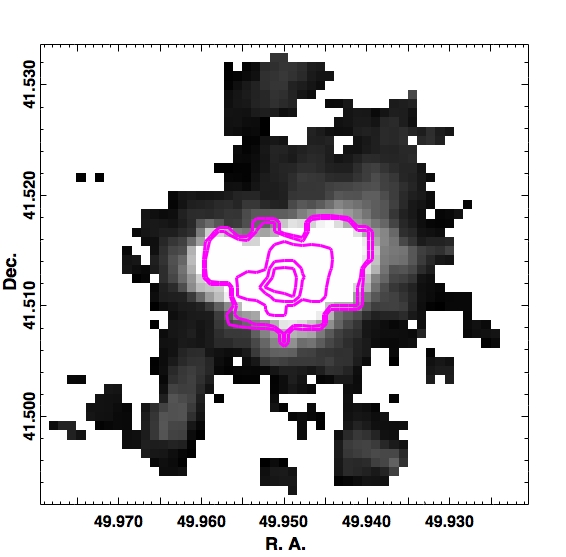
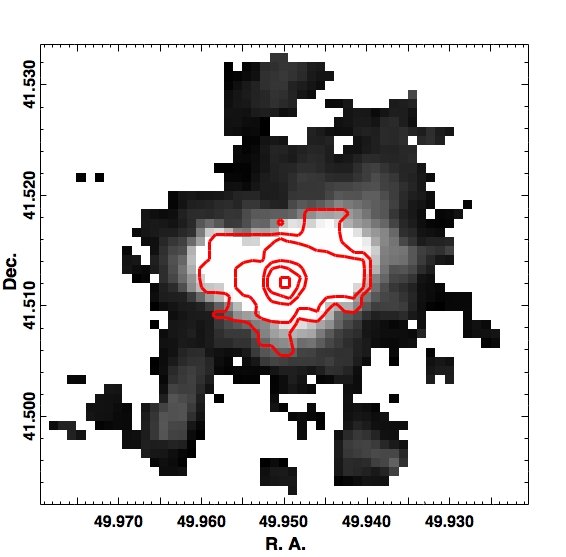
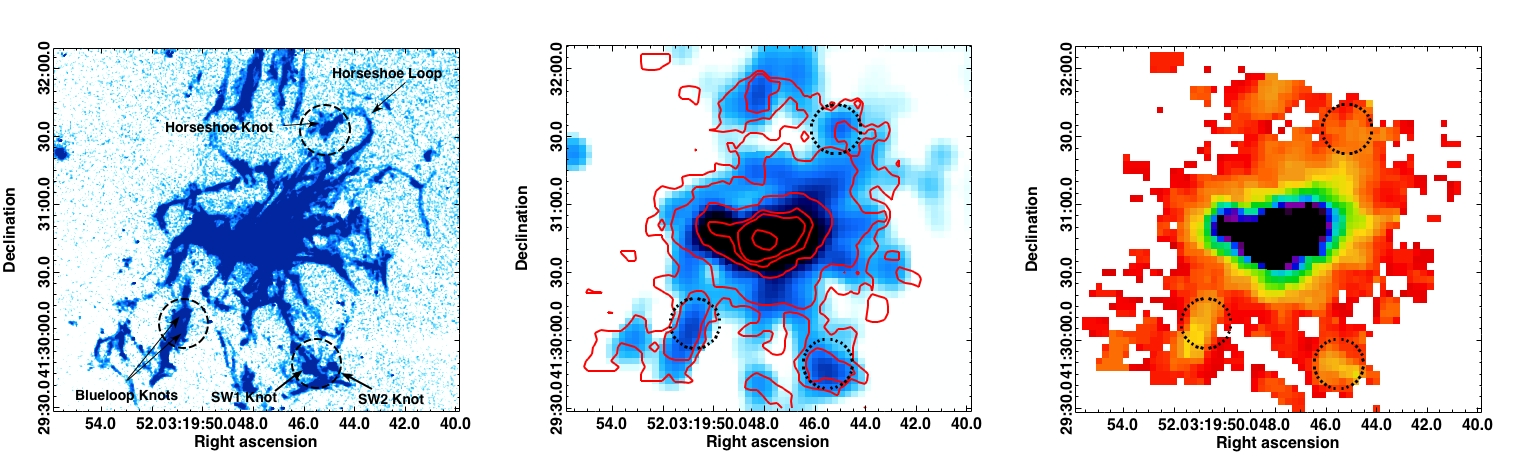
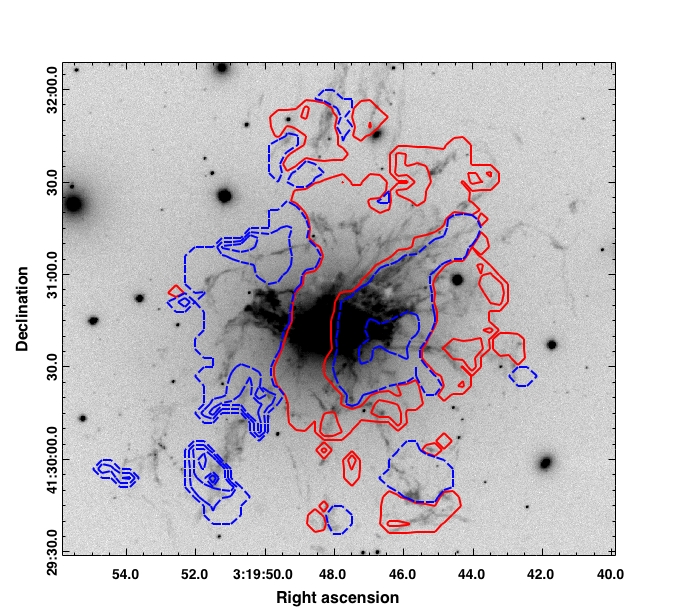
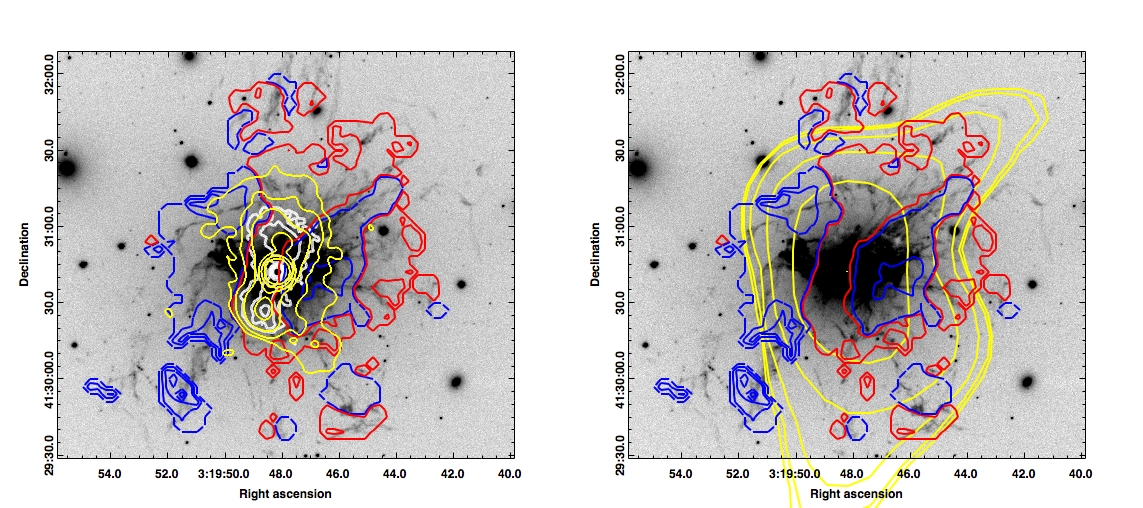
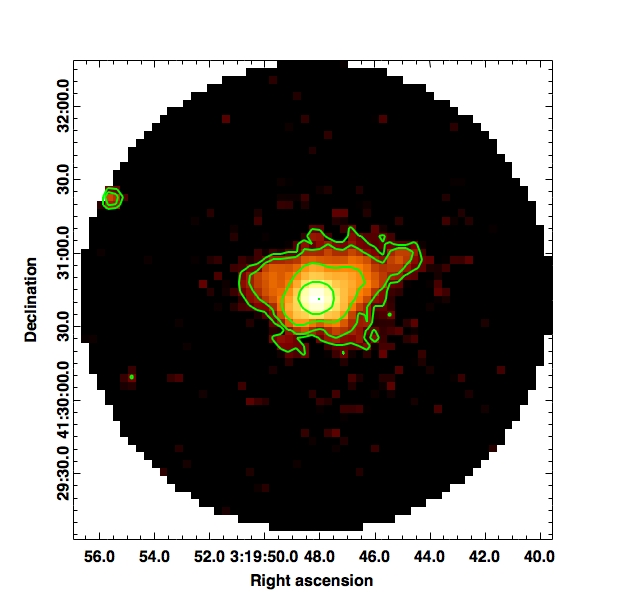
The [Cii] line is detected over a spatial region of extent (50 kpc). Shown in the left panel of Fig. 3 is a H+[Nii] image displaying the ionized gas filaments taken with the WIYN 3.5 m telescope (Conselice et al., 2001). Shown in the right panel of Fig. 3 is the FIR [Cii] emission with the pixel detection threshold set to SNR . The middle panel displays the H emission smoothed to match the resolution of the [Cii] line using the ciao tool ‘aconvolve’ and the pyraf tool ‘blkavg’, with the [Cii] line contours overlaid (in red). The [Cii] emission traces the H emission very well despite a much lower resolution. Both [Cii] and H reveal a central elongation, about 20 kpc in total extent, with an east-west alignment. This elongation is clearly visible also in the recent narrow-band imaging of a ro-vibrational transition line of molecular hydrogen (H2) (Lim et al., 2012), which shows very good overall morphological resemblance with H emission. In Mittal et al. (2011), we showed a close spatial and kinematical correspondence between different emissions, such as H and [Cii], in NGC 4696, the BCG of the Centaurus cluster. NGC 1275 shows a similarly tight correlation, both spatial and kinematical, between [Cii], H and CO (section 3.1), suggesting a common heating process of the gas.
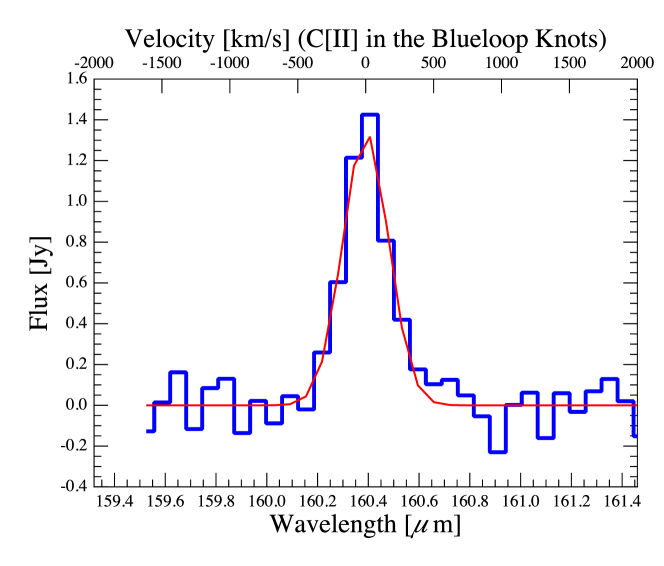
There are three well-studied regions in the H filaments, seen also in the [Cii] map, which we describe briefly below: (1) The Horseshoe is a filament to the north-west of the center of BCG (Conselice et al., 2001). The filament of gas appears to originate in the core of the galaxy, rising a projected distance of 26 kpc through the ICM before looping around towards the center again. (2) The southwest knots, at a projected distance of kpc from the center of the BCG, are a part of the southern filaments. 3) The knots in the southeast filament, also known as the ‘Blue Loop’, are at a projected distance of kpc. The loop is so called due to the blue optical colour of the knots this region, indicating these are star forming sites. Canning et al. (2010) studied this region in detail and found a star formation rate of . We refer to the knots as the ‘Blue Loop’ knots from now on. All three regions have been studied in detail previously at several wavelengths (Conselice et al., 2001; Salomé et al., 2006; Salomé et al., 2008; Canning et al., 2010; Salomé et al., 2011; Hatch et al., 2005, 2006; Fabian et al., 2003, 2008; Johnstone et al., 2007; Ferland et al., 2009).
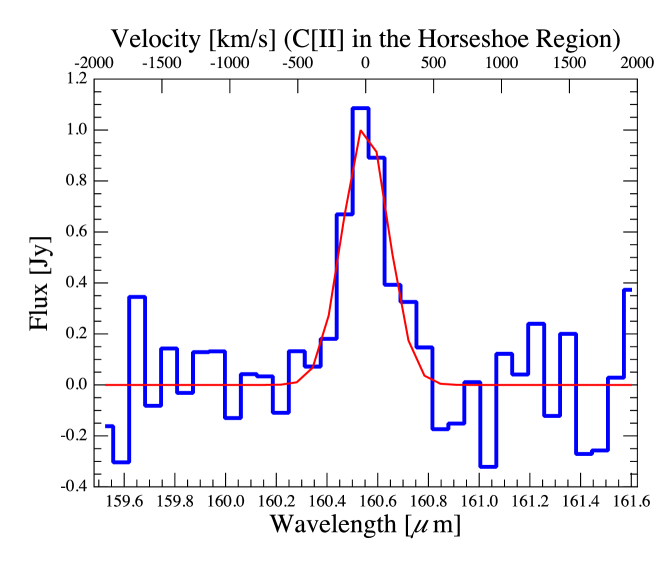
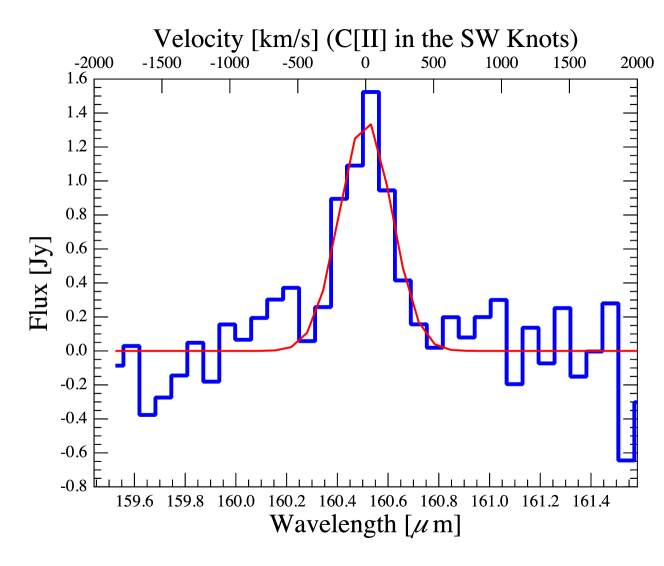
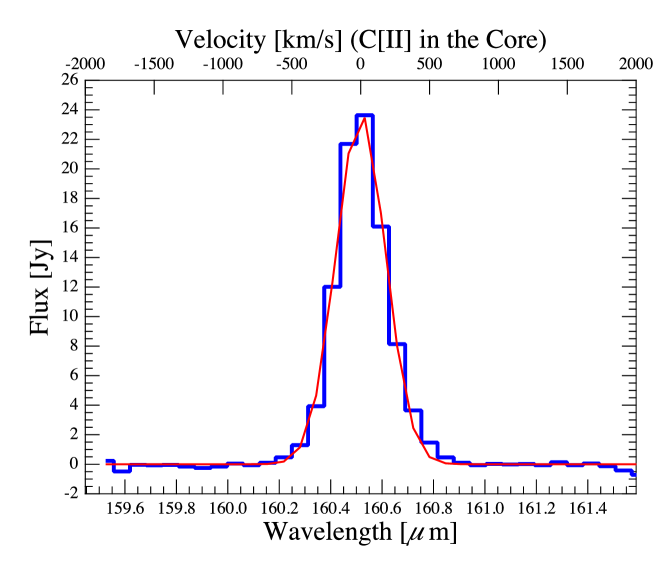
The three regions are marked in Fig. 3. We extracted the [Cii] line spectra from them and the core region (see below). The spectra are shown in Fig. 4. The Horseshoe region is weaker in [Cii] emission than the SW and Blue Loop knots. This is consistent with the study of Salomé et al. (2011), where they find this region has weaker CO emission in comparison with other filaments. There is no detection of [Oi] in any of the three regions of the filaments. The line strengths and ratios in these regions and the core provide strong constraints for studying the excitation mechanism(s) in different parts of the BCG. This is followed-up in detail in section 5.
Brauher et al. (2008) report a flux of W m-2 for [Oi] and W m-2 for [Cii], based on observations with the Long Wavelength Spectrometer (LWS) on the Infrared Space Observatory (ISO). While the [Oi] flux measurement of W m-2 obtained in this study compares well with the ISO measurement, our [Cii] flux of W m-2 is higher by a factor of two. The reason for this discrepancy is that Brauher et al. (2008) obtain the [Cii] flux based on the assumption that NGC 1275 is a point source. The FWHM of the LWS is . However, [Cii] emission clearly extends beyond the FWHM of the LWS ( in diameter). For this reason, we believe that Brauher et al. (2008) underestimate the line flux in [Cii] by about a factor of two. As a rough check of this hypothesis, we convolved our [Cii] map with a gaussian with a FWHM of and obtained a flux of W m-2 within a aperture diameter. Despite the fact that this test uses a simple gaussian rather than the true ISO LWS beam profile, the reduction of measured flux is consistent with the result of Brauher et al. (2008).
3.1 Kinematics
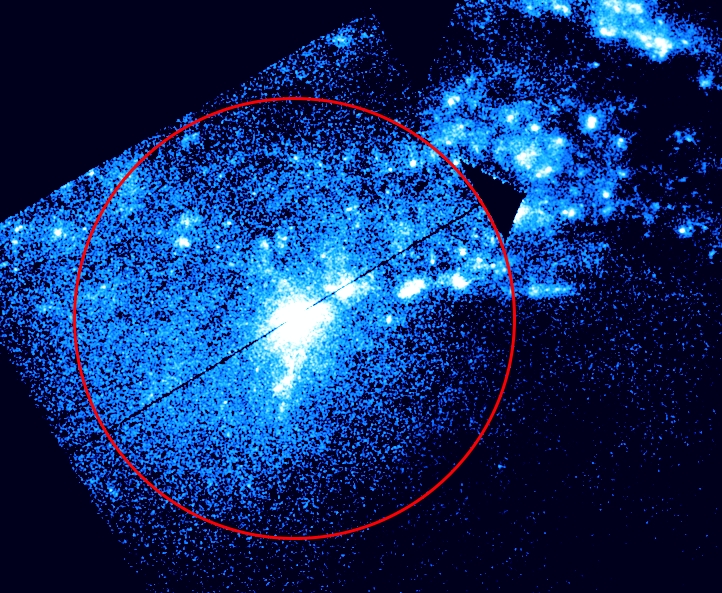
Fig. 5, the [Cii] velocity distribution shows the full extent of the complex kinematical structure of the filaments in NGC 1275. The colour scheme is such that the red shaded regions represent redshifted gas (with positive velocities with respect to the systemic velocity of the BCG), whereas green and blue shaded regions represent blueshifted gas (with negative velocities with respect to the systemic velocity of the BCG). The velocity pattern is likely to be the combination of inflowing and outflowing gas, along with projection and small-scale rotation effects (see below).
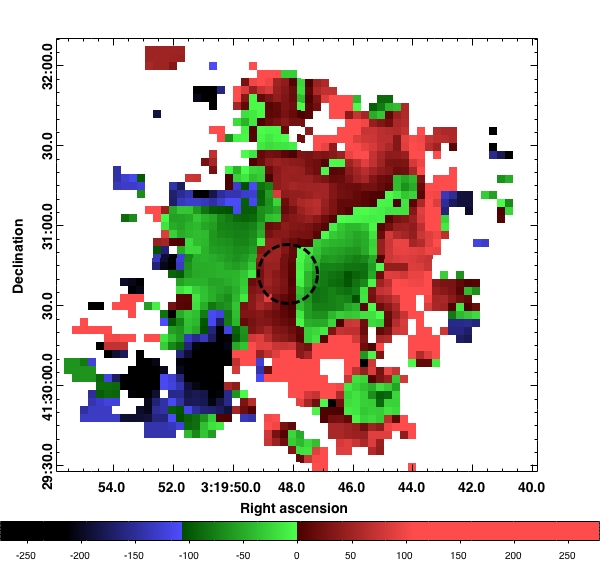
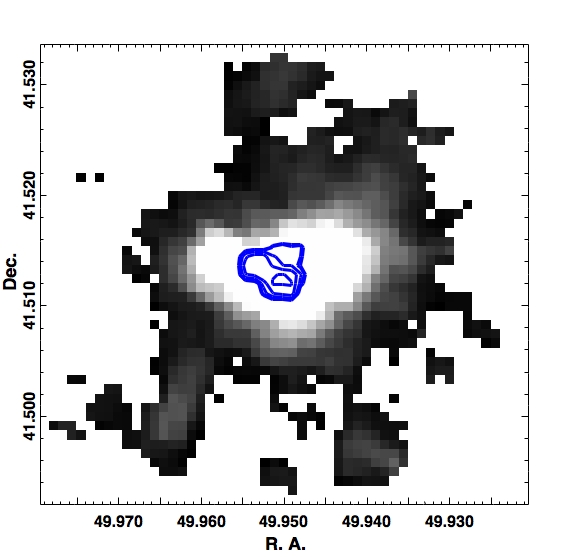
The dashed circle at the center marks the ‘core’ region (see Table 7), which shows a gradient in the [Cii] line velocity. Wilman et al. (2005) conducted near-infrared spectroscopy of the central region in NGC 1275 with the UIST IFU instrument on the United Kingdom Infrared Telescope. They detected ro-vibrational H2 emission originating from a region pc from the nucleus, with the results indicating a strong velocity gradient in the peak position of the H2 line. The measured rotation curve in the central IFU slit placed east-west along the nucleus shows a velocity change from 150 km s-1 east of the nucleus to -100 km s-1 west of the nucleus. From the sharp decrease in the magnitude of the velocity on either side of the nucleus, they concluded that the molecular gas is distributed in a disk-like structure with the rotation axis oriented north-south. This is also consistent with the double-horn structure seen in the CO(2-1) spectrum extracted from the same core region (Salomé et al., 2011), which may be interpreted as indirect evidence for a central rotating disk. The resolution of the [Cii] data is not good enough to resolve any rotational structure over the scales observed by Wilman et al. (2005). The smallest structure in [Cii] that can be resolved is about 4 kpc. Similarly, the spectral resolution of the [Cii] data (230 km s-1) is much poorer than that of the CO(2-1) line observed with the IRAM 30 m telescope on Pico Veleta (40 km s-1). From Fig. 5, the rotational pattern claimed by Wilman et al. (2005) and Salomé et al. (2011) is not surprising. However, it is difficult to say whether the double horn feature is due to small-scale disk-like rotation or large-scale flows. If there is a rotating disk present in the center, it involves a relatively small gas disk of kpc radius. The majority of the gas distribution sampled by [Cii] does not show any regular rotation.
Also interesting is the redshifted ridge of gas passing through the center of the BCG with a north-south extension. The CO velocity measurements made by Salomé et al. (2011) in regions 4 and 21 marked in Fig. 1 of their paper provide a confirmation of the presence of this redshifted gas (also see Lim et al., 2008). This wide vertical distribution of gas has a cylindrical symmetry and is suggestive of material being dragged upward and downward.
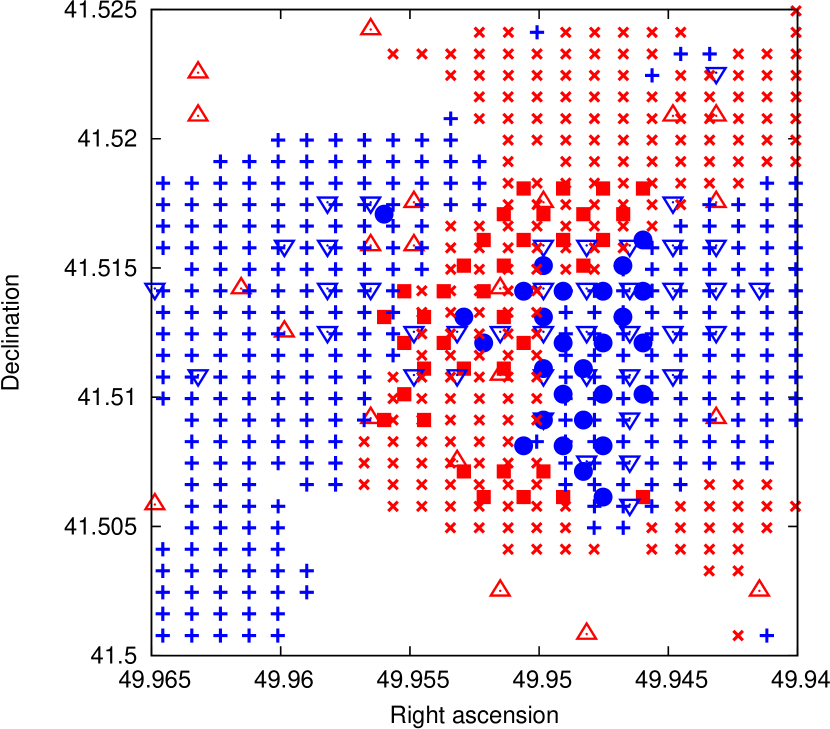
The upper left panel of Fig. 5 shows that there is a negative velocity region on either side of the center along the east-west direction. The east region extends all the way along to the south, where it merges with the Blue Loop knots. The blueshifted components on both sides of the major axis of the emission are also visible in the kinematics inferred from the CO spectra (Salomé et al., 2006). The CO flux and velocity distribution shows a close association with the optical filaments seen in H (e.g. Salomé et al., 2006). In Fig. 6, we show the kinematics of the gas in the inner x in three phases – optical, FIR and millimeter – as represented by H [taken from Conselice et al. (2001)], [Cii] and CO(2-1) [taken from Salomé et al. (2006)] line emissions. This plot shows a clear overlap in the redshifted gas, with absolute velocities greater than 5264 km s-1 (red symbols), along the ridge associated with all three line emissions. Similarly, there is an overlap in the blueshifted gas, with absolute velocities less than 5264 km s-1 (blue symbols), west of the ridge. Especially remarkable is the curvature in the ridge seen in both H (red filled squares) and [Cii] (red crosses). From this we conclude a kinematical correlation among [Cii], H and CO emissions, which further reinforces the idea that different emissions have the same origin.
Radio observations of central radio sources often provide useful insights in understanding the kinematics of cool-core BCGs. Overlaid on the bottom panels of Fig. 5 are contours of the radio emission associated with 3C 84 at 1.4 GHz and 74 MHz. The bottom left panel shows 1.4 GHz radio emission at two different resolutions – (white contours; courtesy of VLA/NRAO222The National Radio Astronomy Observatory is a facility of the National Science Foundation operated under cooperative agreement by Associated Universities, Inc.) and (yellow; kindly provided by Greg Taylor). The higher resolution contours reflect a north-south radio morphology, demonstrating a good alignment with the redshifted [Cii] contours. The lower resolution contours reflect an inverted-S shaped morphology, previously noted in several studies (e.g. Pedlar et al., 1990; Böhringer et al., 1993; Fabian et al., 2000). Although the southern jet shows a correlation with the [Cii] emission, the tip of the northern jet does not. The 74 MHz contours (also kindly provided by Greg Taylor), shown in yellow in the bottom right panel, indicate a reversal of the east-west component of the jet direction on both sides of the core, wherein the northern jet once again overlaps with the [Cii] emission. Conselice et al. (2001) noted a similar alignment between the linear extension of the H filaments to the north and the low-brightness radio emission seen at low frequencies.
Several studies have presented scenarios wherein radio outbursts are responsible for the dredge-up of cold, metal-rich gas from the core in the direction of the buoyantly rising radio plasma (e.g. Simionescu et al., 2008; Simionescu et al., 2010; Gitti et al., 2011; Revaz et al., 2008; Tremblay et al., 2012a, b). Evidence for these scenarios is based on the X-ray-derived temperature and metallicity maps, which show a spatial correlation between radio emission and cool gas extending away from the core with a metal content higher than that of the ambient medium. The positive correlation between the radio emission and the redshifted ridge of [Cii] gas in NGC 1275 is reminiscent of cold gas being dredged up by the radio lobes. On the other hand, this interpretation implies that both the radio jets (jet and counter-jet) are pointed away from the line-of-sight. On milliarcsec scale, the radio morphology comprises a one-sided jet, such that the southern jet is deemed to be approaching, and the northern jet (counter-jet) receding (e.g. Pedlar et al., 1990; Vermeulen et al., 1994; Dhawan et al., 1998; Taylor et al., 2006). Both the radio jets reveal complex kinematics in the plane of the sky. The southern jet is initially elongated along position angle (PA) (at mas) but suddenly bends toward PA (at mas) and continues though a series of such bends, at approximately the same angles, out to about an arcminute (Pedlar et al., 1990; Dhawan et al., 1998). The northern jet exhibits a similar complex structure. On the kiloparsec scale, it is therefore possible that, similar to the kinks observed in the plane of the sky, the jets undergo bends along the line-of-sight, such that both the jets are receding. There are dredge-up interpretations offered for NGC 1275, suggesting that H gas is being dredged up by the radio source. Fabian et al. (2003) recognized two filaments in the north-west, including the Horseshoe, bent on either side of the north-west ghost bubble. They showed that the H emission associated with the Horseshoe is just behind the bubble and is likely dragged out by it. Similarly, Sanders et al. (2005) discovered a high-abundance ridge using Chandra observations, which they hypothesized is formed by material entrained by a fossil radio bubble.
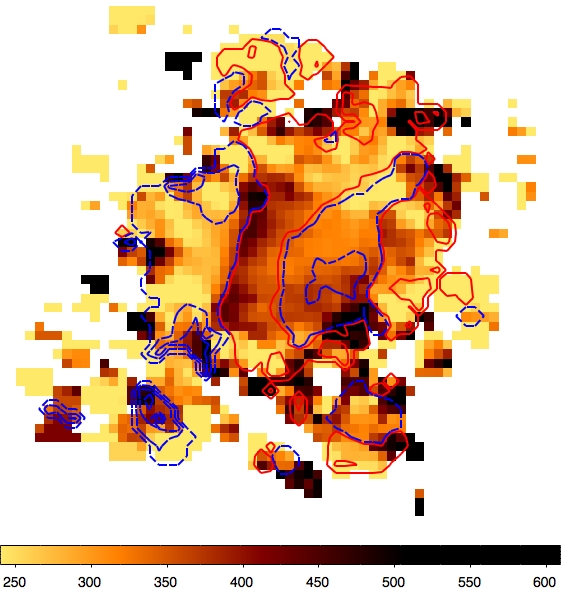
Lastly, the [Cii] velocity structure may be related to the disordered motion of gas clouds at larger radii that is not affected by the inner radio structure. Shown in Fig. 7 is the [Cii] linewidth in km s-1. An interesting feature of this map is that one of the regions the linewidth peaks is adjacent to the redshifted ridge where the line velocity flips from positive to negative on the eastern side of the galaxy. This is where the CO(3-2) HARP maps shows double lines implying that there are multiple gas components along the line of sight (Edge et al., in prep.). However, the linewidths in this region may also be high due to the superposition of rapidly varying line-of-sight velocity elements.
3.2 Spatial variation of [Oi] to [Cii] ratio
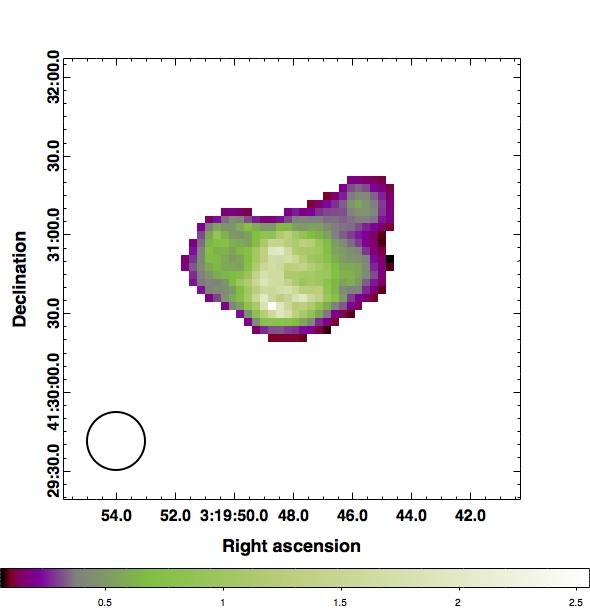
Here we briefly discuss the spatial variation of [Oi] to [Cii] ratio and what may be inferred from it. The resolution of [Cii] line is slightly poorer than the [Oi] line. For compatibility, we convolved the [Oi] line map with a gaussian such that the resulting FWHM is similar to that of the [Cii] line. Fig. 8 is obtained by dividing the resulting smeared [Oi] map by the [Cii] map (the threshold for both [Cii] and [Oi] was set to SNR2). This figure indicates that while [Oi] is stronger than [Cii] in the core, the opposite is true at larger radii, namely, the [Cii] line emission becomes stronger at radii larger than 4 kpc, which corresponds to the spatial resolution of [Cii].
The relative strength of [Oi] to [Cii] is an indicator of gas density, such that a higher [Oi]/[Cii] ratio represents a higher density gas for the reasons described in section 4.1. Hence a higher [Oi]/[Cii] ratio in the center implies a relatively denser gas in the cluster core, as expected.
3.3 Dust SED
| (m) | Instrument | Year | Aperture | Flux (mJy) |
|---|---|---|---|---|
| 20 | SPITZER IRSd | 2004 | – | 2410241 |
| 25 | IRASc | 1983 | – | 3539176 |
| 30 | SPITZER IRSd | 2004 | – | 3820382 |
| 60 | IRASc | 1983 | – | 7146286 |
| 70 | PACS Herschela | 2011 | 7405741 | |
| 100 | PACS Herschela | 2010 | 8541854 | |
| 160 | PACS Herschela | 2010 | 69791396 | |
| 250 | SPIRE Herschela | 2010 | 3805571 | |
| 350 | SPIRE Herschela | 2010 | 3095464 | |
| 500 | SPIRE Herschela | 2010 | 2992449 | |
| 1153 | IRAM PdBb | 2010 | – | 72201083 |
| 1303 | IRAM PdBb | 2010 | – | 77411161 |
| 1428 | IRAM PdBb | 2010 | – | 72991095 |
| 2710 | IRAM PdBb | 2010 | – | 100001500 |
| 2913 | IRAM PdBb | 2010 | – | 107131607 |
| 3019 | IRAM PdBb | 2010 | – | 103301550 |
| 20675 | UMRAOe | 2010 | – | 23230130 |
| a This work. The errorbars correspond to the absolute flux uncertainties: 10% at PACS BS and BL and 20% at R, and 15% at all SPIRE wavelengths; b Trippe et al. (2011); c Moshir et al. (1990); d Weedman et al. (2005); e University of Michigan Radio Astronomy Observatory data for year 2010 (courtesy of M. Aller and H. Aller). | ||||
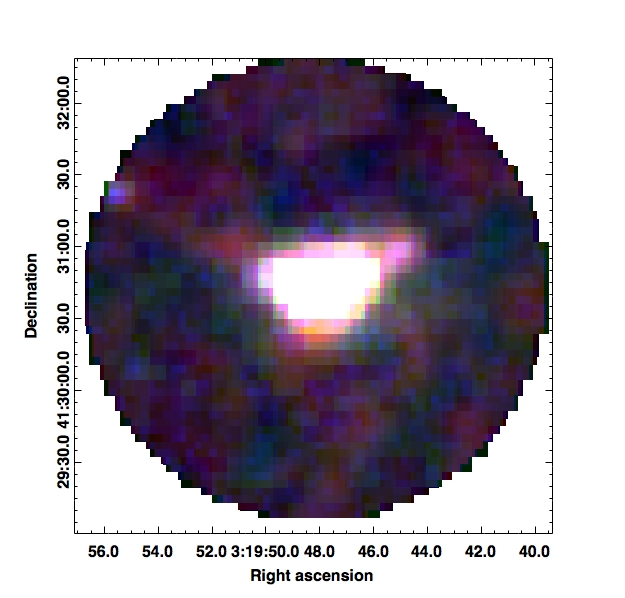
We detected emission at all three PACS wavelengths and all three SPIRE wavelengths. The PACS images are shown in Fig. 9. Dust emission can usually be modelled as a simple modified black body function; NGC 1275, though, poses a complication. This is because of the strong radio source at the center of NGC 1275, with a large contribution in the sub-millimeter and FIR range (Irwin et al., 2001). The radio source, additionally, shows a large-amplitude variability on timescales of decades (see Nagai et al., 2012, and references therein). Detailed monitoring at 3 mm has shown an increase in flux from 3.5 Jy in 2002 to 11 Jy in 2010 (Trippe et al., 2011).
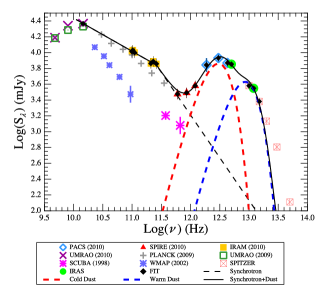
In order to obtain accurate dust parameters, it is essential to estimate the fraction of the FIR flux originating from the synchrotron emission from 3C 84. In the following, we attempt to simultaneously fit the dust and AGN emissions. We list in Table 3 and show in Fig. 10 the various flux measurements (black filled diamonds) that were used to obtain an optimal model. While the dust contribution to the SED is constrained by the PACS (blue open diamond) and SPIRE (red filled triangles) data, the synchrotron contribution is constrained by radio and sub-mm data. The two sub-sets of sub-mm flux-densities clustered around 1 mm and 3 mm (yellow filled squares) correspond to the IRAM Plateau de Bure Interferometer (Trippe et al., 2011) observations. These measurements are from a monitoring program and chosen so as to be closest in time (spanning days between 2010-08-21 to 2010-08-29) to the SPIRE and PACS observations. The 5 GHz, 8 GHz and 15 GHz radio measurements (purple diagonal-plus symbols) correspond to the observations made in 2010 with the 26-m telescope at the University of Michigan Radio Astronomy Observatory (UMRAO, courtesy of M. Aller and H. Aller). We used only the 15 GHz data point for the fitting since the spectrum turns over below this frequency, indicative of synchrotron self-absorption. The 50 m and 25 m measurements (green filled circles) correspond to the IRAS observations (Moshir et al., 1990). To obtain a robust estimate of the temperature and mass of the plausible second (warm) dust component, we also used the 20 m and 30 m continuum data (red open crossed-squares) determined from the Spitzer IRS observations (Weedman et al., 2005). We did not fit 6 m, 10 m and 15 m data due to a possibly increasing contribution from a passively evolving population of stars at wavelengths m. The AGN synchrotron contribution to the total emission is expected to be small at wavelengths shorter than 70 m and so the variation in the flux density due to the different times of the IRAS/Spitzer observations from the rest of the fitted data can be neglected.
To model both the components - the dust emission and AGN synchrotron emission - we used the following fitting function:
| (1) |
| (2) |
| (3) |
Eqn. 2 quantifies the synchrotron emission assumed to have a broken powerlaw form. denotes the normalization at 100 GHz (3 mm), and and the (negative) powerlaw indices on either side of the powerlaw break frequency, , respectively ( representing the powerlaw at radio frequencies and representing the powerlaw at submm/FIR frequencies). We find that for NGC 1275 it is not necessary to modify the synchrotron emission with an exponential term like Privon et al. (2012) did to model the spectrum of Cygnus A. The need for including an exponential term in the case of Cygnus-A arises from the lack of synchrotron emission beyond the submm regime. NGC 1275, on the other hand, shows evidence of an AGN contribution all the way out to submm and, possibly, IR wavelengths (Krabbe et al., 2000). Hence, we preferred a broken powerlaw, such that , to an exponential term to represent the slowly decaying synchrotron emission.
| Parameter | |||
| Cold dust temperature, | (38.02.0) K | (35.01.6) K | (31.81.3) K |
| Cold dust mass, | |||
| Warm dust temperature, | (115.58.5) K | (107.07.4) K | (95.76.0) K |
| Warm dust mass, | |||
| Synch. powerlaw norm., S0 | (10434393) mJy | (10364393) mJy | (10448393) mJy |
| Synch. powerlaw index 1, | -0.410.02 | -0.420.02 | -0.410.02 |
| Synch. powerlaw index 2, | -1.080.28 | -0.920.24 | -0.830.21 |
| Synch. powerlaw break frequency, | (2.60.5) Hz | ( 2.60.6) Hz | (2.50.7) Hz |
| Derived Quantities | |||
| Dust luminosity (8 m-1000 m), | (1.40.05) | (1.30.05) | (1.30.05) |
| Star formation rate, SFR | 241 | 231 | 221 |
| Total gas-to-dust mass ratio | 4500 to 7800 | 5000 to 8000 | 5300 to 9200 |
Assuming the dust to be in thermal equilibrium, Eqn. 3 quantifies the dust emission, which is a blackbody function modified by a term that depends on the dust optical depth, , defined as
| (4) |
The modification from a standard blackbody function is due to the fact that for typical dust temperatures, the dust grains are smaller than the peak wavelength of the Planck function and hence do not radiate as perfectly as a blackbody. Here, is the dust mass, is the dust temperature, is the dust absorption coefficient and we adopted m2 kg-1 at 1200 GHz (250 m) (Hildebrand, 1983). is the dust emissivity index, which based on empirical results likely lies in the range 1 to 2. is the Planck function at frequency , and temperature . is the contribution from the cosmic microwave background at K. is the solid angle subtended by the source, here assumed to be the total extent of the FIR emission at 70 m.
The powerlaw indices for the AGN emission, and , were constrained to have negative values, so that the synchrotron emission decreases with increasing frequency. Dunne & Eales (2001) showed that a two-component dust model with close to 2 better fits the observed SEDs than a single-dust component. This is also consistent with our findings based on the SEDs of cool-core BCGs investigated so far (Edge et al., 2010a, b; Mittal et al., 2011). We therefore fitted the data with a model comprising a cold and warm dust component parametrized by temperature and mass (, ) and (, ), respectively. We used the Levenberg-Marquardt non-linear least square fitting algorithm from Numerical Recipes to obtain the best-fit model parameters appearing in Eqn. 1: , , , , , , , and . We explored a range of values between 0.5 and 2.5 for the dust emissivity index, . The -minimization gave a best-fit value which was . Note that there is a strong degeneracy between and the dust temperature such that all values of explored yield models, with varying temperatures, that are compatible with the observed SED. I.e., for any of the explored values of between and , the best-fit value was less than ; for a chi-squared distribution with degrees of freedom (because we are not optimizing over ), this corresponds to a -value (Gregory, 2005) greater than , i.e., a model consistent with the data. Based on the work of Dunne & Eales (2001), however, is expected to lie between 1 and 2, and so we fixed to unity and found the best-fit values for the other parameters subject to that choice.
The best-fit model is shown in Fig. 10 (black solid line), as are the AGN (thin-dashed line) and the dust contributions (thick-dashed lines; red representing the cold dust component and blue representing the warm dust component). In addition to the fitted flux-densities, we show the supplementary Spitzer/IRAS and UMRAO data, along with SCUBA (Irwin et al., 2001) and WMAP (Wright et al., 2009) data from around year 2000. The SCUBA (big magenta crosses) and WMAP data (small indigo crosses) clearly demonstrate the strong variability in the radio source and, hence, the need for coeval flux-densities for SED fitting. Similarly, the Planck (gray plus symbols Planck Collaboration et al., 2011) and UMRAO data (open green squares) from the year 2009 fall slightly below the IRAM and UMRAO data, both from the year 2010, respectively.
The best-fit parameter values were used to calculate the total dust emissivity by integrating the emission between 8 m and 1000 m. Assuming that young ( yrs), hot stars dominate the interstellar radiation field across the UV-optical band, the star formation rate can be estimated using the Kennicutt relation (Kennicutt, 1998). In early-type galaxies, including BCGs, the cooler emissions ( m) may arise from dust heated by a passively evolving old stellar population, which warrants caution in the Kennicutt calibration. The best-fit parameters for and the derived quantities are given in Table 4 (we also give the best-fit parameters for and for comparison) and the predicted dust and AGN flux contributions are given in Table 5. A total gas-to-dust mass ratio between 4500 and 7800 was estimated using the molecular gas mass derived in Salomé et al. (2006). The total gas mass depends upon the conversion factor used to calculate the atomic plus molecular mass. We used a factor of 1.36 as given in Edge (2001). The total gas-to-duss mass ratio, although high, is within the range of the derived mass ratios in other cool-core BCGs (Edge, 2001). At the other extreme is NGC 4696, for which a 3- upper-limit of was obtained on the total gas-to-dust mass ratio (Mittal et al., 2011).
While the SPIRE and PACS 100 m observations were made close in time to the IRAM sub-mm observations (2010-08-24 and 2010-09-09), the PACS 70 m observations were made half a year later (2010-03-14), and so the underlying contribution from the AGN may have varied because of the variability in the AGN output. According to the best-fit model, this is not an issue of concern since the AGN contribution to the total flux at 70 m is small. This was also verified by discarding the 70 m data point and refitting the data.
| Wavelength m | Dust (mJy) | AGN (mJy) |
|---|---|---|
| 20 | 2349 221 | 88 62 |
| 25 | 3384 163 | 112 74 |
| 30 | 3890 282 | 137 85 |
| 60 | 6772 295 | 289 143 |
| 70 | 7840 389 | 341 160 |
| 100 | 8513 775 | 502 202 |
| 160 | 5532 746 | 833 265 |
| 250 | 2493 369 | 1349 323 |
| 350 | 1175 171 | 1939 354 |
| 500 | 485 67 | 2850 363 |
| 1153 | 50 6 | 7023 714 |
| 1303 | 35 4 | 7389 398 |
| 1428 | 27 3 | 7673 400 |
| 2710 | 4.2 0.5 | 10008 396 |
| 2914 | 3.4 0.4 | 10313 394 |
| 3019 | 3.1 0.3 | 10466 392 |
| 20675 | 0.0 0.0 | 23231 130 |
4 What are the prevailing heating mechanisms in the inner 4 kpc of NGC 1275
The filamentary nebula extends out to kpc from the core. The excitation mechanisms in the outskirts of the galaxy are very likely different from those prevailing in the core. This is evident also from the reversal of the relative strengths of [Cii] and [Oi] line emission (section 3.2) with cluster-centric distance. The core of NGC 1275, where we expect photoionization from stars and AGN to play an important role, needs to be modelled separately from the filaments. To this end, we conducted simulations using the radiative transfer code cloudy (Ferland et al., 1998), the main goal of which was to determine whether or not an additional form of heating is required to reproduce some of the observed emission lines emerging from the core. For example, in the case of NGC 4696, the BCG of the Centaurus cluster, the [Cii]/ and H/[Cii] ratios clearly call for another heating component, in addition to photoionization (Mittal et al., 2011).
From the point of view of energetics of a cooling plasma, earlier works, such as Johnstone et al. (1987); Heckman et al. (1989); Voit et al. (1994); Jaffe & Bremer (1997); Donahue et al. (2000), have shown that the observed filamentary emissions are far too luminous to be just due to the recombination phase of gas cooling from the ICM. The observed luminosities imply far too much cooling, with mass deposition rates inconsistent by orders of magnitude with the star formation rates. While such calculations have been performed for emissions such as H and molecular hydrogen lines, none of the current cooling calculations simulate the FIR emission lines. This is because the existing cooling calculations (that use codes like cloudy, apec, mkcflow) usually stop when the gas reaches a temperature of K, not low enough to produce the FIR lines under consideration. Hence it is presently not possible to estimate the luminosity of the FIR lines from a simple cooling-flow plasma.
We modelled a composite cloud comprising a photo-dissociation region (PDR) adjacent to an ionized (Hii) region. For the equation of state we assumed a constant gas pressure throughout the cloud. As input, we provided the normalization for an old stellar population (OSP), , the normalization for a young stellar population (YSP), (in Habing units), the starting hydrogen density, (in cm-3), and the hydrogen column density, NH (in cm-2). For further details on the role played by these input parameters, we refer the reader to Mittal et al. (2011). The parameters, along with the range explored, are given in Table 8. Based on some initial investigations carried out to assess the effect of an OSP component on the output emissions, we concluded that the [Cii]/ ratio can be better reconciled if an OSP component is included. An old generation of stars produces optical and UV photons that contribute to the heating of dust but not so much to the photoelectric heating of the gas. In the absence of an OSP component, the [Cii]/ for a given is higher. The results, however, are not very sensitive to the presence of an OSP, except for low ( Habing) but a low is not consistent with other observed ratios, as we will show below.
We used the starburst99 stellar synthesis library (Leitherer et al., 1999) to model both the OSP and YSP. The main input parameters to the starburst99 simulations are the stellar mass and age (continuous or starburst), and the initial stellar mass function. We did not explore the range of possible values these input parameters can take – that is a subject of another detailed ongoing study (Mittal et al. 2012, in prep.). For the purpose of conducting the cloudy simulations described here, we fixed the age and mass of the OSP to Gyr and , and the age and the mass of the YSP to Myr and . The SED corresponding to a starburst 2 Myr old is indistinguishable from the one corresponding to a continuous star formation scenario, where the oldest stars are assumed to be 2 Myr. This is because the emission in both the cases is dominated by young stars that are about 2 Myr old. Hence the young population of stars need not have formed at the same time.
The elemental abundances were initially set to their default ISM values given in Table 6. However, X-ray observations made with Chandra indicate a slight drop in the central metallicity with the average value around (Sanders & Fabian, 2007). With this in mind, we also conducted simulations with a lower metallicity, which, as shown below, indeed fit the observed ratios better. We did not include any polycyclic aromatic hydrocarbon (PAH) grains since the mid-infrared spectra do not contain any PAH features (Weedman et al., 2005). Although several BCGs show strong PAH features in their IR spectra indicative of star formation (Donahue et al., 2011), there are a few such as NGC 1275 and NGC 4696 (Kaneda et al., 2005) that do not. PAH molecules are small in size and can easily be destroyed through physical sputtering or thermal evaporation (Dwek & Arendt, 1992; Micelotta et al., 2011).
| Element | abundances (ISM) |
|---|---|
| He | -1.0088 |
| C | -3.8222 |
| N | -4.2010 |
| O | -3.7171 |
| Ne | -4.1319 |
| Mg | -5.1215 |
| Si | -5.7222 |
| S | -4.7113 |
| Cl | -7.2218 |
| Ar | -5.7716 |
| Fe | -6.4218 |
| Region | RA | Dec | Aperture Radius | Line | Velocity | Flux | Ratio |
|---|---|---|---|---|---|---|---|
| (arcsec) | km s-1 | ( erg s-1 cm-2) | |||||
| Radio Core | 03h19m48.16s | +41d30m42.1s | 11 | [Cii] | 665.1 6.3 | 1.00 | |
| [Oi] | 1310.5 18.4 | 1.97 | |||||
| [Oib] | 81.2 2.1 | 0.12 | |||||
| [Nii] | 53.7 1.1 | 0.08 | |||||
| [Oiii] | 59.0 3.1 | 0.09 | |||||
| H | 1810 (4185) | 2.7 (6.3) | |||||
| CII Core | 03h19m48.01s | +41d30m44.9s | 11 | [Cii] | 724.8 7.3 | 1.00 | |
| [Oi] | 1320.2 17.3 | 1.82 | |||||
| [Oib] | 84.3 2.0 | 0.12 | |||||
| [Nii] | 58.1 1.2 | 0.08 | |||||
| [Oiii] | 66.1 3.0 | 0.09 | |||||
| H | 1810 (4185) | 2.5 (5.8) | |||||
The absolute and relative strengths of the FIR and H lines are very important diagnostics of the various heating contributors in cool-core BCGs. These emission lines and their ratios relative to [Cii] are listed in Table 7. We note that there is a slight offset of between the peak of the [Cii] emission and the radio core emission (the latter coincides with the peak of H emission to within ). This offset is on the order of the pointing inaccuracy of the PACS spectrometer and unlikely real. However, we estimated the FIR line fluxes for both the cases - (a) assuming the offset is not real and (b) assuming the offset is real. These cases are referred to as “[Cii] core” and “radio core”, respectively. The two cases have only marginal differences in their FIR line fluxes and are compared only for the purpose of illustrating the level of uncertainty in the estimated line parameters. In the following, we used the “[Cii] core” as the nominal case and used the other set of line fluxes to derive uncertainties on the line ratios.
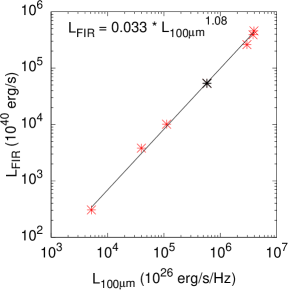
The total FIR flux associated with the core can not be directly estimated from fitting the SED due to insufficient resolution available beyond m. We instead used the 100 m flux as a proxy for the total luminosity. Shown in Fig. 11 is the total FIR luminosity in the range 8 m to 1000 m vs the 100 m luminosity for seven of the 11 BCGs in the Herschel cool-core BCG sample, including NGC 1275. We considered only those here because their FIR luminosity can be determined with least uncertainty. For NGC 1275 we set equal to the total dust luminosity. This relation is being investigated for the whole sample separately (Oonk et al. 2012, in prep.). There is a clear correlation between the total FIR luminosity and the 100 m luminosity, such that . The trend is also observed in the flux-flux plane (not shown) and so the correlation is not spuriously induced due to the common dependence of the two quantities on redshift. Using this correlation and the 100 m core flux, the total FIR flux for the core may be estimated. The contribution from the AGN synchrotron emission at 100 m is negligible (, see Table 5) and may be ignored.
The measured 100 m flux within the core aperture of radius is (5608) mJy. Even though some of the flux may fall beyond the chosen aperture, necessitating an aperture correction, the factor is very small for the given radius. We determined the required aperture correction factor by assuming that the FIR emission correlates with the H emission. Assuming the WIYN H image to represent the true model for the FIR surface-brightness distribution, we convolved the H image with the PACS 100 m PSF and estimated the aperture correction from the ratio of the flux from the smoothed to the unsmoothed image. The ratio is close to unity and therefore we did not apply any aperture correction. The measured 100 m flux yields a FIR (8 m to 1000 m) flux that implies a /[Cii] ratio 700 to 800.
4.1 Best-fit energy model for the core
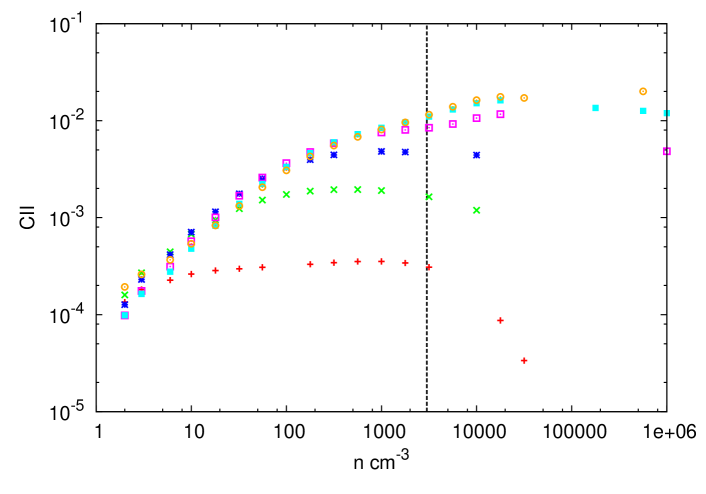
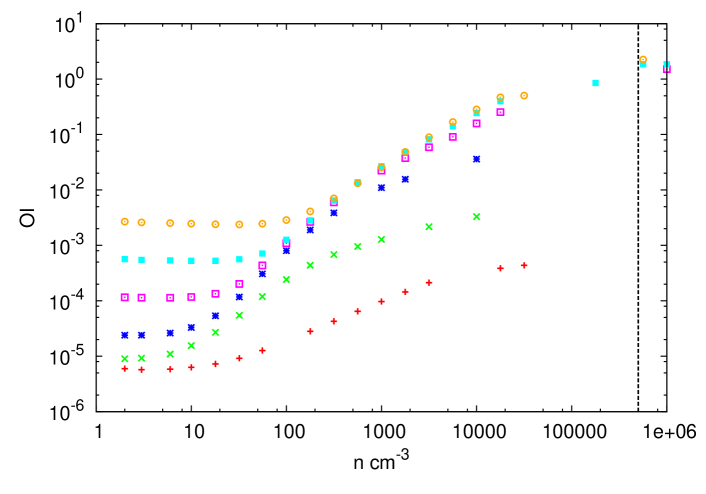
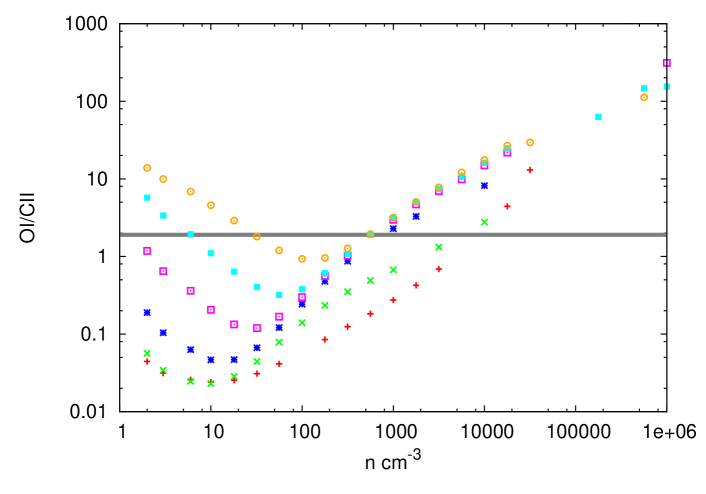
The Herschel FIR coolants serve as strong constraints for evaluating the physical parameters of the ISM in the BCG. Fig. 12 shows [Oi]/[Cii] versus for different values of the photon parameter, . This plot can be understood in terms of the critical densities for [Cii] and [Oi]. This is the density at which the probabilities of collisional de-excitation and radiative de-excitation are equal (Osterbrock & Ferland, 2006). Above the critical density the level populations may be considered to be in local thermal equilibrium as the level populations become dominated by collisions. The critical density is lowered by a factor that is roughly the optical depth of the line due to photon trapping when the line is optically thick. Fig. 12 shows that, for , the intensity of an optically thin line increases linearly with and for the intensity becomes independent on . This result is fairly insensitive to details such as the cloud energy source, as Fig. 12 shows. While for [Cii] is cm-3, it is substantially higher for [Oi] cm-3. Therefore, at a fixed column density and photon parameter, , for high densities cm cm-3 the ratio, [Oi]/[Cii], continues to increase with density. This makes [Oi]/[Cii] a sensitive probe of density if the lines are optically thin. The individual trends displayed by the [Oi] and [Cii] lines in Fig. 12 are complicated by the fact that for a given column density these lines become optically thick for certain combinations of and .
| Parameter | Symbol | Input Range | Likely Values |
| Total Hydrogen Density (cm-3) | 10 to 106 | 500 to 700 | |
| FUV Intensity Field (Habing∗) | 1 to 106 | 700 to 900 | |
| Hydrogen Column Density (cm-2) | NH | 1019 to 1026 | |
| Metallicity | — | 0.6 | |
| Nitrogen abundance (relative to ) | (N) | — | 2 |
| Normalization for the OSP∗ (10-16 erg s-1 cm-2 Hz-1) | — | 52.54 | |
| a 1 Habing erg s-1 cm-2, OSP: Old Stellar Population | |||
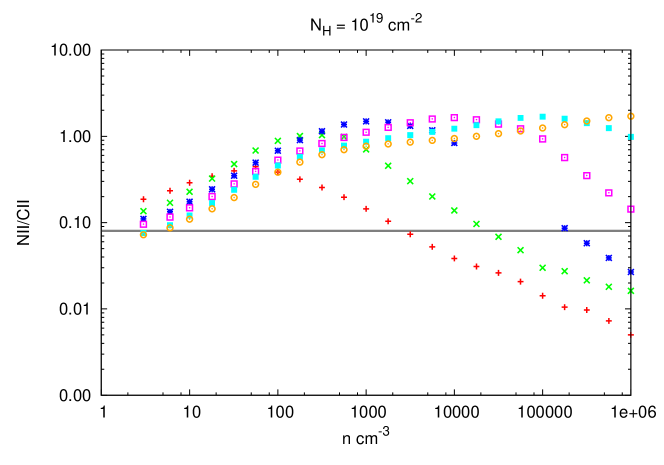
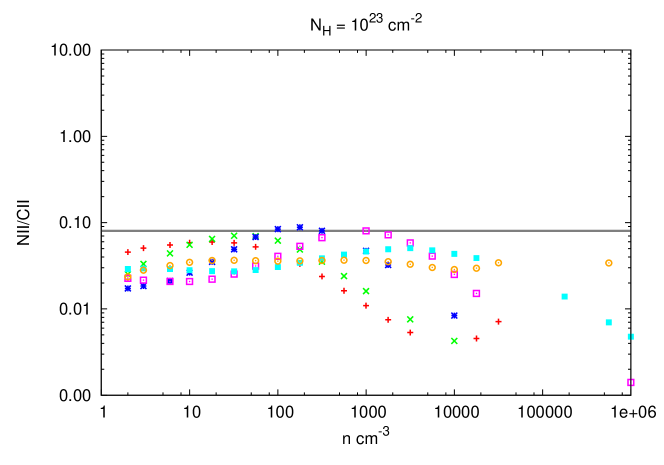
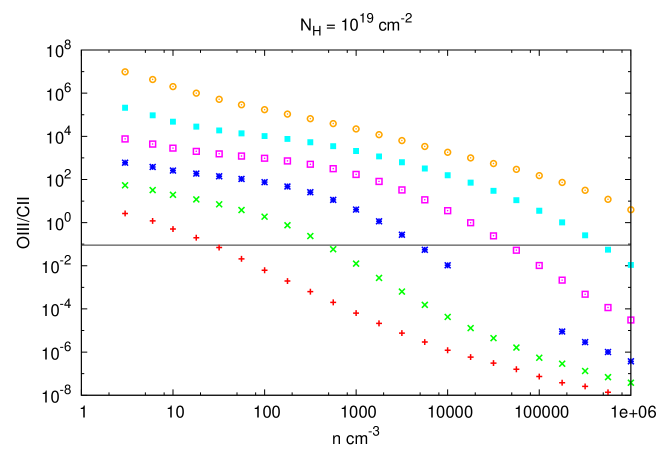
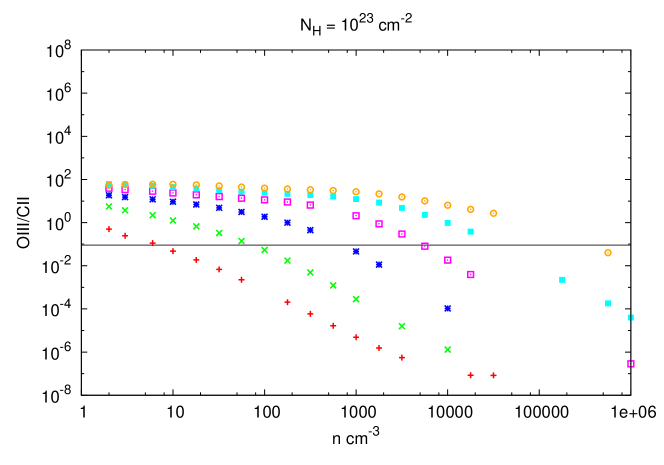
Similarly, Fig. 13 shows [Nii] and [Oiii] versus for different and for two different column densities. [Cii] is produced in both ionized (for e.g. Hii regions) and neutral media (for e.g. PDRs), however, [Nii] and [Oiii] are produced only in ionized region due to their higher ionization potentials. This has the effect that [Nii] and [Oiii] are produced profusely at the surface of the cloud facing the ionization source and reduce with the depth into the cloud. This explains the drop in both [Nii] and [Oiii] intensities relative to [Cii] with NH. This makes [Nii]/[Cii] and [Oiii]/[Cii] a sensitive probe of the cloud depth or hydrogen column density, NH.
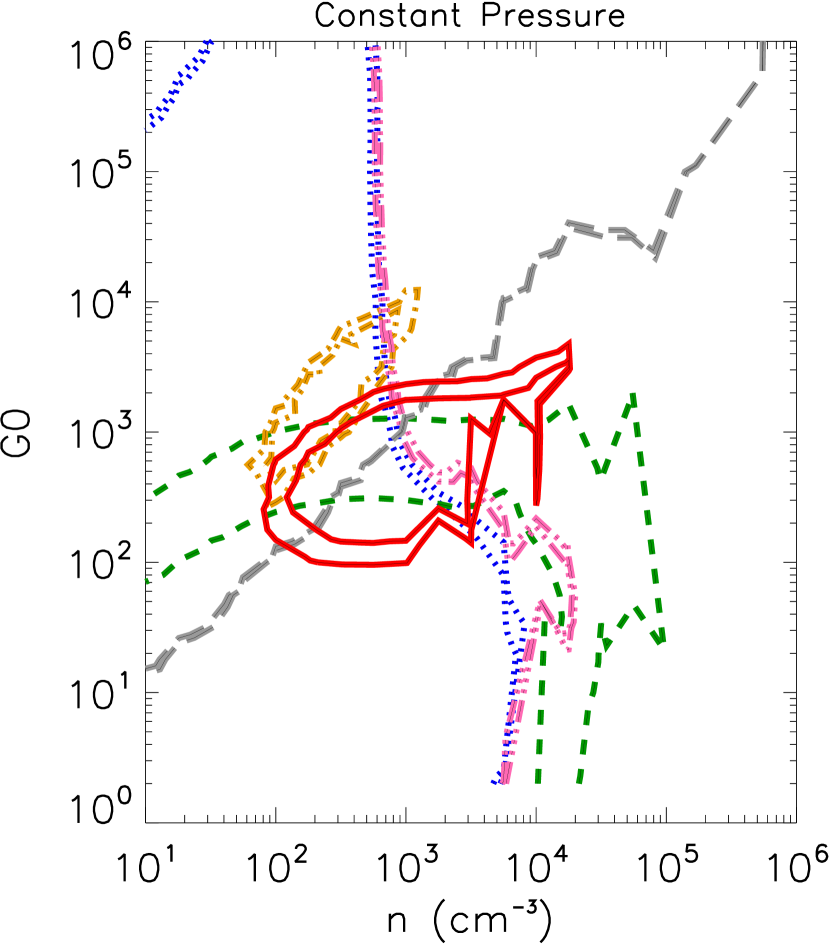
Of the NH range investigated, the optimal cloud depth required to reproduce the observed ratios is cm-2. Unless is high ( Habing), a higher NH does not affect the predicted ratios, implying that the cloud becomes radiation bounded. In Fig. 14, we present the modelled ratios as function of and for NH cm-2, assuming stellar photoionization only. The different sets of curves correspond to the observed lower- and upper-limits of [Cii]/ (solid red), [Oi]/[Cii] (dotted blue), H/[Cii] (dashed green), [Nii]/[Cii] (dash-dotted orange), [Oib]/[Cii] (dash-dot-dotted pink) and [Oiii]/[Cii] (long-dashed gray). Note that the observed H/[Cii] ratio has a wide range due to the uncertainties mentioned in section 2.2. The FIR ratios, in contrast, are much better constrained. Consequently, our strategy was to first try and reproduce the FIR line and continuum ratios and then use H/[Cii] to check for consistency against the best-fit model.
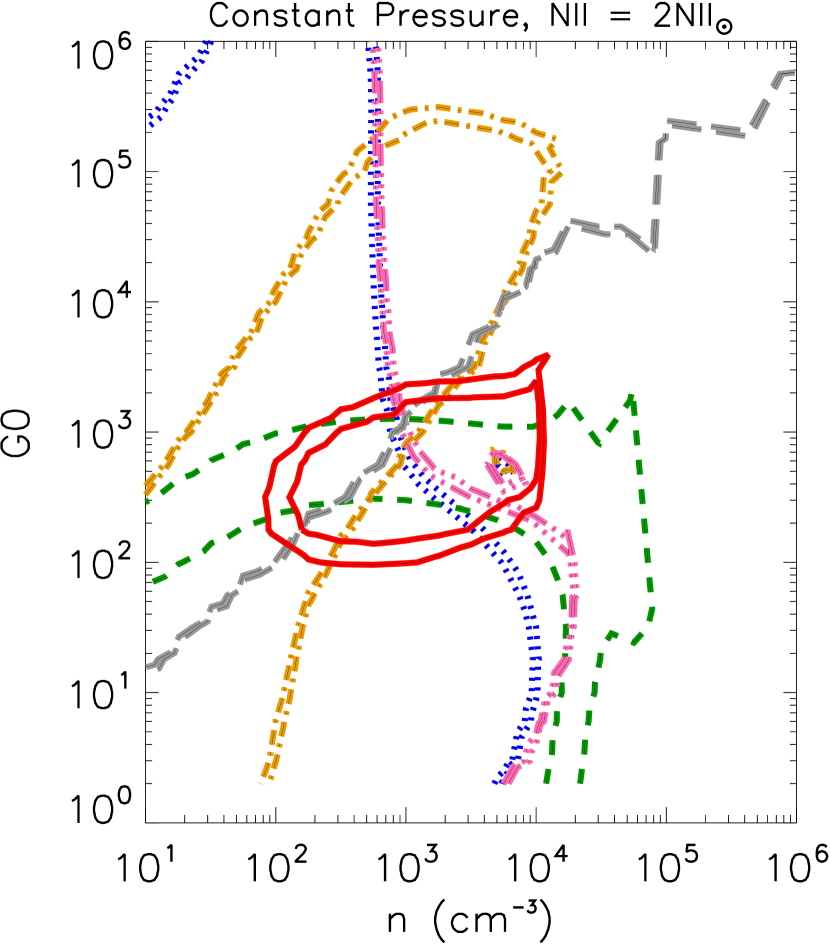
The left panel of Fig. 14 assumes ISM abundances, as adopted in Ferland et al. (2008). While [Oi]/[Cii], [Oib]/[Cii] and [Oiii]/[Cii] converge at cm-3 and Habing, the predicted [Nii]/[Cii] for this combination of and is less than the observed ratio. The middle panel of Fig. 14 assumes the nitrogen abundance is twice the ISM value, yielding a much better convergence between the FIR ratios. Curiously, the best-fitting (,) for NGC 4696 in the Centaurus galaxy cluster can also be reconciled with the observed [Nii]/[Cii] only if the nitrogen abundance is increased by a factor of two over the assumed overall metallicity (Mittal et al., 2011). In the case of NGC 4696, the need for an overabundance in nitrogen is confirmed by independent observations in the optical and X-ray bands. An overabundance of nitrogen could imply an abundance of intermediate-mass asymptotic giant branch (AGB) stars with pre-main sequence mass between and , which may convert dredged-up carbon in their outer shells into nitrogen (Wood et al., 1983; Iben, 1975). We are conducting such detailed radiative transfer modelling of all the cool-core BCGs in the Herschel sample and it will be interesting to see if this is a generic feature of galaxies at the center of cooling-flows.
As mentioned in section 4, X-ray observations suggest a lower metallicity in the core of Perseus ( kpc). Hence, in the right panel of Fig. 14, we show the predicted ratios for a metallicity equal to times the ISM value. The FIR ratios coincide nicely at cm-3 and Habing. We can now derive constraints on the physical scale of the cloud by comparing the [Cii] flux emerging from the modelled cloud and the observed [Cii] flux. For the range of and given in Table 8, the emergent [Cii] flux is in the range erg s-1 cm-2 to erg s-1 cm-2. The size of the cloud that produces [Cii] flux at the distance of Earth between erg s-1 cm-2 and erg s-1 cm-2 is kpc, yielding a volume filling factor of .
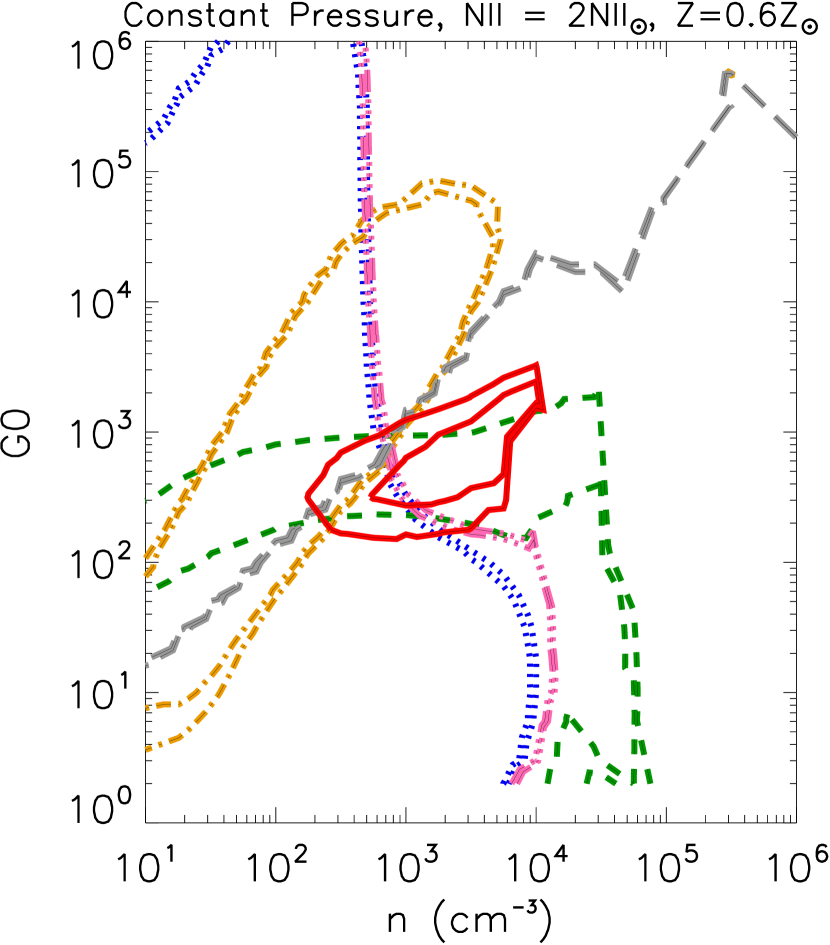
The main conclusion from modelling the ISM associated with the core of NGC 1275 is that a stellar-like ionizing source with Habing is capable of reproducing the observed FIR emission and H emission. No additional form of heating is required to explain these observations.
4.2 Consistency with optical flux ratios
According to previous studies (Johnstone & Fabian, 1988; Donahue & Voit, 1991; Johnstone et al., 2007; Ferland et al., 2009), a pure stellar or a pure active nucleus origin as the source of the optical filaments has difficulty explaining certain optical flux ratios. This may be true for the filaments but we suspect that stellar photoionization becomes increasingly important with decreasing distance to the core of the galaxy. Although fitting line and continuum ratios measured in different bands across the electromagnetic spectrum (submm, IR, optical, UV) simultaneously is beyond the scope of this paper, we compared a subset of the optical ratios measured by Johnstone & Fabian (1988) to our best-fit model predictions. This comparison is shown in Table 9. We give a range for the observed ratios since the ratios display a strong radial gradient. ‘Model I’ refers to the best-fit energy model described above. While the predicted values of the [Nii]/H and [Sii]/H ratios are consistent with the observed values, [Oii]/H is lower by a factor of a few and [Oiii]/H and [Oi]/[Nii]+H are lower by about an order of magnitude than the observed values. We devised another model, referred to as ‘Model II’, obtained by slightly modifying the best-fit model by decreasing the age of the input young stellar population by an order of magnitude. Using Model II we are able to reproduce some of the optical ratios, specifically, the ratio [Oiii]/H. There is also an increase in the ratio, [Oi]/[Nii]+H, by a factor of two. The modified model does not impact the best-fit model parameters constrained by the relative strengths of FIR and H lines (Table 7). This is due to the fact that lowering the age of the oldest stars in the YSP alters the SED only below 1000, such that [Oiii] and [Oi] are affected. FIR lines, on the other hand, are mainly produced by gas heated by lower-energy UV and optical photons.
From this exercise we conclude that photoionization from stars is the predominant source of energy in the cold gas clouds in the core of NGC 1275. It may be that in order to obtain consistency with the complete set of observed flux ratios at different wavebands, a composite model that includes a stellar component and one or more additional forms of heating is required. Particle-heating models are usually very hard to distinguish from slow shocks (e.g. Ferland et al., 2008; Farage et al., 2010; Rich et al., 2011). Even though the work of Ferland et al. (2009) showed that ionizing particles are the likely heating agents in the filaments of NGC 1275, the particle heating model was only marginally more successful than heating by dissipative MHD wave energy. The core of NGC 1275 displays large-scale motions, which may very well entail shocks (although strong shocks have been ruled out by X-ray data, Fabian et al., 2003; Sanders & Fabian, 2007). Similarly, due to the proximity to the AGN, particle heating (cosmic rays) may be significant as well. Hence additional heating required to explain the FIR and optical line ratios in entirety may either manifest itself in the form of weak shocks or particle-heating or both.
| Ratio | Value | Model I | Model II |
|---|---|---|---|
| [Oii]/H | 3.5 – 8 | 1-2 | 1-2 |
| [Oiii]/H | 1.2 – 1.8 | 0.1-0.2 | 0.7-2 |
| [Oi]/H+[Nii] | 0.06 – 0.14 | 0.004-0.007 | 0.008-0.01 |
| [Nii]/H | 0.8 - 1.4 | 0.6-0.9 | 0.6-0.9 |
| [Sii]/H | 0.2 – 0.7 | 0.6-0.8 | 0.6-0.8 |
4.3 Star formation
Far-ultraviolet (FUV) emission is a direct indicator of morphological and spatial extent of recent star-formation sites. In Fig. 15, we show the FUV emission associated with the BCG of Perseus. This image was created using two datasets from the HST archive – (1) Space Telescope Imaging Spectrograph (STIS) FUV-MAMA/F25SRF2 data (proposal ID: 8107, PI: C. O’Dea) and (2) Advance Camera of Surveys Solar Blind Channel (ACS/SBC) FUV-MAMA/F140LP data (proposal ID: 11207, PI: R. O’Connell). The first dataset consisted of a single pointing only (centered on the core). The second dataset, however, consisted of 8 different pointings, designed to map the bright UV filaments extending NW and SE from the core. We obtained the single flat-fielded, dark-subtracted exposures from the HST archive for both the datasets and combined them using the iraf task, multidrizzle.
The filaments NW of the core have the same spiral morphology as the HVS. This spatial correlation seems to suggest that the star clusters in the filaments are associated with the foreground galaxy (e.g. Keel & White, 2001). There is also evidence to the contrary, suggesting that the star clusters belong to the LVS (e.g. Goudfrooij, 1995; Brodie et al., 1998).
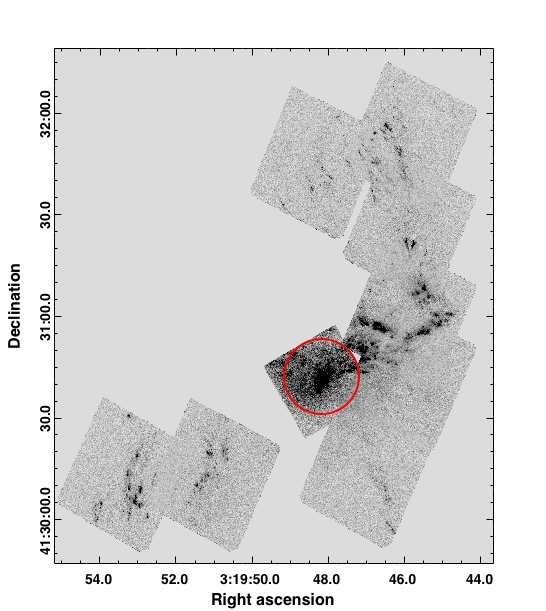
For the present study, we will focus only on the FUV emission originating from the core region (see Fig. 16), which, due to proximity and symmetry, is expected to be associated with the LVS. The integrated flux-density within the core is erg s-1 cm at 1456 ; however the FUV emission close to the center is likely to be associated with the AGN. For the purpose of quantifying FUV emission from stars, we determined the FUV emission in the annulus (0.5 kpc – 3.8 kpc) as erg s-1 cm, and correcting for the Galactic extinction results in erg s-1 cm. There is a further correction factor that needs to be applied in order to account for the dust internal to the ISM of NGC 1275 (see section 2.3). Assuming an internal reddening of , we obtain a FUV flux-density of erg s-1 cm. This can be directly compared to the flux density expected from a synthetic spectrum of a young stellar population, such as the one used as input for the cloudy simulations. The expected flux density was determined by convolving the redshifted synthetic spectrum with the bandpass of the FUVMAMA/F25SRF2 filter on STIS using the iraf tool synphot. A synthetic spectrum corresponding to an instantaneous starburst containing and 2 Myr in age predicts a flux density of erg s-1 cm. Holding the age constant and scaling down the mass so that the flux density agrees with the extinction-corrected observed flux density implies a SFR of . This is similar to the SFR derived in section 3.3 (Table 4) from the FIR measurements. This is also in very good agreement with the SFR derived by Norgaard-Nielsen et al. (1990) from the IUE (International Ultraviolet Explorer) spectroscopic data.
Since the star formation rate traced via FIR data is expected to be most accurate (due to negligible extinction at FIR wavelengths), and the FUV rate matches it, the average internal reddening over the inner 4 kpc radius region is probably close to that suggested by the observed Galactic-extinction corrected Balmer decrement (4.07) in a region SW of the nucleus (section 2.3). On the other hand, the SFR derived above using FUV data is for the core region, whereas the SFR derived in Table 4 is for the whole galaxy. For example, Canning et al. (2010) obtained an optical star formation rate of about over the Blue Loop region, which is outside the core region. Although there is hardly any FIR emission detected in the Blue Loop region, it is possible that it contributes to the total SFR derived from FIR measurements to some extent. This could imply that the average internal reddening over the core is lower than assumed, making the FUV-derived star formation rate lower as well. Hence is an upper-limit. Note, the above calculation is based on two assumptions: (1) the dust in NGC 1275 follows the same extinction law as the Milky Way and (2) the Balmer line ratios are close to the case-B recombination values.
It is interesting that if we use the dust attenuation derived from the Balmer decrement and apply it at smaller (UV) wavelengths, the FIR- and UV-derived SFRs are consistent with each other. This is in contrast to studies that have indicated that the reddening values diverge between nebular line emission and UV continuum by a factor of two (e.g. Calzetti, 1997; Buat et al., 2002), such that nebular lines, like H and H, are more attenuated than the stellar continuum emission. This discrepancy is usually attributed to an uneven distribution of dust in front of stars and ionized gas, with the latter being more closely associated with the dust than the former. Calzetti (1997) suggests using the relation . However, Garn et al. (2010) argue that the while the continuum at longer wavelengths (optical) may be probing older stellar population residing in less dusty environments, and hence may not be co-spatial with the ionized gas, the continuum at shorter wavelengths (UV) should be more closely tied to the young stars producing ionized gas. Hence the correction factor (0.44) for FUV emission may be higher than suggested by the above relation.
Using the relation suggested by Calzetti (1997), Buat et al. (2002) derived . Instead of applying the attenuation at FUV wavelengths by extrapolating the reddening value calculated from the Balmer decrement, if we apply the above calibration we obtain a SFR of . This is a factor of four lower than the FIR-derived SFR. This implies that in the case of NGC 1275, the dust covering factor for the ionized gas resulting in the Balmer lines and the FUV emission must be rather homogeneous, such that the attenuation tracked by the ionized gas is closely related to that of the FUV emission.
5 Discussion of the outer filaments
| Region | RA | Dec | Aperture Radius | Line | Velocity | Flux | Ratio |
|---|---|---|---|---|---|---|---|
| (arcsec) | km s-1 | ( erg s-1 cm-2) | |||||
| Horseshoe knot | 03h19m45.15s | +41d31m33.1s | 11 | [Cii] | 79.5 | 26.78 0.26 | 1.00 |
| [Oi] | |||||||
| H | 36 (88) | 1.34 (3.27) | |||||
| Southwest knots | 03h19m45.48s | +41d29m49.4s | 11 | [Cii] | 3.3 | 40.67 3.55 | 1.00 |
| (Southern Filament) | [Oi] | ||||||
| H | 87 (211) | 2.14 (5.19) | |||||
| Blue Loop knots | 03h19m50.72s | +41d30m07.2s | 11 | [Cii] | -224.5 | 35.19 1.87 | 1.00 |
| (Southeast Filament) | [Oi] | ||||||
| H | 73 (177) | 2.07 (5.03) |
Ferland et al. (2009, F09 hereafter) conducted a thorough analysis of the Horseshoe region in NGC 1275. They used the infrared and optical line intensities to distinguish between two types of heating: extra heating, as would be produced by passing shocks, and heating by energetic particles such as cosmic rays. Extra heating refers to heating by dissipative MHD waves, and it is assumed that this kind of heating increases the thermal energy of the gas only. Hence the local gas kinetic temperature dictates the collisional processes that are energetically possible. Energetic particle heating refers essentially to ionizing particles, and, on the other hand, is not only capable of depositing thermal energy via elastic collisions with the particles of the ISM but can also ionize a neutral medium via creation of a population of suprathermal secondary electrons. The physics of molecular gas exposed to such heating sources is described by Ferland (2011a) and Ferland (2011b).
The model in F09 assumes that the gas in the filaments is in pressure balance with the surrounding X-ray-emitting intracluster gas. Based on the X-ray measurement of the electron pressure of 0.128 keV cm-3 of the hot gas surrounding the horseshoe by Sanders & Fabian (2007), F09 assumed a constant pressure of cm-3 K. The simulations conducted in F09 are further based on the assumption that the filaments are composed of cloudlets with a range of density, , and temperature, , but which have this single pressure, . This assumption is motivated by the fact ionic, atomic, and molecular emissions are all observed in the filaments. This implies that different phases of gas occupy a telescope beam, even at HST resolution. In other words, there is observational evidence that both dense molecular and diffuse ionized emission arise from spatially coincident regions. Because of the constant pressure assumption, low density cloudlets have high temperature and produce emission from ionized gas, while dense clouds are cold and account for the molecular component.
The formalism adopted in F09 uses a cumulative filling factor , which is a powerlaw in density, as the weighting function to co-add clouds of different densities. This factor describes the fractional volume filled with gas with density or lower. The spectra for various emission lines, in particular the infrared H2 and optical H i emission lines, are determined using cloudy using a range of electron densities, temperatures, and non-radiative heating rates. The emission for a given line is integrated over the ensemble of clouds and then compared to observations.
Ferland et al. (2009) found that both the forms of non-radiative heating, extra heating and energetic particle heating, match the optical and infrared observations to within a factor of two for the majority of the lines. There are a few discriminant lines, such as the optical emission lines He i , [Ne iii] , and the infrared emission line [Ne ii] m, which show a few orders of magnitude difference and indicate that ionizing particles are responsible for heating and ionizing the gas. Fabian et al. (2011) argue that the surrounding hot intracluster medium is the source of the ionizing particles, rather than true cosmic rays as would be found in the adjoining radio lobes.
All of the predicted lines used to compare with observations were optically thin, so their intensity relative to similar forbidden lines has no dependence on cloud column density. The F09 model also made predictions for the far-infrared emission lines, such as those observed by Herschel. In Table 10, we list the detected Herschel emissions in the three regions of the extended filaments the Horseshoe region, the southwest (SW) knots. We also give the 3- upper-limits for the non-detections. These lines may be used to distinguish between the two heating scenarios. In particular, the predicted [Oi]/[Cii] ratio is for the extra heating and for the energetic particle heating. The observed [Oi]/[Cii] ratios, on the other hand, have an upper-limit of 1.64 in the Horseshoe knot and 0.85 in both the SW and Blue Loop knots. This discrepancy was first pointed out by Mittal et al. (2011) in a different context.
There are two plausible explanations for why the F09 model fails to reproduce the Herschel observations. The first reason is tied to the critical densities, , of [Cii] and [Oi] gas (see Fig. 12). Since the F09 model assumes a constant pressure of cm-3 K, the FIR lines which are produced at low temperatures ( K to a few hundred K ) correspond to high densities ( cm cm-3). Such high densities lead to high [Oi]/[Cii] ratios due to the reasons given in section 4.1. The model could be brought into agreement with the observations by postulating a large component of low density gas, which would strongly emit the Herschel lines with the observed ratio. F09 note, in section 7, point 7, that large reservoirs of cold gas could be present yet not detected with the selection of lines they had available.
The second likely cause for the incompatibility of the F09 model with the [Oi]/[Cii] ratio is that the F09 model assumes that the emission lines are optically thin. If the gas has high enough column density, the Herschel lines become optically thick. This is normally the case in galactic PDRs (Tielens & Hollenbach, 1985). The line luminosity is no longer determined simply by the product of the line emissivity and the volume of the cloud but rather the geometry of the emitting cloud, especially its column density, will affect the line intensities. F09 note that the observed surface brightness of the H line gives the line-of-sight thickness of the cloud pc. This implies a hydrogen column density of cm-2. If the emission forms in a single cloud with this column density, the Herschel lines would be strongly affected but there would be little impact on the NIR and optical lines, other than the effects of internal reddening.
Clearly much remains to be learned about the geometry of the filaments at sub-HST resolution scales. Both scenarios outlined here are consistent with what is known from available observations.
6 Conclusions
We have presented far-infrared Herschel observations of the center of the Perseus galaxy cluster. The brightest cluster galaxy, NGC 1275, is surrounded by filaments, previously imaged extensively in H and CO emission. In this work, we report the presence of coolants, such as [Cii], [Oi], [Nii], [Oib] and [Oiii], in addition to H and CO. All the Herschel lines except [Oiii] are spatially extended, with [Cii] extending up to 25 kpc from the nucleus of the galaxy, and cospatial with H and CO. Furthermore, [Cii] shows a similar velocity distribution to CO, and the latter has been shown in previous studies to display a close association with the H kinematics. The spatial and kinematical correlation among [Cii], H and CO gives us confidence that the different components of the gas may be modelled with a common heating model.
The velocity structure inferred from [Cii] observations reveals blueshifted components on either side of the nucleus and a ridge of redshifted gas passing through the center in the north-south direction. A combination of disk rotation on kpc scales and more disordered motion of a few distinct clouds at larger radii is one plausible scenario consistent with [Cii] (Herschel) and CO data. It may also be that outflows from the radio source at the center are dredging up cold material away from the line of sight, resulting in a ridge of redshifted gas.
We have detected continuum emission at all PACS and SPIRE wavelengths ranging from 70 m to 500 m. The Herschel continuum data combined with a suite of existing radio, submm and IR data, have allowed us to perform a spectral energy distribution fitting using a model comprising two modified-blackbody dust components, dominant at IR wavelengths, and synchrotron AGN emission, dominant at radio and submm wavelengths. The total infrared luminosity (8 m to 1000 m) is , making NGC 1275 a luminous infrared galaxy (LIRG). The infrared-inferred star formation rate is about 24 . This is comparable to the SFR estimated in a core region (kpc in radius) using the HST-FUV observations, and also XMM-Newton RGS observations, which suggest a residual cooling rate of .
We have investigated in detail the source of the emissions emerging from a core region kpc in radius. This investigation was done by carrying out radiative transfer simulations assuming a photoionization model consisting of only old and young stellar populations as heating agents. We find that the Herschel and H emissions can be reproduced by such a model, yielding hydrogen density between 500 cm-3 and 700 cm-3 and FUV intensity field between 700 Habings to 900 Habings. Optical flux ratios indicate that a second heating component may be needed; however, stellar photoionization seems to be the dominant mechanism.
We have also detected [Cii] in three previously well-studied regions of the filaments: the Horseshoe, Blue Loop and southwest knots. The observed upper-limits of the [Oi]/[Cii] ratio are 1 dex smaller than predicted by the best-fit model of Ferland et al. (2009), wherein two sources of ionization have been considered individually: particle heating and extra-heating (the latter increases the thermal energy of the gas). The [Cii] line has a excitation potential of 91 K and a critical density much lower than the lines considered in that study. This suggests that the lines are optically thick, as is typical of galactic PDRs, and implies that there is a large reservoir of cold atomic gas. This has not been included in previous inventories of the filament mass and may represent a significant component. It seems likely that the model used by Ferland et al. (2009) needs to be augmented in order to reproduce the observed strengths of the various emissions in the filaments of NGC 1275. It can also be that a composite model, like the one used for the study of Centaurus (Mittal et al., 2011), consisting of more than one heating agent, is required to achieve compatibility with observations.
Acknowledgments
We thank Christopher Conselice for providing the WIYN H image and Greg Taylor for the radio images. We thank the referee sincerely for a very useful feedback. This work is based (in part) on observations made with Herschel, a European Space Agency Cornerstone Mission with significant participation by NASA. Support for this work was provided by NASA through an award issued by JPL/Caltech. We thank M. Aller for providing us with the UMRAO data. This research has made use of data from the University of Michigan Radio Astronomy Observatory which has been supported by the University of Michigan and by a series of grants from the National Science Foundation, most recently AST-0607523. This research has made use of the NASA/IPAC Extragalactic Database (NED) which is operated by the Jet Propulsion Laboratory, California Institute of Technology, under contract with the National Aeronautics and Space Administration. This work is supported in part by the Radcliffe Institute for Advanced Study at Harvard University. GJF acknowledges support by NSF (0908877; 1108928; and 1109061), NASA (10-ATP10-0053, 10-ADAP10-0073, and NNX12AH73G), JPL (RSA No 1430426), and STScI (HST-AR-12125.01, GO-12560, and HST-GO-12309). STSDAS is a product of the Space Telescope Science Institute, which is operated by AURA for NASA. HRR thanks the Canadian Space Agency Space Science Enhancement Program for support.
References
- Böhringer et al. (1993) Böhringer H., Voges W., Fabian A. C., Edge A. C., Neumann D. M., 1993, MNRAS, 264, L25
- Brauher et al. (2008) Brauher J. R., Dale D. A., Helou G., 2008, ApJS, 178, 280
- Bregman et al. (2006) Bregman J. N., Fabian A. C., Miller E. D., Irwin J. A., 2006, ApJ, 642, 746
- Brodie et al. (1998) Brodie J. P., Schroder L. L., Huchra J. P., Phillips A. C., Kissler-Patig M., Forbes D. A., 1998, AJ, 116, 691
- Buat et al. (2002) Buat V., Boselli A., Gavazzi G., Bonfanti C., 2002, A&A, 383, 801
- Calzetti (1997) Calzetti D., 1997, AJ, 113, 162
- Canning et al. (2010) Canning R. E. A., Fabian A. C., Johnstone R. M., Sanders J. S., Crawford C. S., Hatch N. A., Ferland G. J., 2010, MNRAS, p. 1800
- Cardelli et al. (1989) Cardelli J. A., Clayton G. C., Mathis J. S., 1989, ApJ, 345, 245
- Chapman et al. (2002) Chapman S. C., et al., 2002, MNRAS, 330, 92
- Conselice et al. (2001) Conselice C. J., et al., 2001, AJ, 122, 2281
- Crawford et al. (1999) Crawford C. S., et al., 1999, MNRAS, 306, 857
- Crawford et al. (2005) Crawford C. S., Hatch N. A., Fabian A. C., Sanders J. S., 2005, MNRAS, 363, 216
- Dhawan et al. (1998) Dhawan V., Kellermann K. I., Romney J. D., 1998, ApJ, 498, L111
- Donahue et al. (2011) Donahue M., de Messières G. E., O’Connell R. W., Voit G. M., Hoffer A., McNamara B. R., Nulsen P. E. J., 2011, ApJ, 732, 40
- Donahue et al. (2000) Donahue M., Mack J., Voit G. M., Sparks W., Elston R., Maloney P. R., 2000, ApJ, 545, 670
- Donahue & Voit (1991) Donahue M., Voit G. M., 1991, ApJ, 381, 361
- Donahue & Voit (1993) Donahue M., Voit G. M., 1993, ApJ, 414, L17
- Dunne & Eales (2001) Dunne L., Eales S. A., 2001, MNRAS, 327, 697
- Dwek & Arendt (1992) Dwek E., Arendt R. G., 1992, ARA&A, 30, 11
- Edge (2001) Edge A. C., 2001, MNRAS, 328, 762
- Edge et al. (1999) Edge A. C., et al., 1999, MNRAS, 306, 599
- Edge et al. (2002) Edge A. C., et al., 2002, MNRAS, 337, 49
- Edge et al. (2010a) Edge A. C., Oonk J. B. R., Mittal R., et al., 2010a, A&A, 518, L46
- Edge et al. (2010b) Edge A. C., Oonk J. B. R., Mittal R., et al., 2010b, A&A, 518, L47
- Egami et al. (2006) Egami E., et al., 2006, ApJ, 652, L21
- Fabian (1994) Fabian A. C., 1994, ARA&A, 32, 277
- Fabian et al. (2003) Fabian A. C., et al., 2003, MNRAS, 344, L43
- Fabian et al. (2008) Fabian A. C., et al., 2008, Nature, 454, 968
- Fabian et al. (2000) Fabian A. C., Sanders J. S., Ettori S., Taylor G. B., Allen S. W., Crawford C. S., Iwasawa K., Johnstone R. M., Ogle P. M., 2000, MNRAS, 318, L65
- Fabian et al. (2006) Fabian A. C., Sanders J. S., Taylor G. B., Allen S. W., Crawford C. S., Johnstone R. M., Iwasawa K., 2006, MNRAS, 366, 417
- Fabian et al. (2011) Fabian A. C., Sanders J. S., Williams R. J. R., Lazarian A., Ferland G. J., Johnstone R. M., 2011, MNRAS, 417, 172
- Farage et al. (2010) Farage C. L., McGregor P. J., Dopita M. A., Bicknell G. V., 2010, ApJ, 724, 267
- Ferland (2011a) Ferland G. J., 2011a, in Narrow-Line Seyfert 1 Galaxies and their Place in the Universe Molecular hydrogen in NLSys and its implications for the SED
- Ferland (2011b) Ferland G. J., 2011b, ArXiv:1109.3315v1
- Ferland et al. (2008) Ferland G. J., Fabian A. C., Hatch N. A., Johnstone R. M., Porter R. L., van Hoof P. A. M., Williams R. J. R., 2008, MNRAS, 386, L72
- Ferland et al. (2009) Ferland G. J., Fabian A. C., Hatch N. A., Johnstone R. M., Porter R. L., van Hoof P. A. M., Williams R. J. R., 2009, MNRAS, 392, 1475
- Ferland et al. (1998) Ferland G. J., Korista K. T., Verner D. A., Ferguson J. W., Kingdon J. B., Verner E. M., 1998, PASP, 110, 761
- Garn et al. (2010) Garn T., Sobral D., Best P. N., Geach J. E., Smail I., Cirasuolo M., Dalton G. B., Dunlop J. S., McLure R. J., Farrah D., 2010, MNRAS, 402, 2017
- Gitti et al. (2002) Gitti M., Brunetti G., Setti G., 2002, A&A, 386, 456
- Gitti et al. (2011) Gitti M., Nulsen P. E. J., David L. P., McNamara B. R., Wise M. W., 2011, ApJ, 732, 13
- Goudfrooij (1995) Goudfrooij P., 1995, PASP, 107, 502
- Gregory (2005) Gregory P. C., 2005, Bayesian Logical Data Analysis for the Physical Sciences. Cambridge University Press
- Griffin et al. (2010) Griffin M. J., Abergel A., Abreu A., Ade P. A. R., André P., Augueres J., Babbedge T., et al., 2010, A&A, 518, L3+
- Hatch et al. (2005) Hatch N. A., Crawford C. S., Fabian A. C., Johnstone R. M., 2005, MNRAS, 358, 765
- Hatch et al. (2006) Hatch N. A., Crawford C. S., Johnstone R. M., Fabian A. C., 2006, MNRAS, 367, 433
- Heckman et al. (1989) Heckman T. M., Baum S. A., van Breugel W. J. M., McCarthy P., 1989, ApJ, 338, 48
- Hicken et al. (2009) Hicken M., Wood-Vasey W. M., Blondin S., Challis P., Jha S., Kelly P. L., Rest A., Kirshner R. P., 2009, ApJ, 700, 1097
- Hildebrand (1983) Hildebrand R. H., 1983, QJRAS, 24, 267
- Iben (1975) Iben Jr. I., 1975, ApJ, 196, 525
- Irwin et al. (2001) Irwin J. A., Stil J. M., Bridges T. J., 2001, MNRAS, 328, 359
- Jaffe & Bremer (1997) Jaffe W., Bremer M. N., 1997, MNRAS, 284, L1
- Johnstone & Fabian (1988) Johnstone R. M., Fabian A. C., 1988, MNRAS, 233, 581
- Johnstone et al. (1987) Johnstone R. M., Fabian A. C., Nulsen P. E. J., 1987, MNRAS, 224, 75
- Johnstone et al. (2007) Johnstone R. M., Hatch N. A., Ferland G. J., Fabian A. C., Crawford C. S., Wilman R. J., 2007, MNRAS, 382, 1246
- Kaneda et al. (2005) Kaneda H., Onaka T., Sakon I., 2005, ApJ, 632, L83
- Keel & White (2001) Keel W. C., White III R. E., 2001, AJ, 121, 1442
- Kennicutt (1998) Kennicutt Jr. R. C., 1998, ARA&A, 36, 189
- Kent & Sargent (1979) Kent S. M., Sargent W. L. W., 1979, ApJ, 230, 667
- Krabbe et al. (2000) Krabbe A., Sams III B. J., Genzel R., Thatte N., Prada F., 2000, A&A, 354, 439
- Laine et al. (2003) Laine S., van der Marel R. P., Lauer T. R., Postman M., O’Dea C. P., Owen F. N., 2003, AJ, 125, 478
- Leitherer et al. (1999) Leitherer C., Schaerer D., Goldader J. D., González Delgado R. M., Robert C., Kune D. F., de Mello D. F., Devost D., Heckman T. M., 1999, ApJS, 123, 3
- Lim et al. (2008) Lim J., Ao Y., Dinh-V-Trung 2008, ApJ, 672, 252
- Lim et al. (2012) Lim J., Ohyama Y., Chi-Hung Y., Dinh-V-Trung Shiang-Yu W., 2012, ApJ, 744, 112
- McDonald et al. (2010) McDonald M., Veilleux S., Rupke D. S. N., Mushotzky R., 2010, ApJ, 721, 1262
- McNamara et al. (1996) McNamara B. R., Wise M., Sarazin C. L., Jannuzi B. T., Elston R., 1996, ApJ, 466, L9
- Micelotta et al. (2011) Micelotta E. R., Jones A. P., Tielens A. G. G. M., 2011, A&A, 526, A52
- Mittal et al. (2011) Mittal R., O’Dea C. P., Ferland G., Oonk J. B. R., Edge A. C., Canning R. E. A., Russell H., Baum S. A., Böhringer H., Combes F., Donahue M., Fabian A. C., Hatch N. A., Hoffer A., Johnstone R., McNamara B. R., Salomé P., Tremblay G., 2011, MNRAS, 418, 2386
- Moshir et al. (1990) Moshir M., Kopan G., Conrow T., McCallon H., Hacking P., Gregorich D., Rohrbach G., Melnyk M., Rice W., Fullmer L., White J., Chester T., 1990, in Bulletin of the American Astronomical Society Vol. 22 of Bulletin of the American Astronomical Society, The IRAS Faint Source Catalog, Version 2. p. 1325
- Nagai et al. (2012) Nagai H., Orienti M., Kino M., Suzuki K., Giovannini G., Doi A., Asada K., Giroletti M., Kataoka J., D’Ammando F., Inoue M., Lähteenmäki A., Tornikoski M., León-Tavares J., Kameno S., Bach U., 2012, MNRAS, 423, L122
- Norgaard-Nielsen et al. (1990) Norgaard-Nielsen H. U., Hansen L., Jorgensen H. E., 1990, A&A, 240, 70
- O’Dea et al. (2008) O’Dea C. P., Baum S. A., Privon G., Noel-Storr J., Quillen A. C., Zufelt N., Park J., Edge A., Russell H., Fabian A. C., Donahue M., Sarazin C. L., McNamara B., Bregman J. N., Egami E., 2008, ApJ, 681, 1035
- Oonk et al. (2011) Oonk J. B. R., Hatch N. A., Jaffe W., Bremer M. N., van Weeren R. J., 2011, MNRAS, 414, 2309
- Osterbrock & Ferland (2006) Osterbrock D. E., Ferland G. J., 2006, Astrophysics of gaseous nebulae and active galactic nuclei. University Science Press
- Ott (2010) Ott S., 2010, in Y. Mizumoto, K.-I. Morita, & M. Ohishi ed., Astronomical Data Analysis Software and Systems XIX Vol. 434 of Astronomical Society of the Pacific Conference Series, The Herschel Data Processing System – HIPE and Pipelines – Up and Running Since the Start of the Mission. p. 139
- Pedlar et al. (1990) Pedlar A., Ghataure H. S., Davies R. D., Harrison B. A., Perley R., Crane P. C., Unger S. W., 1990, MNRAS, 246, 477
- Pereira et al. (2010) Pereira M. J., Haines C. P., Smith G. P., Egami E., Moran S. M., Finoguenov A., Hardegree-Ullman E., Okabe N., Rawle T., Rex M., 2010, A&A, 518, L40
- Pilbratt et al. (2010) Pilbratt G. L., Riedinger J. R., Passvogel T., Crone G., Doyle D., Gageur U., Heras A. M., Jewell C., Metcalfe L., Ott S., Schmidt M., 2010, A&A, 518, L1+
- Pinkney et al. (1996) Pinkney J., Holtzman J., Garasi C., Watson A. M., Gallagher III J. S., et al., 1996, ApJ, 468, L13
- Planck Collaboration et al. (2011) Planck Collaboration Ade P. A. R., Aghanim N., Arnaud M., Ashdown M., Aumont J., Baccigalupi C., Balbi A., Banday A. J., Barreiro R. B., et al. 2011, A&A, 536, A7
- Poglitsch et al. (2010) Poglitsch A., Waelkens C., Geis N., et al., 2010, A&A, 518, L2+
- Privon et al. (2012) Privon G. C., Baum S. A., O’Dea C. P., Gallimore J., Noel-Storr J., Axon D. J., Robinson A., 2012, ApJ, 747, 46
- Rawle et al. (2012) Rawle T. D., Edge A. C., Egami E., Rex M., Smith G. P., Altieri B., Fiedler A., Haines C. P., Pereira M. J., Pérez-González P. G., Portouw J., Valtchanov I., Walth G., van der Werf P. P., Zemcov M., 2012, ApJ, 747, 29
- Revaz et al. (2008) Revaz Y., Combes F., Salomé P., 2008, A&A, 477, L33
- Rich et al. (2011) Rich J. A., Kewley L. J., Dopita M. A., 2011, ApJ, 734, 87
- Salomé et al. (2011) Salomé P., Combes F., Revaz Y., Downes D., Edge A. C., Fabian A. C., 2011, A&A, 531, A85
- Salomé et al. (2008) Salomé P., Combes F., Revaz Y., Edge A. C., Hatch N. A., Fabian A. C., Johnstone R. M., 2008, A&A, 484, 317
- Salomé et al. (2006) Salomé P., et al., 2006, A&A, 454, 437
- Sanders & Fabian (2007) Sanders J. S., Fabian A. C., 2007, MNRAS, 381, 1381
- Sanders et al. (2005) Sanders J. S., Fabian A. C., Dunn R. J. H., 2005, MNRAS, 360, 133
- Simionescu et al. (2008) Simionescu A., Werner N., Finoguenov A., Böhringer H., Brüggen M., 2008, A&A, 482, 97
- Simionescu et al. (2010) Simionescu A., Werner N., Forman W. R., Miller E. D., Takei Y., Böhringer H., Churazov E., Nulsen P. E. J., 2010, MNRAS, 405, 91
- Sparks et al. (1989) Sparks W. B., Macchetto F., Golombek D., 1989, ApJ, 345, 153
- Sparks et al. (2012) Sparks W. B., Pringle J. E., Carswell R. F., Donahue M., Martin R., Voit M., Cracraft M., Manset N., Hough J. H., 2012, ApJ, 750, L5
- Taylor et al. (2006) Taylor G. B., Sanders J. S., Fabian A. C., Allen S. W., 2006, MNRAS, 365, 705
- Tielens & Hollenbach (1985) Tielens A. G. G. M., Hollenbach D., 1985, ApJ, 291, 722
- Tremblay et al. (2012a) Tremblay G. R., O’Dea C. P., Baum S. A., Clarke T. E., Sarazin C. L., et al., 2012a, MNRAS, 424, 1026
- Tremblay et al. (2012b) Tremblay G. R., O’Dea C. P., Baum S. A., Clarke T. E., Sarazin C. L., et al., 2012b, MNRAS, 424, 1042
- Trippe et al. (2011) Trippe S., Krips M., Piétu V., Neri R., Winters J. M., Gueth F., Bremer M., Salome P., Moreno R., Boissier J., Fontani F., 2011, A&A, 533, A97
- Vermeulen et al. (1994) Vermeulen R. C., Readhead A. C. S., Backer D. C., 1994, ApJ, 430, L41
- Voit & Donahue (1995) Voit G. M., Donahue M., 1995, ApJ, 452, 164
- Voit & Donahue (2011) Voit G. M., Donahue M., 2011, ApJ, 738, L24
- Voit et al. (1994) Voit G. M., Donahue M., Slavin J. D., 1994, ApJS, 95, 87
- Weedman et al. (2005) Weedman D. W., Hao L., Higdon S. J. U., Devost D., Wu Y., Charmandaris V., Brandl B., Bass E., Houck J. R., 2005, ApJ, 633, 706
- Wilman et al. (2005) Wilman R. J., Edge A. C., Johnstone R. M., 2005, MNRAS, 359, 755
- Wood et al. (1983) Wood P. R., Bessell M. S., Fox M. W., 1983, ApJ, 272, 99
- Wright et al. (2009) Wright E. L., Chen X., Odegard N., Bennett C. L., Hill R. S., et al., 2009, ApJS, 180, 283