Exploring X-ray and radio emission of type 1 AGN up to ††thanks: Tables 3–5 are only available in electronic form at the CDS via anonymous ftp to cdsarc.u-strasbg.fr (130.79.128.5) or via http://cdsweb.u-strasbg.fr/cgi-bin/qcat?J/A+A/
Abstract
Context. X-ray emission from Active Galactic Nuclei (AGN) is dominated by the accretion disk around a supermassive black hole. The radio luminosity, however, has not such a clear origin except in the most powerful sources where jets are evident. The origin (and even the very existence) of the local bi-modal distribution in radio-loudness is also a debated issue.
Aims. By analysing X-ray, optical and radio properties of a large sample of type 1 AGN and quasars (QSOs) up to , where the bulk of this population resides, we aim to explore the interplay between radio and X-ray emission in AGN, in order to further our knowledge on the origin of radio emission, and its relation to accretion.
Methods. We analyse a large ( sources) sample of type 1 AGN and QSOs selected from the 2XMMi XMM-Newton X-ray source catalogue, cross-correlated with the SDSS DR7 spectroscopic catalogue, covering a redshift range from to . Supermassive black hole masses are estimated from the Mg ii emission line, bolometric luminosities from the X-ray data, and radio emission or upper limits from the FIRST catalogue.
Results. Most of the sources accrete close to the Eddington limit and the distribution in radio-loudness does not appear to have a bi-modal behaviour. We confirm that radio-loud AGN are also X-ray loud, with an X-ray–to–optical ratio up to twice that of radio-quiet objects, even excluding the most extreme strongly jetted sources. By analysing complementary radio-selected control samples, we find evidence that these conclusions are not an effect of the X-ray selection, but are likely a property of the dominant QSO population.
Conclusions. Our findings are best interpreted in a context where radio emission in AGN, with the exception of a minority of beamed sources, arises from very close to the accretion disk and is therefore heavily linked to X-ray emission. We also speculate that the radio-loud/radio-quiet dichotomy might either be an evolutionary effect that developed well after the QSO peak epoch, or an effect of incompleteness in small samples.
Key Words.:
galaxies: active – X-rays: galaxies – quasars: general – quasars: emission lines – radio continuum: galaxies1 Introduction
Strong X-ray and radio emissions are properties that distinguish active galactic nuclei (AGN) from the whole population of galaxies. X-rays are the most direct manifestation of the accretion disk around a supermassive black hole (SMBH) at the centre of the galaxy hosting the AGN. Although radio emission is most apparent in a fraction of AGN, in particular in those classified as “radio-loud” (RL), which constitute % of the local AGN population, recent work shows that even radio-quiet (RQ) AGN exhibit a radio-emitting core, which might result from some sort of radio plasma arising in the vicinity of the SMBH. While optical emission in AGN is due to the superposition of thermal components coming from different distances from the nucleus, with a contribution of radiation reprocessed outside the AGN central engine, both X-rays and radio emission can be used to probe the immediate environment of the SMBH.
From the observational point of view, two quantities appear most relevant in exploring the possible link between radio emission and accretion: the UV-based radio-loudness, defined as (monochromatic fluxes in the rest frame; Stocke et al. 1992), and the Eddington ratio , where is the bolometric luminosity and [] is the limiting luminosity of Eddington (Eddington 1913; Rees 1984). Obtaining these quantities requires radio, UV and X-ray fluxes, plus reliable bolometric corrections and SMBH mass () estimates. In contradiction to earlier works, Ho (2002) showed that is uncorrelated with , but strongly anticorrelated with . This was interpreted by Ho (2002) in the framework of changes of the accretion mode, from a radiatively efficient standard accretion at to a radiatively inefficient ADAF (Advection Dominated Accretion Flow, which is prone to radio-emission) at lower Eddington ratios.
The local low-luminosity AGN population appears to show a dichotomy in radio-loudness, where two distinct populations appear to peak at (RL) and (RQ; Kellermann et al. 1989). This bimodality is not so apparent (or plainly non-existing) in deeper radio (White et al. 2000) or X-ray selected surveys (Brinkmann et al. 2000), where AGN samples display a continuous distribution in radio-loudness. It is then unclear whether there is something fundamentally different between strongly and weakly emitting radio AGN, and this is directly linked to the origin of radio emission in these objects.
With mass accretion rate largely regulating the luminosity of the AGN, the only other relevant parameter to modulate radio-loudness and whether an AGN develops or not a powerful jet, is the SMBH spin (Blandford 1990; Wilson & Colbert 1995). In a simple scenario where jets are formed in rapidly spinning SMBH, evolution by galaxy and associated SMBH mergers would naturally lead towards a SMBH population with low spin (Berti & Volonteri 2008). This would imply that smooth accretion (which tends to spin up SMBH) would be unimportant in the history of SMBH growth. However, the dependence of RL fraction on redshift and luminosity is still a strongly debated issue (e.g., Jiang et al. 2007, and references therein): the number of RL sources in the analyzed samples, not large enough to study their two-dimensional distribution in redshift and luminosity, and the wide range of selection criteria used to define the samples observed contribute to a large range of contradicting results.
Sikora et al. (2007) extend this view by showing that the anticorrelation between and comes in two parallel tracks, one for RL AGN residing in elliptical galaxies and one (lower) for RQ AGN residing in spiral galaxies. They propose a revised spin paradigm, where elliptical galaxies (and thence RL AGN) host highly spinning SMBH as a result of at least one major merger in the past, while spiral galaxies (and thence RQ AGN) underwent mostly chaotic accretion, i.e., accretion of small mass fragments with random angular momenta. But since highly accreting luminous QSOs residing in ellipticals are largely RQ, speculations that radio emission might be intermittent have been put forward. Most recent versions of the spin paradigm call for retrograde systems (where the SMBH and the accretion disk counter rotate) as the mechanism to extract the most powerful jets (Garofalo et al. 2010). RL AGN are mostly assumed to be retrograde, and RQ prograde. Natural evolution tends to make all SMBH-accretion disk systems prograde, which would explain the overwhelmingly large fraction of RQ AGN in the local Universe.
The release of large catalogues of fairly deep X-ray and radio sources, along with the optical photometry and spectroscopy provided by the Sloan Digital Sky Surveys (SDSS; see Abazajian et al. 2009, for the final public data release from SDSS-II), calls now for a study of the relation between accretion and radio properties in large samples of AGN. This is of particular interest to infer the physical origin of the radio emission. In this study we use the incremental Second XMM-Newton Serendipitous Source Catalogue (2XMMi; Watson et al. 2009), which we correlate with the SDSS Data Release 7 (DR7) to select a sample of X-ray detected type 1 AGN and QSOs. In this way, we use independent data to estimate the bolometric luminosity (from the X-ray data and suitable bolometric corrections) and the SMBH mass that we estimate from the SDSS spectra using the Mg ii broad emission line. The latter effectively limits our sample to , which is however enough to encompass the peak of the QSO activity epoch at around . Note that we do not include type 2 AGN in this study, in part because the mass estimates based on other proxies (e.g., the [O iii] line width) are more uncertain and would compromise the homogeneity of our study. Radio information is obtained from the FIRST-VLA catalogue (Becker et al. 1995).
The paper is organized as follows. In Section 2 we describe the selection method used to generate the samples; Section 3 is devoted to recover the nuclear properties (i.e., SMBH masses, nuclear bolometric luminosities, and Eddington ratios). In Section 4 radio-loudness properties are discussed and compared with results from the literature. Finally, in Section 5 we summarize our work. Throughout this paper, a concordance cosmology with km s-1 Mpc-1, , and (Spergel et al. 2003, 2007) is adopted. The energy spectral index, , is defined such that . The photon index, defined as , where is the photon energy, is .
2 Sample selection
The starting point for the present work is the cross-correlation of the 2XMMi with the SDSS DR7 carried out by Pineau et al. (2011).
The 2XMMi catalogue is an extended version of the 2XMM catalogue, covering % of the sky (Watson et al. 2009); in their analysis, Pineau et al. (2011) considered only point-like sources having a positional error smaller or equal to , obtaining an initial sample of unique 2XMMi sources.
To construct the initial list of optical candidate counterparts, among the more than million distinct objects contained in the SDSS DR7 Photometric Catalog (Abazajian et al. 2009), only the so-called primary sources were considered. To perform the correlation, a query centred in the centre of the FOV of each XMM-Newton observation was then run, with a search radius equal to the distance from the centre to the farthest X-ray source increased by .
The counterpart identification was performed by computing a likelihood ratio, defined as the probability of finding the optical counterpart at a normalized distance divided by the probability of having a spurious object at the same distance. The applied formalism, aimed at providing probabilities of identification based on positional coincidences only (no other information such as spectral energy distribution were used) led to X-ray sources with more than % probability of identification in the DR7. At this threshold, Pineau et al. (2011) estimated only % spurious matches and a % completeness.
We were interested in weighting the black hole in the centre of a sample of AGN using the width of optical lines emitted from the Broad Line Region (BLR), namely the Mg iiÅ (see Sect. 3). Among the X-ray selected sources detected in the SDSS, we then considered objects that were targets of optical spectroscopic follow-up in the SDSS, and classified as qso or galaxy111We do not consider hiz_qso (specClass), whose high redshift () implies the exit of the Mg ii line from the SDSS spectrum. (specClass parameter equal or , respectively222See http://cas.sdss.org/astrodr7/en/help/docs/enum.asp?n=SpecClass). Among those, we limited ourselves to the showing in their spectra a Mg ii line broad enough to have its origin in the BLR, specifically FWHM(Mg ii)km s-1.
Recently, Shen et al. (2011) presented a compilation of properties of the sources in the SDSS DR7 quasar catalogue (Schneider et al. 2010); out of the sources just mentioned are in this catalogue, the rest being Seyfert galaxies. The fit to the Mg ii line in of those provides null values for the FWHM or the : we then removed these sources from our sample. We are therefore left with X-ray selected type 1 AGN ( QSOs and with Seyfert-like luminosity).
We collected information about radio emission for our sample by cross-correlating it with the Faint Images of the Radio Sky at Twenty-cm (FIRST; Becker et al. 1995) survey. The sky coverage of the FIRST survey implies that only sources ( QSOs) out of fall in the FIRST fields, with detections ( among the QSOs). Being interested in studying the radiation arising from their nuclear regions, only the core emission should be considered. Following Shen et al. (2011), out of radio-detected QSOs have multiple FIRST source matches within ″. Comparing the contribution to the radio emission at the SDSS source position expected from the different FIRST components, we found that for all but one of these QSOs with multiple matched FIRST sources, the off-nuclear contamination is not negligible (%): these not core-dominated QSOs were therefore removed. A visual inspection of the FIRST images confirms that the rest of the detected QSOs and the radio-detected sources with Seyfert-like luminosity have only one FIRST source within the FIRST resolution.
Our final sample (hereafter, “main sample”) is composed by X-ray selected type 1 AGN ( QSOs and with Seyfert-like luminosity); out of them, fall in the FIRST fields, with detections ( among the QSOs). A summary of this sample is presented in Table 1.
| “main sample” | “control sample” | |||
| TOTAL | ||||
| in FIRST | ||||
| (radio det. - radio undet.) | ( - ) | ( - ) | ||
| Radio class.: | RL | |||
| det. RI | ||||
| non-RL | ||||
| RQ | ||||
| n.c. | ||||
| in ROSAT | ||||
| in ROSAT & in FIRST | ||||
| (radio det. - radio undet.) | ( - ) | ( - ) | ||
| Radio class.: | RL | |||
| det. RI | ||||
| non-RL | ||||
| RQ | ||||
| n.c. | ||||
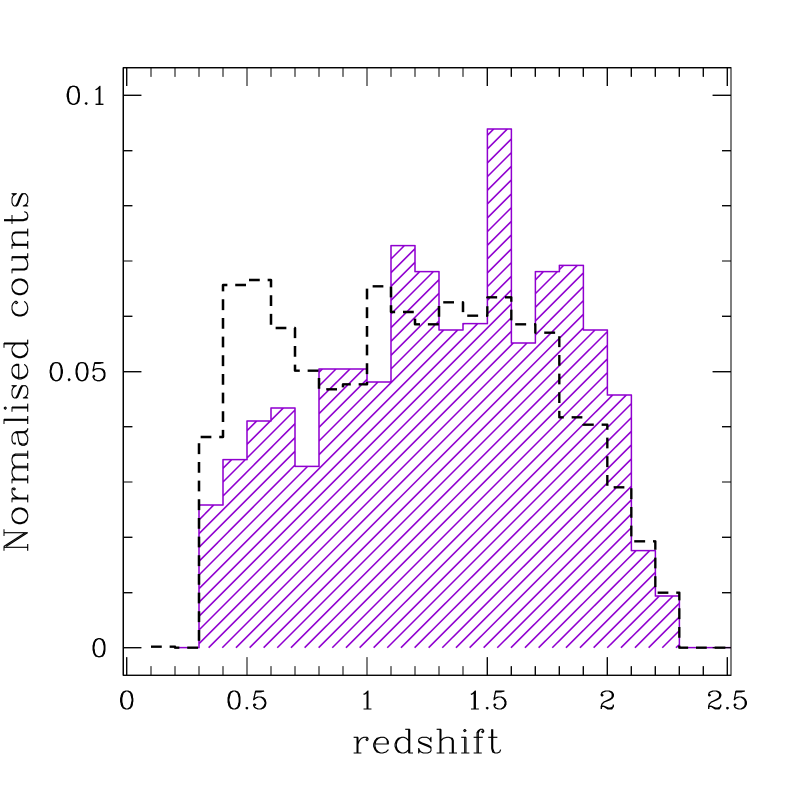
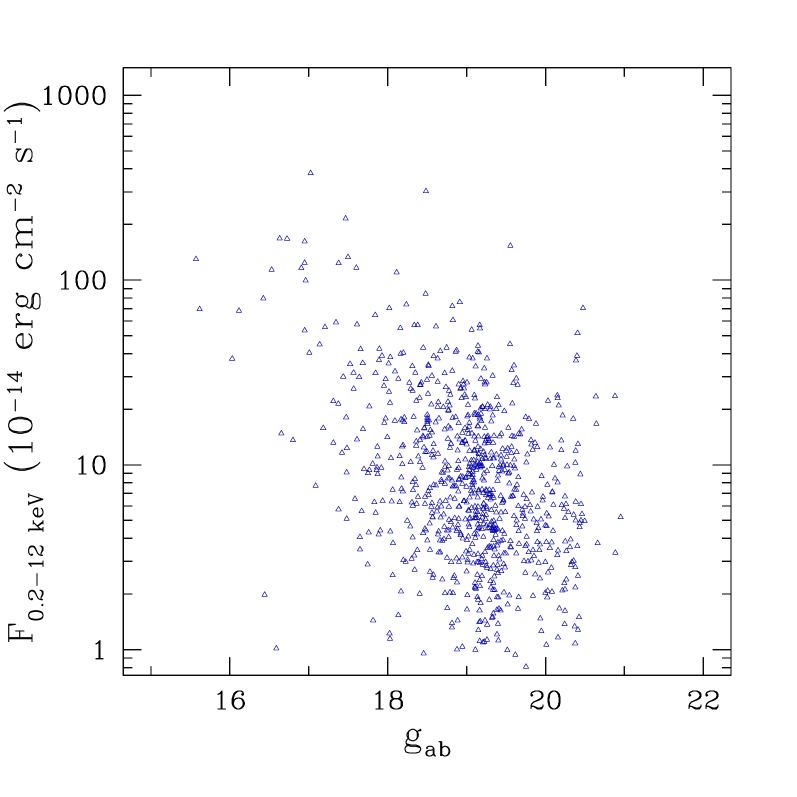
Basic information is listed in Table 3, only available in electronic form at the CDS333See http://cdsweb.u-strasbg.fr/A+A.htx; for convenience of the reader, we show here a portion. As noted before, the requirement of covering with the SDSS spectra an energy range containing the Mg ii line imply a cut in distance; our sources have redshifts more or less uniformly distributed between and (see Fig. 1, left panel). In Figure 1 (right panel) the sample distribution in the optical–X-ray flux plane is reported.
We note that the main characteristic of our sample is to be X-ray-selected. In order to check for possible selection biases, and to test our findings in terms of nuclear properties, we constructed a “control sample” by searching for SDSS radio sources matching the same optical constraints adopted to construct our main sample, either falling in a region not covered by XMM-Newton, or not detected in X-rays. We found objects in the SDSS-FIRST cross-correlation having Mg ii line widths and optical spectroscopic classifications satisfying the criteria previously described, not included in the 2XMMi catalogue; of them are classified as QSOs by Schneider et al. (2010). Rejecting the QSOs for which Shen et al. (2011) do not provide valid black hole masses from the Mg ii line, we are left with sources. In the same way as we have done for the “main sample”, we calculated the off-nuclear contamination for the sources showing multiple matches in the FIRST images within ″; this analysis drove us to remove from the sample all but four not core-dominated AGN. The “control sample” is therefore composed by radio-detected type 1 AGN ( QSOs and with Seyfert-like luminosity); their redshift distribution is overplotted in Figure 1 (left panel), while their classification in terms of radio properties is summarized in Table 1.
Only out of this “control sample” ( classified as QSOs) fall in one or more of the XMM-Newton fields used to construct the 2XMMi, and show positive “good exposure time” in at least one of the EPIC cameras. Thanks to FLIX444See http://www.ledas.ac.uk/flix/flix.html, the flux upper limit server for XMM-Newton data provided by the XMM-Newton Survey Science Center (SSC), we obtained for all these X-ray undetected AGN an upper limit in the keV flux. Basic information for these sources is reported in the second part of Table 3.
From this point of view, useful information can be obtained considering the match between the two samples and the ROSAT All-Sky Survey (RASS; Voges et al. 1999). In the “main sample”, out of the ROSAT-detected sources are radio-detected; objects in the “control sample” are ROSAT-detected.
3 Recovering the nuclear properties
The spectral information provided by the 2XMMi and the SDSS DR7 catalogues has been used to study the nuclear activity of the galaxies in our sample. The black hole (BH) masses were derived from the optical measurements (continuum and line width), while we estimated the bolometric luminosity from the X-ray flux. The use of data from different energy ranges allows an independent determination of the two parameters. A discussion of the error estimates is presented in Sect. 3.4. Optical- and radio-based parameters have been calculated also for the “control sample”; X-ray-based quantities have been obtained for the sources for which upper limits to the X-ray flux were obtained.
3.1 Black hole masses
For each source, the mass of the central compact object was estimated from the so-called mass-scaling relations using broad-emission-line widths and nuclear continuum luminosities (Kaspi et al. 2000, 2005; Vestergaard & Peterson 2006; Vestergaard et al. 2008, and references therein). Being interested in exploring in a uniform way (i.e., using the same proxy for all the sources) the BH masses and accretion rates in a sample of AGN extended up to (relatively) high redshift, the best choice is the relation based on the Mg ii emission line. For the subsample of QSOs, we adopted the mass obtained by Shen et al. (2011, LOGBH_MGII_VO09 column in their catalogue) adopting the recalibration proposed by Vestergaard & Osmer (2009):
| (1) |
for Å, with a scatter in the logarithmic zero-point of dex.
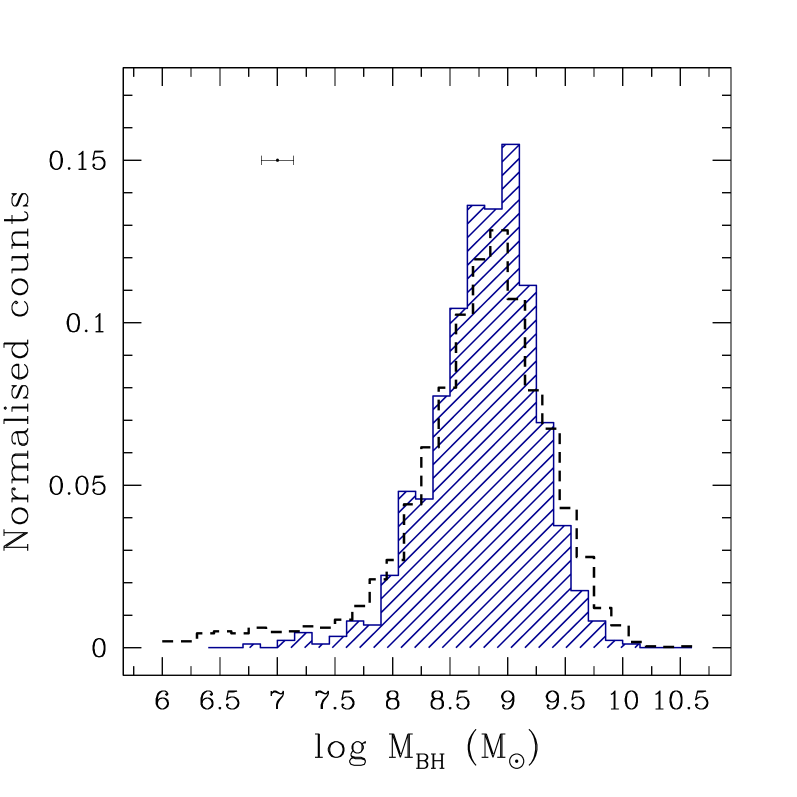
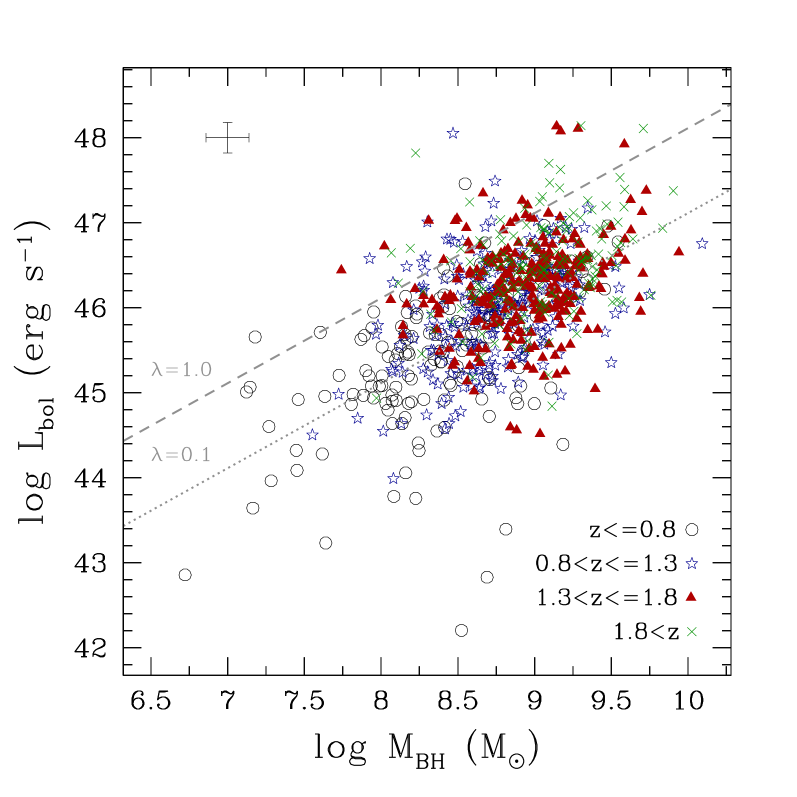
For the X-ray selected AGN (and for the sources in the “control sample”) not present in the QSO catalogue, we adopted the same relation; the intrinsic FWHM was obtained from the observed standard deviation of the Mg ii line, as reported in the SDSS catalogue, while the monochromatic continuum luminosity was estimated using a typical QSO template. We adopted the composite spectrum provided by P. Francis555See http://msowww.anu.edu.au/pfrancis/composite/widecomp.d in 2002, updating the original template presented by Francis et al. (1991). To normalize the template, we used the continuum flux observed under the line, as reported in the SDSS catalogue (see Table 3). The derived line widths, continuum luminosities, and BH masses are reported in Table 4 (also in this case, the entire table is available in electronic form). We found rather high masses, narrowly distributed between and (see Fig. 2, left panel; the distribution for the “control sample” is overplotted).
3.2 Bolometric luminosities
Concerning the bolometric luminosity, several bolometric corrections, starting from the emission at various wavelengths, can be found in the literature. The results obtained from such relations must be taken with care, being based on average SEDs, assumed to describe the broad-band emission of quite different sources; moreover, the emission observed in each energy range could be affected by contamination due to different external and/or reprocessed components, and these contributions could be extremely difficult to evaluate. Nevertheless, they provide a powerful tool to investigate the physics of the nucleus. Here, we took advantage of having high-energy information, directly linked to the AGN innermost regions and less affected by obscuration. We derived the hard X-ray luminosity in the keV energy range from the EPIC-pn keV flux (provided in the 2XMMi catalogue) corrected for the Galactic absorption, assuming as intrinsic emission a power law with fixed to .
Note that in case of absorption, the intrinsic emission would be more intense than estimated here; a similar result would be produced if the real observed spectrum is flatter than . Therefore, the X-ray luminosity adopted here can be in principle lower than the intrinsic one (see e.g. Panessa et al. 2006). From the analysis of the hardness-ratios presented in Sect. 4.1, we expect a mean correction factor of , with a maximum value of .
To estimate the bolometric luminosity, we assumed the luminosity-dependent X-ray bolometric correction () following Marconi et al. (2004):
with a scatter (taken by the authors to be independent of the luminosity).
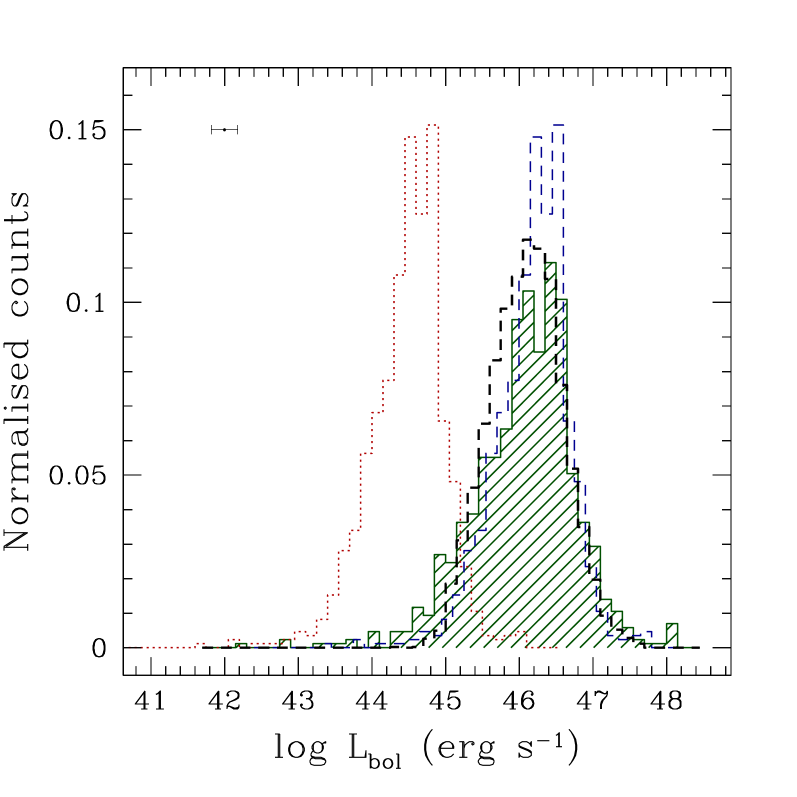
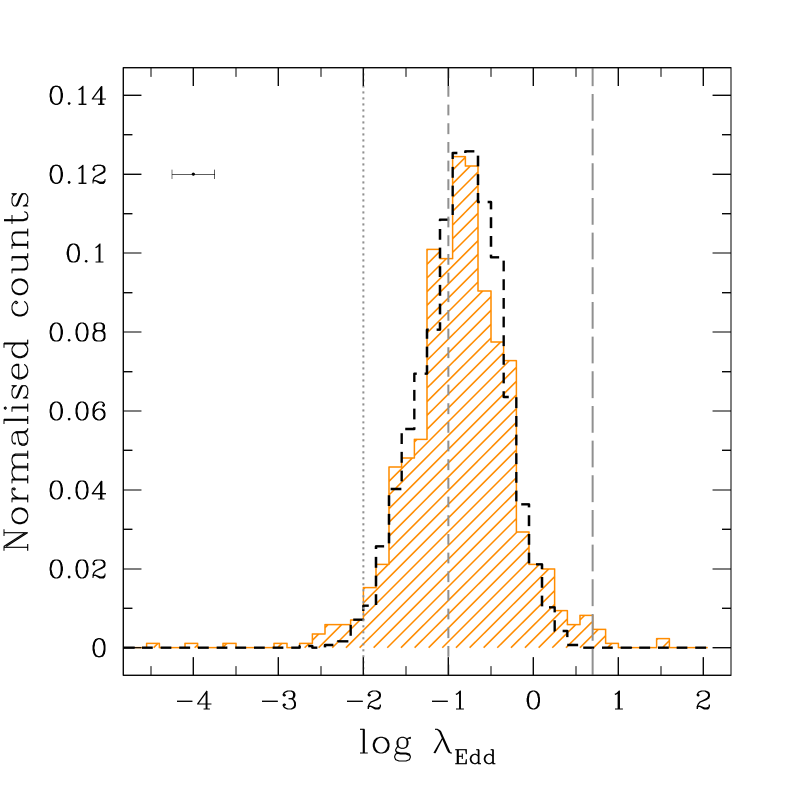
In Figure 2 (central panel) we present the distribution of bolometric luminosities (green shaded histogram; the red dotted line superimposed represents the distribution of intrinsic X-ray luminosity in the keV energy range. The former is clearly broader, as expected due to the assumption of an increasing luminosity-dependent bolometric correction. The effects of possible intrinsic absorption on the bolometric luminosities are slightly higher than in the case of the X-ray luminosity, although still rather low (mean correction factor , with a maximum value of ).
Our results critically depend on the bolometric luminosities recovered, then in turn on the correction applied to the X-ray luminosities. The selection of the best X-ray bolometric correction is not a trivial issue. Depending on the studied sample, the range of the electromagnetic spectrum used to reconstruct the SEDs, and whether the reprocessed emission was considered, different solutions have been proposed. Some authors considered luminosity-dependent , (e.g., Marconi et al. 2004; Hopkins et al. 2007), suggesting changes in the physics of the disk-corona system with the intensity of the nuclear emission, whereas others found corrections with a very shallow or absent correlation with X-ray luminosity (e.g., Elvis et al. 1994; Richards et al. 2006; Marchese et al. 2012). As expected due to the luminosity-dependent expression adopted, the distribution shows a significant spread (ranging from up to few hundred). However, although slightly broadened at low values, our distribution of from the luminosity-dependent correction from Marconi et al. (2004) is roughly consistent with that obtained assuming a mean constant value (see Fig. 2, central panel, blue dashed line).
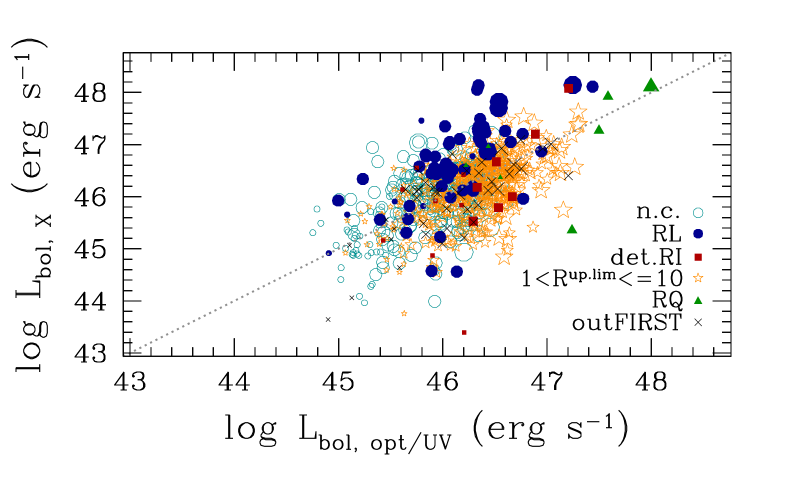
Although their origin in the innermost region of the AGN makes the X-rays the most direct proxy of the total emission, we have reworked our calculations with the bolometric luminosities obtained from optical/UV observations. We considered the values reported by Shen et al. (2011), computed from optical/UV continuum luminosities at different wavelength depending on the source redshift, at , at , and at , and adopting the bolometric corrections from the composite SED in Richards et al. (2006). As noted by the authors, the global SED from Richards et al. (2006) also counts the infrared (IR) bump in estimating the bolometric corrections; removing the IR radiation, assumed to come from the reprocessed UV radiation, reduces the bolometric corrections by about one third. In the same way, we estimated a bolometric luminosity for the QSOs in the “control sample”, which lack X-ray information; its distribution is overplotted as black dashed line in Figure 2 (central panel). In Figure 3, for the QSOs in the “main sample” we compare our X-ray based with that derived from the optical/UV, with the correction for the IR contribution applied. We note a slight departure from the one-to-one relation for sources with important radio emission with respect to the optical/UV radiation (RL; see below) in the highest redshift bin (). Nevertheless, the good agreement found for these objects among the two estimates of (consistent at a level) over a significant range in luminosity reassures us on the reliability of our approach.
3.3 Eddington ratios
The analysis performed allowed us to investigate the accretion powering these systems. In particular, Eddington ratios can be calculated as the ratio between bolometric and Eddington luminosities, where / [] represents the exact balance between inward gravitational force and outward radiation force acting on the gas. Since the AGN luminosity is directly proportional to the accretion rate, is a measure of the accretion rate relative to the critical Eddington value.
We found rather high Eddington ratios (see Fig. 2, right panel, and last column in Table 4): for more than half of the “main sample” we found between and , while only % show . If we were to correct X-ray luminosities for the intrinsic absorption estimated from the hardness-ratio analysis, would only increase . No significant trend with the redshift is observed (see Fig. 4).
Super-Eddington accretion is found for sources. Luminosities exceeding the Eddington limit can be observed if accretion is not spherically symmetric (Osterbrock 1989); it has been suggested that accretion disks with radiation-driven inhomogeneities could produce luminosities exceeding the Eddington value (Begelman 2002). Eddington ratios close to, or even higher than, unity are often estimated for the subclass of Narrow-line Seyfert 1 galaxies (e.g., Collin et al. 2002; Collin & Kawaguchi 2004).
3.4 Error budget
Among the measurements obtained from the different catalogues used in this work, error estimates are available for the
FWHM(Mg ii), the X-ray flux in the keV energy range observed frame, and the radio flux at GHz observed
frame.
Moreover, in our determination of the nuclear parameters, we made a number of assumptions that must be taken into
account when discussing the global uncertainties.
Errors for the are provided by Shen et al. (2011, LOGBH_MGII_VO09_ERR column in their catalogue); for the sources not comprised in their catalogue (in the “main sample” and in the “control sample”, and objets, respectively), the errors are evaluated considering three different contributions666We note that no errors on the flux under the line are provided in the SDSS tables.:
-
•
The uncertainties associated with the width of the Mg ii line, provided by the SDSS catalogue, typically of the order of %.
-
•
A systematic error induced by the selection of one spectral shape common to all the sources for the optical emission: for each source, starting from a spectral shape we determine the scatter in the optical luminosity due to a different choice in the slope (, averaging out the rest-frame spectra of SDSS QSO; F. Fontanot, priv. comm.). The scatter in the (@Å), calculated assuming as a pivot the flux below the Mg ii line, is of %.
-
•
The scatter in the phenomenological relation described by equation (1).
When propagated to yield the uncertainties of the BH masses, the third factor always prevails over the first two.
Considering the whole “main sample”, the uncertainties on are lower than %
Uncertainties in the optical fluxes at Å and Å rest-frame (see Sect. 4) were obtained
assuming again for the slope in the optical continuum, with fluxes below the Mg ii and Å lines as pivot, respectively.
The resulting scatters are % and %, respectively.
We identify two possible sources of uncertainty in our estimate of the bolometric luminosity:
-
•
The error in the normalization in equation (3.2).
-
•
The uncertainties in the X-ray luminosities, obtained from the error on the flux provided by the 2XMMi catalogue. This contribution affects the bolometric luminosities in a non-linear way, given the luminosity-dependent bolometric correction.
The resulting uncertainties on are lower than %; through quadratical sum propagation, we
obtain a mean error on of .
Finally, for the radio flux we need to combine two sources of error:
-
•
The uncertainties associated with the FIRST radio flux.
-
•
A systematic error induced by the selection of one spectral index common to all the sources (see Sect. 4), estimated assuming a change in the radio spectral index of %.
The relative errors, , are lower than % for both the radio-detected sources and the radio-undetected sources, for which we assumed the flux limit of the FIRST survey (see Sect. 4), respectively. This translates in the following mean relative errors for the radio-loudness and the X-ray loudness parameters (defined as ; see Sect. 4.2): and , of and (radio-detected), and and (radio-undetected), respectively.
4 Radio loudness
The importance of the radio emission in a source is generally described using the radio-loudness parameter. In this paper, we adopt the definition with the reference band in the UV, a range less affected by the host galaxy contribution (Stocke et al. 1992):
| (3) |
instead of the classical ratio with respect to optical -band flux. As done previously, the UV continuum flux was calculated using the QSO template, normalized to the continuum flux under the Mg ii line, as reported in the SDSS catalogue. About QSOs are in common with Strateva et al. (2005), where the authors calculated luminosities by fitting SDSS spectra (after dereddening and correcting for fibre inefficiencies, and also subtracting host-galaxy emission). Comparing the UV luminosities for these sources, we find close agreement (mean difference of %, with a standard deviation of ). This result reassures us on the accuracy of our approach.
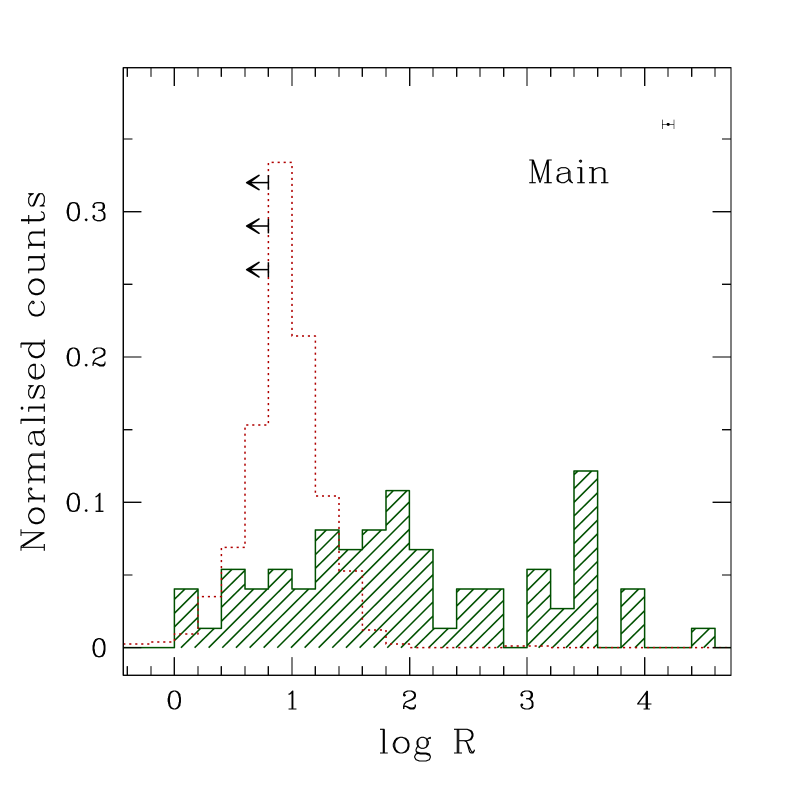
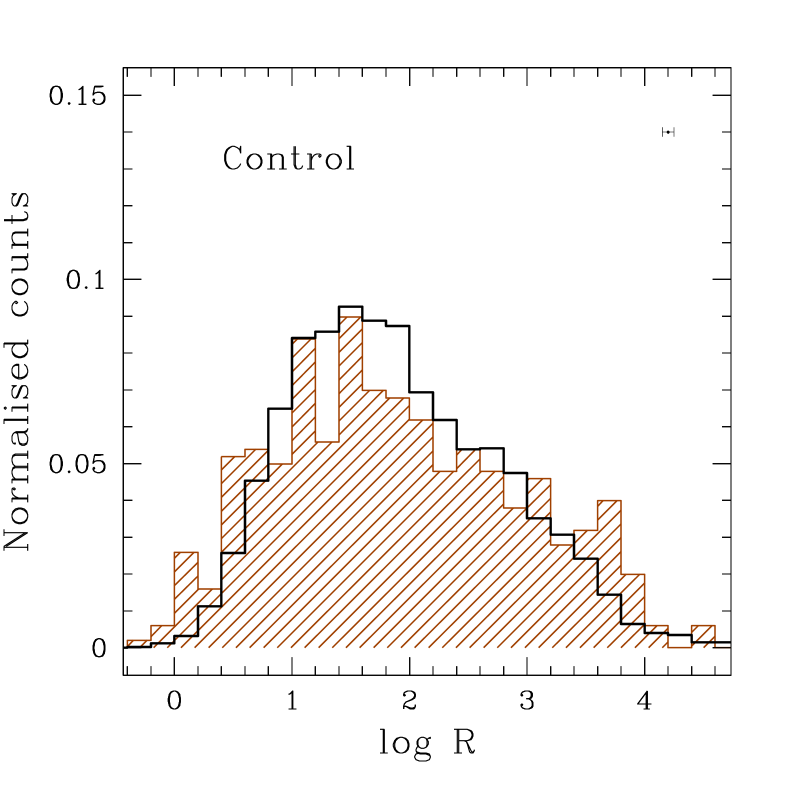
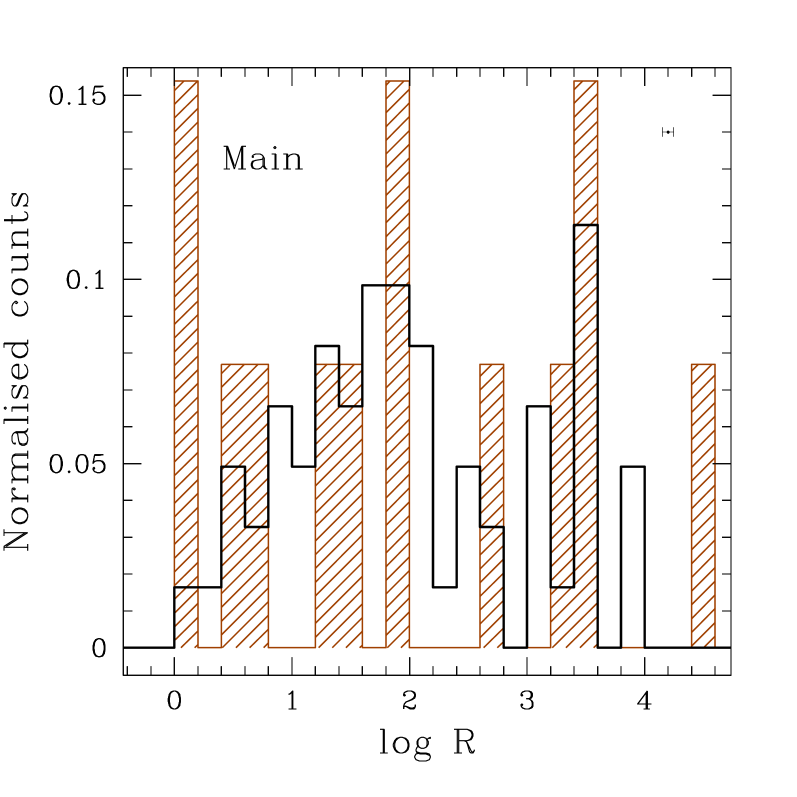
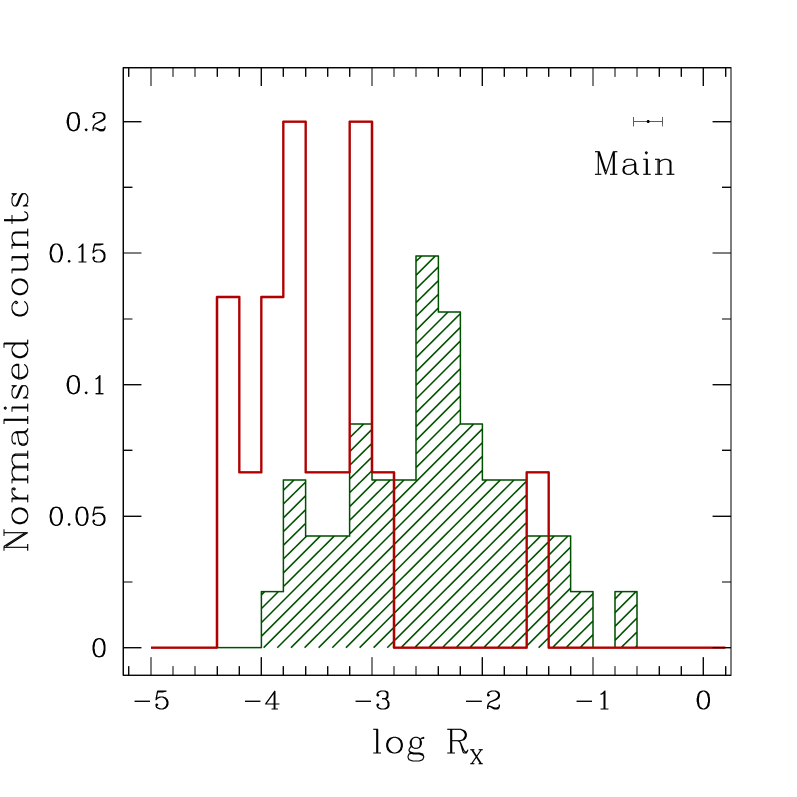
For the detected sources in the “main sample”, as well as for the “control sample”, the radio flux was obtained from the FIRST integrated flux density at GHz (observed frame; FINT), assuming a power-law spectrum with index . For the nondetected sources, from the flux limit of the FIRST survey (mJy) and the optical flux, we calculated an upper limit to the radio-loudness parameter. The distributions of both and for the “main sample” are shown in Figure 5 (left panel). The radio properties of the subsample falling in the FIRST fields are reported in Table 5; the second part of the Table contains the same quantities for the X-ray-undetected sources in the “control sample”.
From Figure 5 (left panel), it is evident that the detected sample is distributed rather uniformly in terms of the parameter (green shaded histogram). As thresholds, we assumed and (values typically used in literature, e.g. Miller et al. 2011). Out of the detected sources, are RL (all but two QSOs) and have a radioloudness parameter intermediate between the two boundary values (RI, all QSOs); we have no detected RQ. The nondetected sources with can be safely classified as RQ, while for the radio-undetected AGN with we can only exclude a RL classification. Finally, for the undetected sources with , we are not able to give a radio-loudness classification.
For the QSOs with sensitive radio measurements, P. Francis produced sub-composites of RL and RQ777See http://msowww.anu.edu.au/pfrancis/composite/lbqs_rl_comp.d and http://msowww.anu.edu.au/pfrancis/composite/nonbal_rq_comp.d, respectively. We checked the UV fluxes and our radio-loudness classification, both derived assuming the total composite QSO spectrum, using the two sub-composites; the results are in agreement within the errors.
The lack of a clear dichotomy in the distribution of is in agreement with the trend of recent works showing that the classical gap between RL and RQ fills up when deeper and complete samples are considered (e.g., Miller et al. 2011). A different result might be obtained if the narrow distribution of upper limits to (red dotted line in Fig. 5, left panel) corresponds to a broader real distribution, peaking at lower values. In particular, the radio-detected subsample is characterized by a rather high , median value . This could be partially due to a selection bias: if high X-ray emission implies high enough radio emission, the X-ray selection can cause a loss of RQ sources.
The distribution of for radio sources for which upper limits to the X-ray emission are available would give important information to confirm or deny this hypothesis. Unfortunately, the low number of AGN with X-ray upper limits in the “control sample” () prevents us from drawing firm conclusions, although their distribution seems consistent with that found for the “main sample”. This suggestion is reinforced when we consider the match with the RASS: comparing the distribution of ROSAT-detected ( out of ) and ROSAT-undetected sources in the “control sample”, we found no statistical difference in terms of radio loudness (KS probability of ; see Fig. 5, central panel). The same result is obtained when considering the radio-detected sources in the “main sample”: comparing ROSAT-detected ( out of ) and ROSAT-undetected sources, the hypothesis of the same original population is confirmed with a KS probability of (see Fig. 5, right panel); this means that a detection or non-detection by ROSAT does not relate to radio-loudness. The same appears to be true (albeit with a much smaller sample) for XMM-Newton hard X-ray detection or non-detection.
The wide range in redshift spanned by our sample can introduce evolutionary effects in the observed distribution of parameters. To evaluate its importance, we divided our sample in bins of redshift, having a comparable number of sources. We do not find clear evidence of redshift evolution in the RL population: the change in the when a constant is replaced with a straight line (from to ) implies an F-test probability . On the other hand, the high number of upper limits compared with the number of detected RI does not allow us to draw firm conclusions regarding the evolutionary pattern in this subclass. Again, to better investigate the evolutionary effects, we would need detections instead of upper limits. From the present data, we conclude that the size and depth of our sample is the main reason of filling the gap between RL and RQ, rather than evolutionary effects. If they exist, they must developed well after the QSO peak epoch studied here.
| (1) | (2) | (3) | (4) | (5) | (6) | (7) |
|---|---|---|---|---|---|---|
| “main” | RL | |||||
| det. RI | ||||||
| RQ | ||||||
| “control” | RL | |||||
| det. RI | ||||||
| RQ |
Sample. Radio loudness classification. - Redshift bins.
4.1 Eddington ratios vs radio-loudness
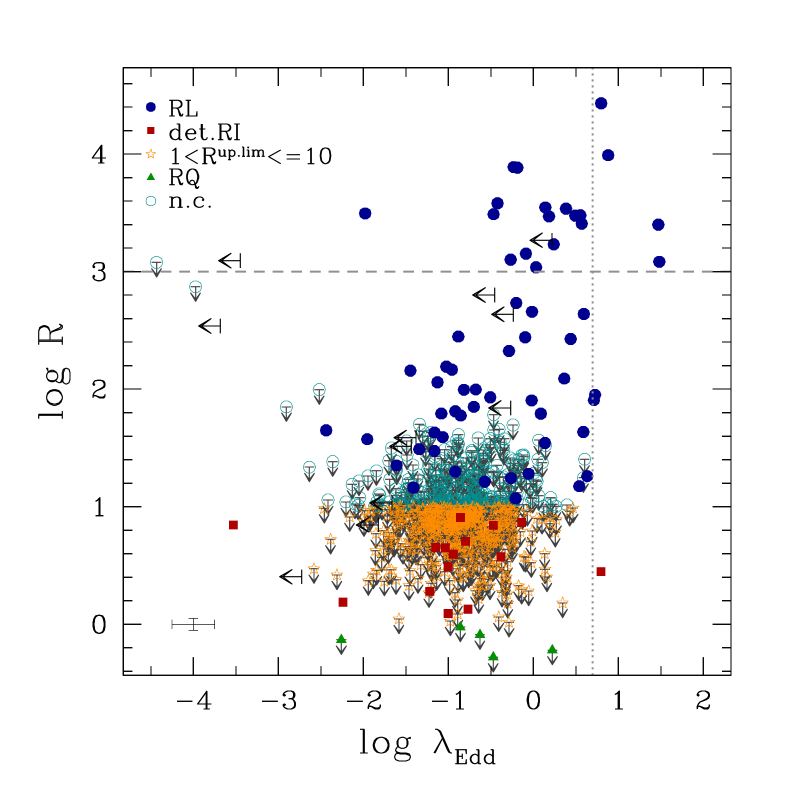
Comparing Eddington ratios and radio-loudness for the sources falling in the FIRST survey area, we see an apparent trend of increasing with (see Fig. 6). We checked the significance of the correlation using both a generalized Kendall rank correlation test () and a Spearman rank correlation test (), finding a probability lower than % in both cases that a correlation is present only due to chance. We used the ASURV package (Feigelson & Nelson 1985; Isobe et al. 1986, Astronomy Survival Analysis), that facilitates a correct statistical analysis when censored data (upper limits in this case) are present, although the errors are not considered in the calculations. This positive correlation is in contrast with previous results, that found an increase of radio loudness with decreasing Eddington ratio (e.g., Ho 2002; Merloni et al. 2003; Nagar et al. 2005; Sikora et al. 2007). We note, however, the different range covered, narrower both in and in our sample than in previous works (e.g., Sikora et al. 2007, between and , and between and ; cf. their fig. 3).
The higher Eddington ratios observed for sources more RL could either denote a difference in the accretion mechanisms powering AGN with different radio-loudness, or can be related to our assumptions when calculating . Note that using a constant X-ray bolometric correction, , instead of a luminosity-dependent one, the distribution of would become a little narrower but without changing in any significant way our results.
In principle, in RL sources the observed X-ray flux could be “contaminated” by contribution from a kpc-, or even pc-scale X-ray jet emission, not resolvable with XMM-Newton, making problematic to recover the accreting bolometric luminosities. The fraction of X-ray emission in RL AGN that is from the jet, is a strongly debated issue. The spurious non-nuclear emission is typically observed to be only a few percent as bright as the X-ray core (e.g., Marshall et al. 2005), which would not significantly change the calculated values. Figure 3 confirms these considerations, suggesting that the overestimate of due to jet contamination is relatively low.
Otherwise, the spectral energy distribution (SED) may be different in RL and RQ AGN, with a coronal contribution much more important with respect to the optical emission in the former than in the latter. In this case, applying a bolometric correction obtained mainly from RQ AGN would overestimate the optical emission, leading to a bolometric luminosity too high. Indeed, because of these difficulties in determining the true SED linked to the accretion disk, most studies of the X-ray bolometric correction have been performed excluding RL sources from the study of the nuclear properties. In the sample studied by Vasudevan & Fabian (2007), RL objects occupy the region of higher hard X-ray luminosities and lower X-ray bolometric correction (see their fig. 3). For one object, 3C 273, the authors are able to estimate the importance of the jet contribution, comparing old ASCA data with new XMM-Newton observations taken at a historic jet minimum. Interestingly, despite an increasing of that moves the object in the upper-left direction in the vs. diagram, 3C 273 still falls significantly below the Marconi et al. (2004) relation.
In most cases, the quality of the X-ray data does not allow us to perform a detailed spectral analysis. We limited ourselves to check whether the hardness ratios () of the two classes are compatible with a steeper, accretion-dominated spectrum or with a flatter spectrum; the latter could be due to a jet-dominated emission, or to a different disk-corona structure. This analysis allows us to investigate, at least from a statistical point of view, also the presence of intrinsic absorption, trying to quantify its effects.
We considered defined from both soft and hard bands, dividing the “main sample” into RL () and non-RL (; see Table 1); the non-classified sources are excluded from the analysis. The hard hardness ratio, (where and are the vignetting-corrected count-rates between and keV observed frame, and between and keV observed frame, respectively), less affected by absorption, is more directly linked with nuclear emission than the constructed from the whole X-ray band. On the other hand, comparing (where and are the vignetting-corrected count-rates between and keV observed frame, and between and keV observed frame, respectively) can provide information on the possible presence of absorption. Indeed, the spectral modification induced in a typical AGN spectrum by matter absorbing the nuclear emission, can mimic, in the total hardness ratio, a flatter (or even inverted) power law.
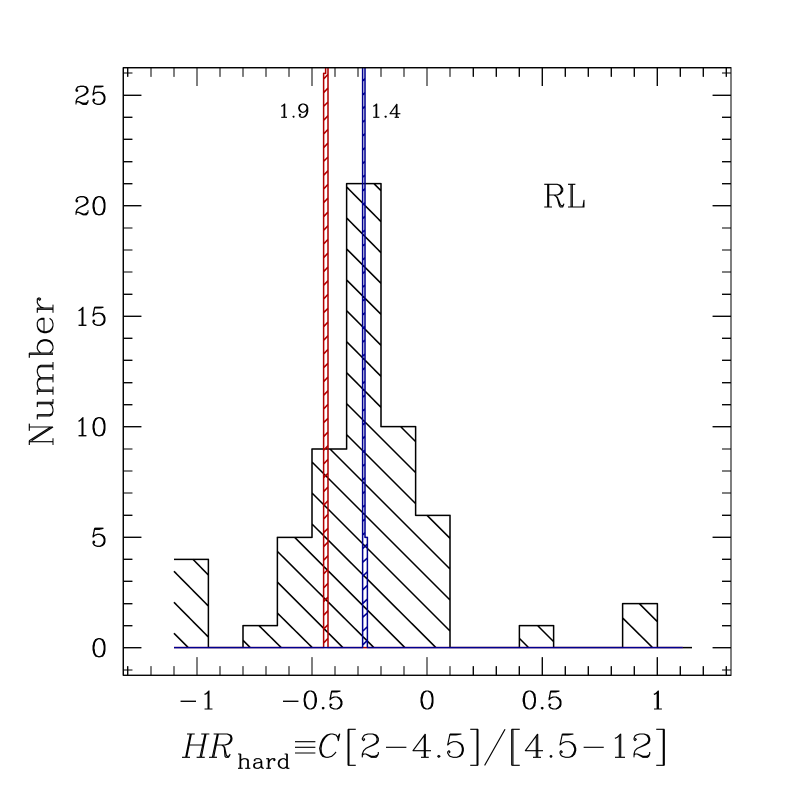
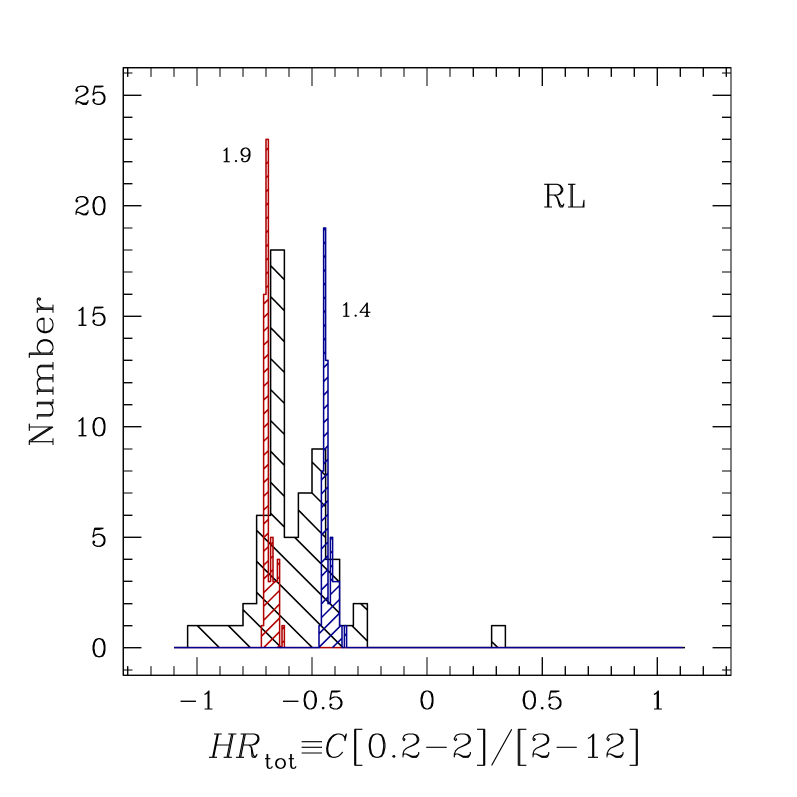
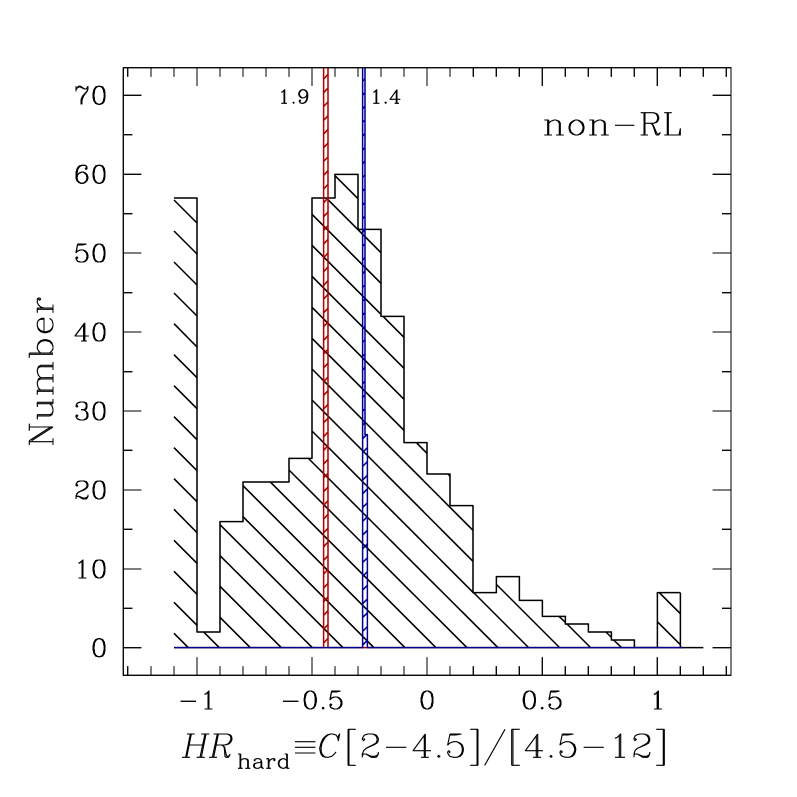
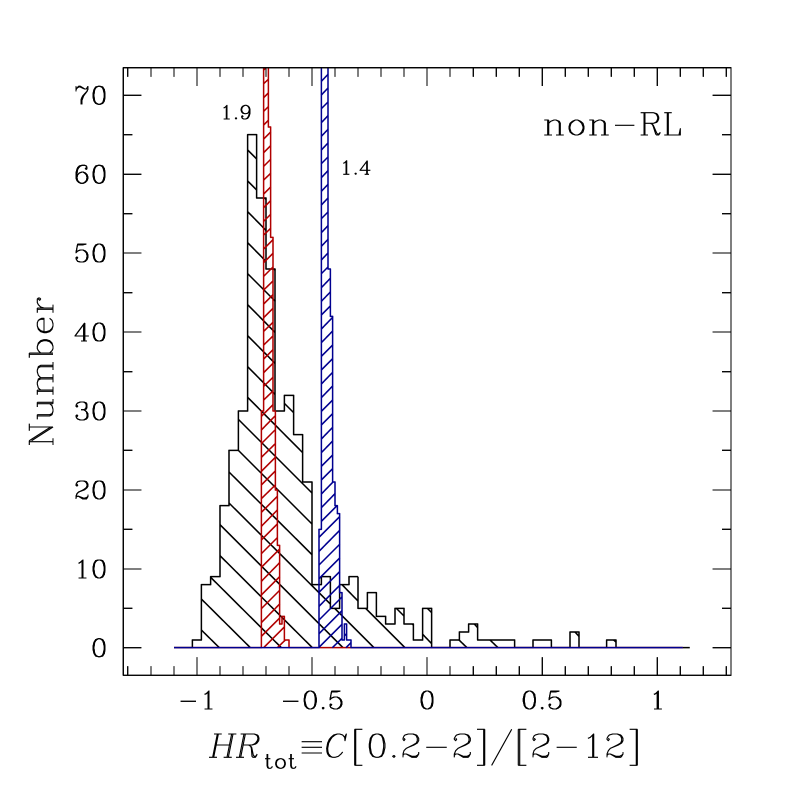
In Figure 7 we show the observed distributions for RL (upper panels) and non-RL (bottom panels) sources (hard , left panels; total , right panels). From a KS test, the probability of the RL and non-RL subsamples being drawn from the same population is lower than % in terms of both . We then compared the observed with that expected from a jet-dominated or a disk-dominated emission (power law with or , respectively), to investigate whether the X-ray colours reflect some difference in the components contributing to the observed emission. The distributions expected for the “main sample” assuming a simple power-law emission covered by Galactic absorption are overplotted to the observed ones in Figure 7. Note the slight broadening of the expected distributions of , due to the absorption of our Galaxy and to the different redshifts of the sources.
The dispersion in the distributions is too large to allow us to draw firm conclusions. We note, however, that the suggest flatter photon indices for RL sources than for non-RL sources: and , to be compared with and . On the other hand, is not consistent with a strong jet contribution for both RL and non-RL sources: and , while .
For % of the non-RL subsample ( sources), the analysis of the suggests a photon index flatter than ; we investigated the possible presence of absorption in this subsample. For each source, we calculated the expected for an intrinsic power-law emission with , covered by a distribution of matter with spanning from to . The observed ratios can be reconciled with the assumption of assuming a column density lower than for % of the sources. Interestingly, when the same exercise is performed for the whole subsample of RL + non-RL objects, all but two888An AGN not covered by FIRST and a source for which the FIRST UL does not allow to obtain a radio classification. out of the sources for which we found are non-RL; as anticipated, however, the underestimate of the X-ray luminosity implied by our general assumption of unabsorbed power-law emission is lower than a factor of , not enough to affect the apparent trend observed in Figure 6.
Finally, we explored the nature of the most extreme sources, with higher and/or . Extremely beamed objects, in particular objects with featureless optical spectra, are mostly excluded from our sample by the optical selection criteria. However, in this range of radioloudness and/or accretion efficiency the contamination of Flat Spectrum Radio Quasars (FSRQs; blazars with the optical spectrum not totally swamped by the jet and showing broad lines produced in the BLR) can be important, implying a strong contribution of the jet mainly in the X-ray band. Moreover, the overestimate of the X-ray emission would be amplified (due to the luminosity-dependent X-ray bolometric correction adopted) in calculating . From the literature, among the sources with , we found blazars, FR II, and lensed QSO (lensing effects can make difficult to correctly estimate intrinsic luminosities); no information was found for the remaining objects. The out of (all but QSOs) radio-detected sources with , for which we found some information in the literature, are indeed classified as blazars or FR IIs. In the following discussion, we will exclude these extreme sources, i.e. those with extreme and/or .
The exclusion of the extreme sources reduces the probability of a correlation between and (from a generalized Kendall rank correlation test: , %; from a Spearman rank correlation test: , , %), suggesting an important effect of the most strongly jetted sources in drawing the apparent trend observed in Figure 6.
4.2 SED shape and luminosity-dependence
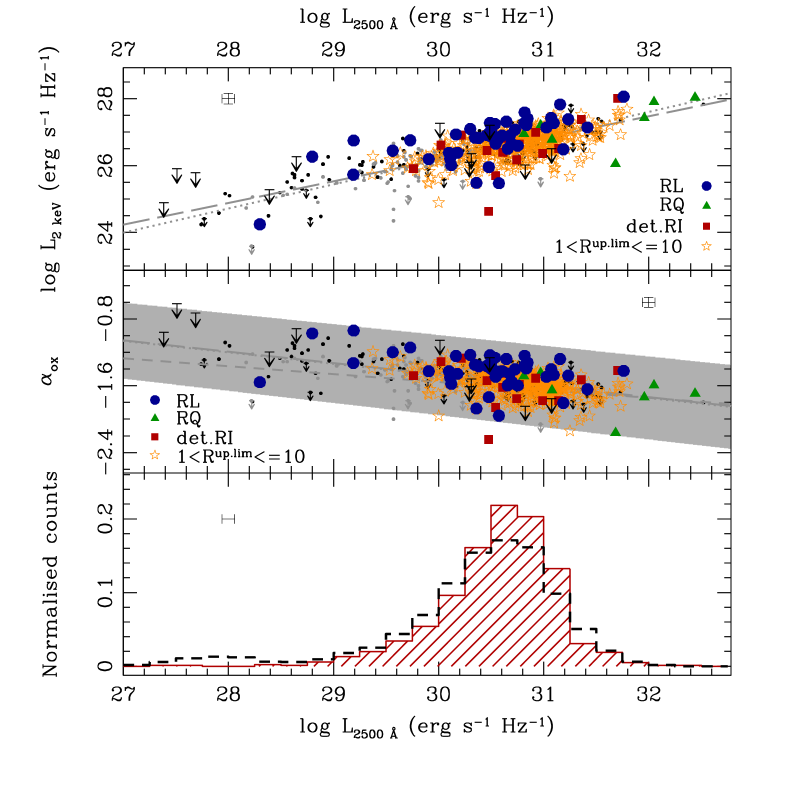
In the last years, several works have been published exploring the relation between the emission at different energies in AGN, as a possible indication of the mechanisms in action in samples spanning different ranges in their observational properties. In particular, many authors have investigated the relation between restframe UV and soft X-ray AGN emission, and its dependence with redshift and/or optical luminosity; note that RL sources are removed from the samples studied in most of these works. Most studies have concluded that there is no evidence for a redshift dependence, while the X-ray emission (i.e., the fraction of power in the accretion disk corona) is correlated with the UV emission, and the ratio of the monochromatic X-ray to UV luminosities, , decreases as the UV emission increases (Vignali et al. 2003; Strateva et al. 2005; Steffen et al. 2006; Just et al. 2007; Gibson et al. 2008). Our sources nicely fall along the mentioned correlations, as shown in Figure 8, with a scatter consistent with the spread in their best fits. Nevertheless, RL in general show an higher than expected, while detected RI lie around the regression line. Since the luminosity dependence in the Marconi et al. (2004) X-ray bolometric correction is implemented via the luminosity dependence of the spectral index, this result can affect our estimate of the values. However, the good agreement among the X-ray-based and the optical/UV-based estimates of (see Figure 3 and the discussion at the end of Sect. 3.2) suggests that the effect in our calculation is not significant.
The different weight of the X-ray emission with respect to the UV one, again, suggest a different spectral shape for sources with important radio emission. Although a contribution to the high-energy luminosity due to the jet (at least, higher than to the optical one), cannot be completely ruled out, the exclusion of the most extreme, jetted sources from the comparison shown in Figure 8 weakens this hypothesis. Note that the UV continuum is often found to be redder in RL than in RQ (e.g., Ivezić et al. 2002; Labita et al. 2008). In such a scenario, a larger in RL objects can be obtained by assuming a reduced UV continuum emission.
Looking at Figure 8, it is quite evident that out of the X-ray non-detected sources in the “control sample” (large upper limits in the upper and central panels) have significantly lower than the luminosity observed for the sources in the “main sample”. Since a significant difference between both samples in the UV luminosity would affect our analysis, we checked that these low luminosities are not representative of the values for the whole “control sample”. A comparison between the distributions in of the two samples (see Figure 8, lower panel) demonstrates that the two samples cover similar ranges in UV luminosity, both peaking at , with the distribution of the “control sample” extending down to lower luminosities, where about half of the X-ray non-detected sources can be found.
Comparing the radio-loudness with respect to different energy ranges (e.g., optical, UV, X-ray) can provide hints on the relations between the emission in the different bands, and/or their evolution with redshift or luminosity. In the following, we consider the radio loudness parameter with respect to the hard X-ray luminosity (Terashima & Wilson 2003):
| (4) |
The values of (or their upper limits, for radio-undetected sources) are reported in Table 5; in the second part, we report the lower limits to radio-to-X-ray ratio for the AGN in the “control sample” for which we have X-ray upper limits.
The distribution of for detected sources suggests the possible presence of a gap at . However, whether it is real or not depends again on the distribution of undetected sources. All the RL sources (i.e., sources with ) have ; the distinction between RL and RI tends to disappear, having out of detected RI higher than this threshold (see Fig. 9).
The dependence of these boundaries with the luminosity is still an open issue. For a sample of local Seyfert galaxies and low-luminosity radio galaxies, Panessa et al. (2007) found for RL/non-RL separating values of and , while the addition of luminous PG quasars implies a , fixing to define RL sources (Terashima & Wilson 2003).
Note that the radio-to-optical loudness was calculated by Terashima & Wilson (2003) and Panessa et al. (2007) using the optical luminosity at Å instead of the UV luminosity at Å. Therefore, to properly compare the our “main sample” and the low-luminosity sample by Panessa et al. (2007), we have to evaluate the same parameter, . Again, to estimate the optical luminosity at such wavelength, we adopted the QSO template, normalized to the continuum flux under the nearest feature to this wavelength, in this case the line, as reported in the SDSS catalogue. This means that a comparison can be performed only for the sources showing this line in their SDSS spectra. As before, for the radio nondetected sources we calculated an upper limit to the optical radio-loudness parameter from the flux limit of the FIRST survey. We note that our approach could possibly overestimate the Å flux by including host galaxy emission, that can contributes to the optical band, in a particularly significant way for AGN with lower optical luminosity. In these sources, the resulting values come out smaller than the real one.
The results are reported in Table 5; the second part of the Table contains the same quantities for the X-ray-undetected sources in the “control sample”. The versus is shown in Figure 10 (left panel); in the same plot we report also the Panessa et al. (2007) sample. Clearly, our sample falls below both correlations found by Terashima & Wilson (2003) and Panessa et al. (2007); this is observed apart from the classification in terms of , although the effect is more evident for sources with lower .
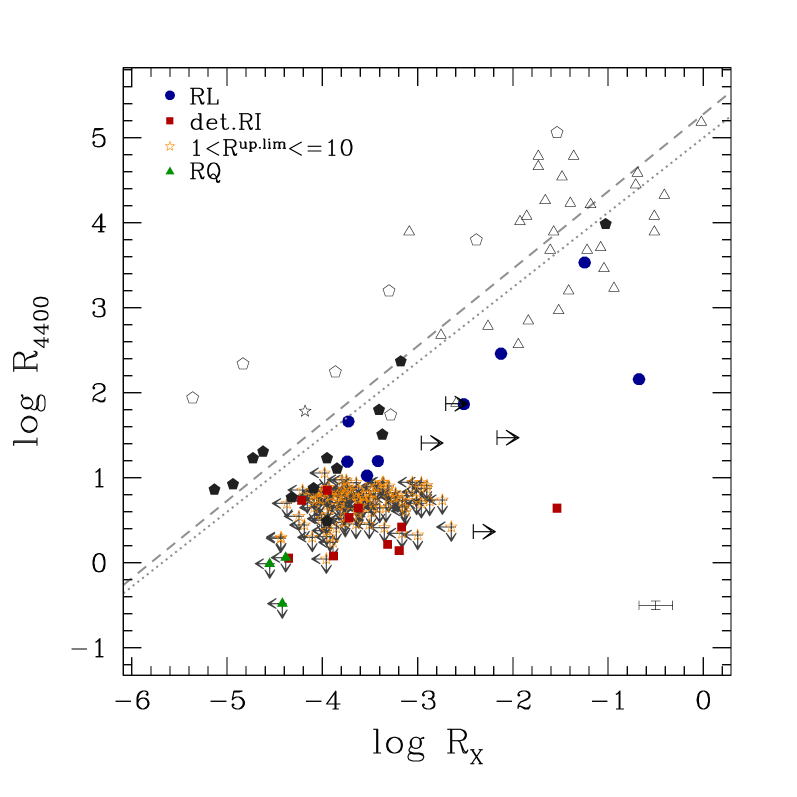

The main result we can draw is that the increase in the emission in the X-ray and radio bands seems to proceed in a linked way: higher X-ray luminosity corresponds to higher radio luminosity, so that the range spanned in is roughly the same. On the contrary, the optical luminosity changes independently, producing the observed decrease in . We note that the large fraction of radio upper limits in our sample can partially affect all the considerations we are doing: detections instead of upper limits could in principle change the overall distribution of our sample in the different distribution diagrams.
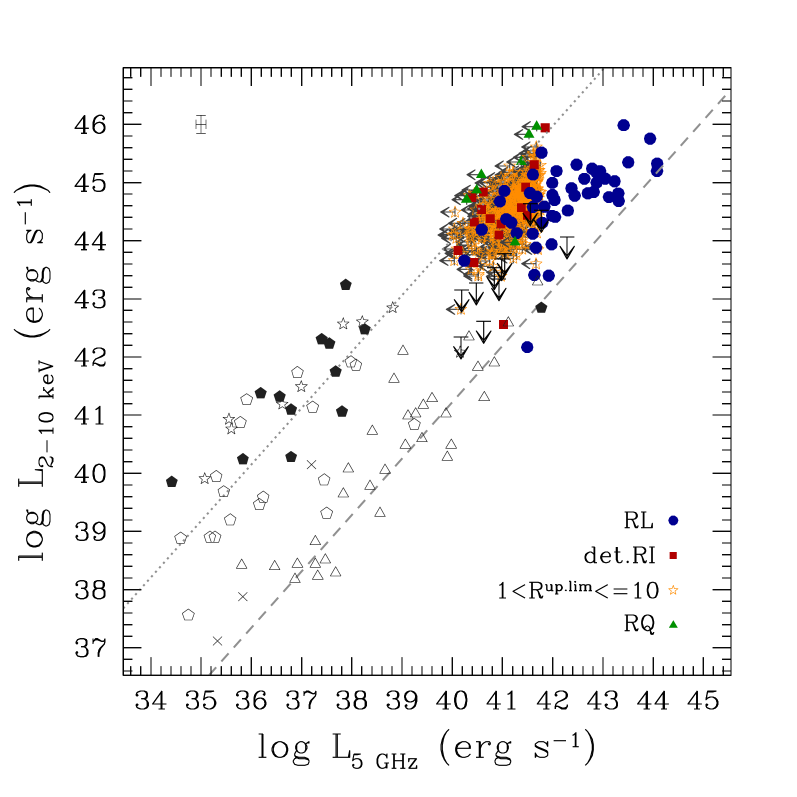
A possibility is that the former connection is just apparent, mainly due to a strong contamination of the X-ray observed emission due to the jet, i.e. the same physical component where the radio emission is produced. However, in the previous sections we excluded the presence of a significant contribution of X-rays from the jet. Moreover a direct comparison between the keV luminosity and the radio luminosity at cm demonstrates that this is not the case (see Fig. 10, central panel). As expected, we are sampling a range of higher luminosities both at short and long wavelengths. At lower and intermediate radio luminosities our sample falls along the best-fit line found by Panessa et al. (2007) for their Seyferts (dotted line). More interestingly, an effect of “saturation” seems to take place, with the sources at higher luminosities (mainly RL) shifting towards the locus of low-luminosity radio galaxies. This result reinforces our former conclusion that the X-ray luminosity is not jet-dominated, even in RL sources, confirming in addition our X-ray–based estimation of nuclear properties. Therefore, we are left with the only conclusion that we are looking at a real different relation between the jet and (on one side) the regions where X-rays are emitted and (on the other side) the regions where optical radiation is produced. While the presence of jet changes the structure of the BH-accretion disk-corona systems so that the X-ray emission is strongly affected, the effects on the observed optical emission is lower, since the contribution from the most external region of the disk basically is likely untouched. Quite interestingly, Cleary et al. (2007), investigating the MIR properties in a sample of extremely powerful radio sources with Spitzer, found an “upper envelope” in the observed luminosity for the most powerful RL AGN. In their analysis the authors suggest that, if observed at higher radio lobe luminosities than those of their sample, this may provide support for the “receding torus” model (Lawrence 1991). Assuming a MIR-to-X-ray ratio of (from the global SEDs of Richards et al. 2006), our observed saturation limit matches approximately their limit of W Hz-1 sr-1.
The accretion regime in action in our sample is clearly different from that characterizing the Panessa et al. (2007) sample of Seyfert galaxies. The ratio between X-ray and Eddington luminosities is higher (see Fig. 10, right panel), while the importance of the radio emission with respect to the X-ray emission is comparable (see Fig. 10, left panel): although our sample spans a small range in Eddington ratios, looking at the radio-detected AGN (i.e., the blue filled circles, RL, and the red filled squares, detected RI, in Fig. 10) it seems that we are drawing a parallel track in the - plane, moving at higher accretion. Again, the true distribution of the undetected sources (upper limits in both quantities, clustered at and ) may affect our conclusions. This important difference is confirmed when considering the so-called “fundamental plane of black hole activity” (Merloni et al. 2003, see Fig. 10, right panel): the majority of our AGN fall at accretion ratios higher than the threshold of , where the switch between radiatively inefficient (ADAF) and radiatively efficient accretion flow is expected to occur. At these accretion regimes, the relation between accretion flow and jet power changes, as demonstrated by the deviation of our sample from the fundamental-plane equation (dotted line).
To summarize, we extend the analysis of the correlation between emission in different bands to higher luminosities for a wider sample of efficiently-accreting objects. The observed trend with the luminosity of the radio, optical, and X-ray emission and their correlations lead us to suggest that the radio emission is strongly coupled with a non-jet-dominated X-ray radiation, produced in the innermost region of the SMBH-accretion disk system, instead of with the optical one, which originates in a superposition of emission from material at different distances from the nucleus.
5 Conclusions
In this paper, we explored the interplay between X-ray and radio emission in type 1 AGN, in order to investigate the origin of radio emission in the framework of the AGN Unification Model, and its relation with the different physical components of the central system as well as with the different accretion regimes in act. The availability of deep catalogues at different energies, from radio up to X-rays bands, with wide sky coverage, allow us to collect multiwavelength information for a large sample of type 1 AGN, spanning a redshift range from to .
For all the sources, we obtained the masses of the central black hole from the optical spectra, using the well-known relation between mass, emission-line width, and continuum luminosity. X-ray data were used to compute the bolometric output of the sources; being produced in the innermost regions of the central engine, the high-energy emission is one of the best proxies to estimate the bolometric luminosity, less affected by effects of reprocessing and external contamination than radiation emitted at larger distances. We tested our X-ray-based estimate of nuclear properties against the possible absorption in the X-ray band, finding that its effects would be negligible. In the previous sections, we discussed extensively the importance of the only contaminant we expect at high energy, i.e. the emission from the jet in the most powerful radio sources.
Combining SMBH masses and bolometric luminosities, we recovered the Eddington ratios; the collection of radio information allow us to characterize the sample in terms of importance of the radio emission in the global energetic output. We note that one of the main characteristics of this work is the derivation of the different physical quantities from observations in different energy ranges, compared with the unavoidable dependence expected when observations in the same energy band are used (e.g., the optical emission adopted both in the determination of the SMBH mass and as a proxy of the bolometric luminosity).
To assess whether these conclusions are a property related to the X-ray selection character of our sample, we tested our conclusions against a sample of FIRST radio AGN which appear in the SDSS catalogue, and for which X-ray information is obtained from the ROSAT All-Sky Survey (RASS; Voges et al. 1999).
Below we summarize our main results:
-
1.
Our sources have typically . The sample analysed, which is effectively X-ray selected, might be biased towards high accretion rates. It is not surprising then that the trend of increasing towards decreasing noted in local samples is absent in our study, as we do not expect ADAFs or other radio-prone low-efficiency accretion modes to be present. We also find a few extreme cases (both in terms of and ), that we identify with beamed sources.
-
2.
At a variance with lower-luminosity samples, ours does not show any hint of bimodality in radio-loudness. Despite the fact that our sample spans a wide redshift range, we have not found compelling evidence that bimodality develops with cosmic time. Although this cannot be excluded, we rather believe that the absence of a gap between RL and RQ is mainly due to the size of our sample, highly increased with respect to previous works. Our analysis suggests that, if the RL/RQ bimodality exist, it is a local effect.
-
3.
We have computed X-ray loudness for RL and RQ AGN (excluding strongly jetted sources) and we conclude that in the bulk of the AGN population, radio emission is tightly linked to the accretion disk and not to larger scale phenomena.
Acknowledgements.
Based on observations obtained with XMM-Newton (an ESA science mission with instruments and contributions directly funded by ESA Member States and the USA, NASA). Funding for the SDSS and SDSS-II has been provided by the Alfred P. Sloan Foundation, the Participating Institutions, the National Science Foundation, the U.S. Department of Energy, the National Aeronautics and Space Administration, the Japanese Monbukagakusho, the Max Planck Society, and the Higher Education Funding Council for England. The SDSS Web Site is http://www.sdss.org/. The SDSS is managed by the Astrophysical Research Consortium for the Participating Institutions. This research has made use of NASA’s Astrophysics Data System. The research uses the interactive graphical viewer and editor for tabular data TOPCAT (http://www.starlink.ac.uk/topcat/) and its command-line counterpart STILTS (http://www.starlink.ac.uk/stilts/). We warmly thank the referee for her/his suggestions that significantly improved the paper. LB acknowledges support from the Spanish Ministry of Science and Innovation through a “Juan de la Cierva” fellowship. Financial support for this work was provided by the Spanish Ministry of Economy and Competitiveness through research grant AYA2010-21490-C02-01 FJHH acknowledges support from CSIC through the undergraduate research programme “JAE-Introducción a la investigación”.References
- Abazajian et al. (2009) Abazajian, K. N., Adelman-McCarthy, J. K., Agüeros, M. A., et al. 2009, ApJS, 182, 543
- Becker et al. (1995) Becker, R. H., White, R. L., & Helfand, D. J. 1995, ApJ, 450, 559
- Begelman (2002) Begelman, M. C. 2002, ApJ, 568, L97
- Berti & Volonteri (2008) Berti, E. & Volonteri, M. 2008, ApJ, 684, 822
- Blandford (1990) Blandford, R. D. 1990, in Active Galactic Nuclei, ed. R. D. Blandford, H. Netzer, L. Woltjer, T. J.-L. Courvoisier, & M. Mayor, 161–275
- Brinkmann et al. (2000) Brinkmann, W., Laurent-Muehleisen, S. A., Voges, W., et al. 2000, A&A, 356, 445
- Cleary et al. (2007) Cleary, K., Lawrence, C. R., Marshall, J. A., Hao, L., & Meier, D. 2007, ApJ, 660, 117
- Collin et al. (2002) Collin, S., Boisson, C., Mouchet, M., et al. 2002, A&A, 388, 771
- Collin & Kawaguchi (2004) Collin, S. & Kawaguchi, T. 2004, A&A, 426, 797
- Eddington (1913) Eddington, A. S. 1913, MNRAS, 73, 359
- Elvis et al. (1994) Elvis, M., Wilkes, B. J., McDowell, J. C., et al. 1994, ApJS, 95, 1
- Feigelson & Nelson (1985) Feigelson, E. D. & Nelson, P. I. 1985, ApJ, 293, 192
- Francis et al. (1991) Francis, P. J., Hewett, P. C., Foltz, C. B., et al. 1991, ApJ, 373, 465
- Garofalo et al. (2010) Garofalo, D., Evans, D. A., & Sambruna, R. M. 2010, MNRAS, 406, 975
- Gibson et al. (2008) Gibson, R. R., Brandt, W. N., & Schneider, D. P. 2008, ApJ, 685, 773
- Ho (2002) Ho, L. C. 2002, ApJ, 564, 120
- Hopkins et al. (2007) Hopkins, P. F., Richards, G. T., & Hernquist, L. 2007, ApJ, 654, 731
- Isobe et al. (1986) Isobe, T., Feigelson, E. D., & Nelson, P. I. 1986, ApJ, 306, 490
- Ivezić et al. (2002) Ivezić, Ž., Menou, K., Knapp, G. R., et al. 2002, AJ, 124, 2364
- Jiang et al. (2007) Jiang, L., Fan, X., Ivezić, Ž., et al. 2007, ApJ, 656, 680
- Just et al. (2007) Just, D. W., Brandt, W. N., Shemmer, O., et al. 2007, ApJ, 665, 1004
- Kalberla et al. (2005) Kalberla, P. M. W., Burton, W. B., Hartmann, D., et al. 2005, A&A, 440, 775
- Kaspi et al. (2005) Kaspi, S., Maoz, D., Netzer, H., et al. 2005, ApJ, 629, 61
- Kaspi et al. (2000) Kaspi, S., Smith, P. S., Netzer, H., et al. 2000, ApJ, 533, 631
- Kellermann et al. (1989) Kellermann, K. I., Sramek, R., Schmidt, M., Shaffer, D. B., & Green, R. 1989, AJ, 98, 1195
- Labita et al. (2008) Labita, M., Treves, A., & Falomo, R. 2008, MNRAS, 383, 1513
- Lawrence (1991) Lawrence, A. 1991, MNRAS, 252, 586
- Marchese et al. (2012) Marchese, E., Della Ceca, R., Caccianiga, A., et al. 2012, A&A, 539, A48
- Marconi et al. (2004) Marconi, A., Risaliti, G., Gilli, R., et al. 2004, MNRAS, 351, 169
- Marshall et al. (2005) Marshall, H. L., Schwartz, D. A., Lovell, J. E. J., et al. 2005, ApJS, 156, 13
- Merloni et al. (2003) Merloni, A., Heinz, S., & di Matteo, T. 2003, MNRAS, 345, 1057
- Miller et al. (2011) Miller, B. P., Brandt, W. N., Schneider, D. P., et al. 2011, ApJ, 726, 20
- Nagar et al. (2005) Nagar, N. M., Falcke, H., & Wilson, A. S. 2005, A&A, 435, 521
- Osterbrock (1989) Osterbrock, D. E. 1989, Astrophysics of gaseous nebulae and active galactic nuclei, ed. Osterbrock, D. E.
- Panessa et al. (2007) Panessa, F., Barcons, X., Bassani, L., et al. 2007, A&A, 467, 519
- Panessa et al. (2006) Panessa, F., Bassani, L., Cappi, M., et al. 2006, A&A, 455, 173
- Pineau et al. (2011) Pineau, F., Motch, C., Carrera, F., et al. 2011, A&A, 527, A126+
- Rees (1984) Rees, M. J. 1984, ARA&A, 22, 471
- Richards et al. (2006) Richards, G. T., Lacy, M., Storrie-Lombardi, L. J., et al. 2006, ApJS, 166, 470
- Schneider et al. (2010) Schneider, D. P., Richards, G. T., Hall, P. B., et al. 2010, AJ, 139, 2360
- Shen et al. (2011) Shen, Y., Richards, G. T., Strauss, M. A., et al. 2011, ApJS, 194, 45
- Sikora et al. (2007) Sikora, M., Stawarz, Ł., & Lasota, J. 2007, ApJ, 658, 815
- Spergel et al. (2007) Spergel, D. N., Bean, R., Doré, O., et al. 2007, ApJS, 170, 377
- Spergel et al. (2003) Spergel, D. N., Verde, L., Peiris, H. V., et al. 2003, ApJS, 148, 175
- Steffen et al. (2006) Steffen, A. T., Strateva, I., Brandt, W. N., et al. 2006, AJ, 131, 2826
- Stocke et al. (1992) Stocke, J. T., Morris, S. L., Weymann, R. J., & Foltz, C. B. 1992, ApJ, 396, 487
- Strateva et al. (2005) Strateva, I. V., Brandt, W. N., Schneider, D. P., Vanden Berk, D. G., & Vignali, C. 2005, AJ, 130, 387
- Terashima & Wilson (2003) Terashima, Y. & Wilson, A. S. 2003, ApJ, 583, 145
- Vasudevan & Fabian (2007) Vasudevan, R. V. & Fabian, A. C. 2007, MNRAS, 381, 1235
- Vestergaard et al. (2008) Vestergaard, M., Fan, X., Tremonti, C. A., Osmer, P. S., & Richards, G. T. 2008, ApJ, 674, L1
- Vestergaard & Osmer (2009) Vestergaard, M. & Osmer, P. S. 2009, ApJ, 699, 800
- Vestergaard & Peterson (2006) Vestergaard, M. & Peterson, B. M. 2006, ApJ, 641, 689
- Vignali et al. (2003) Vignali, C., Brandt, W. N., Schneider, D. P., et al. 2003, AJ, 125, 2876
- Voges et al. (1999) Voges, W., Aschenbach, B., Boller, T., et al. 1999, A&A, 349, 389
- Watson et al. (2009) Watson, M. G., Schröder, A. C., Fyfe, D., et al. 2009, A&A, 493, 339
- White et al. (2000) White, R. L., Becker, R. H., Gregg, M. D., et al. 2000, ApJS, 126, 133
- Wilson & Colbert (1995) Wilson, A. S. & Colbert, E. J. M. 1995, ApJ, 438, 62
| 2XMMi | SDSS | ||||||||||||
|---|---|---|---|---|---|---|---|---|---|---|---|---|---|
| SRCID | R.A. | Dec. | Redshift | specObjID | R.A. | Dec. | @Å rf | FINT@GHz obs | |||||
| (1) | (2) | (3) | (4) | (5) | (6) | (7) | (8) | (9) | (10) | (11) | (12) | (13) | (14) |
| X-ray detected AGN | |||||||||||||
| undet. | |||||||||||||
| OutFIRST | |||||||||||||
| undet. | |||||||||||||
| [] | |||||||||||||
| X-ray undetected AGN | |||||||||||||
| Xund | |||||||||||||
| Xund | |||||||||||||
| Xund | |||||||||||||
| Xund | |||||||||||||
| [] | |||||||||||||
Col. (1) : Unique source identification number in the 2XMMi catalogue; for the X-ray undetected sources, arbitrary ID number. Col. (2) & (3): J2000 right ascension and declination of the X-ray object (in degree). Col. (4): XMM-Newton EPIC-pn flux between and keV (entry xmm_pn_8_flux in the 2XMMi catalogue), in units of ; for the X-ray undetected sources, XMM-Newton EPIC upper limit to the flux from FLIX. Col. (5): Redshift for the SDSS counterpart. Col. (6): Unique spectroscopic ID in the SDSS catalogue. Col. (7) & (8): J2000 right ascension and declination of the optical object (in degree). Col. (9) - (11): Magnitudes in the , , and SDSS filters. Col. (12): Standard deviation of the Gaussian fitted to the Mg ii line (in Å). Col. (13): Continuum value below the Mg ii line (in units of ). Col. (14): Integrated radio flux density at GHz (observed frame; in units of mJy), from the FIRST survey; OutFIRST: source not covered by FIRST; undet.: source covered but not detected by FIRST.
| SRCID | Redshift | FWHM(Mg ii) | @Å rf | |||||||
|---|---|---|---|---|---|---|---|---|---|---|
| (1) | (2) | (3) | (4) | (5) | (6) | (7) | (8) | (9) | (10) | (11) |
| X-ray detected AGN | ||||||||||
| [] | ||||||||||
| [] | ||||||||||
| X-ray undetected AGN | ||||||||||
| Xund | ||||||||||
| Xund | ||||||||||
| Xund | ||||||||||
| Xund | ||||||||||
| [] | ||||||||||
Col. (1): Unique source identification number in the 2XMMi catalogue; for the X-ray undetected sources, arbitrary ID number (as in Table 3). Col. (2): Redshift for the SDSS counterpart (as in Table 3). Col. (3): Galactic column density, from Kalberla et al. (2005); in units of . Col. (4): FWHM of the Mg ii emission line, in units of km s-1; for sources marked with , from the SDSS DR7 catalogue, otherwise from Shen et al. (2011). Col. (5): Monochromatic continuum luminosity at Å rest frame, in units of ; for sources marked with recovered as described in Sect. 3, otherwise from Shen et al. (2011). Col. (6): Mass of the central BH, in units of ; for sources marked with , computed from eq. (1); otherwise from Shen et al. (2011). Col. (7): Hard X-ray luminosity, recovered as described in Sect. 3; in units of (upper limit for sources undetected in the X-ray). Col. (8): Ratio between the hard X-ray luminosity and the Eddington luminosity, / [] (upper limit for sources undetected in the X-ray). Col. (9): Luminosity-dependent X-ray bolometric correction, from equation (3.2), (Marconi et al. 2004); upper limit for sources undetected in the X-ray. Col. (10): Bolometric luminosity, recovered as described in Sect. 3; in units of (upper limit for sources undetected in the X-ray). Col. (11): Eddington ratio, defined as (upper limit for sources undetected in the X-ray).
| SRCID | @Å | @Å | @GHz | @GHz | Class. | |||||||
|---|---|---|---|---|---|---|---|---|---|---|---|---|
| (1) | (2) | (3) | (4) | (5) | (6) | (7) | (8) | (9) | (10) | (11) | (12) | (13) |
| X-ray detected AGN | ||||||||||||
| undet. | undet. | NC | undet. | undet. | ||||||||
| RL | ||||||||||||
| OutFIRST | OutFIRST | OutFIRST | OutFIRST | OutFIRST | OutFIRST | OutFIRST | OutFIRST | |||||
| undet. | undet. | NC | undet. | undet. | ||||||||
| [] | ||||||||||||
| X-ray undetected AGN | ||||||||||||
| Xund | RL | |||||||||||
| Xund | RL | |||||||||||
| Xund | dRI | |||||||||||
| Xund | RL | |||||||||||
| [] | ||||||||||||
Col. (1): Unique source identification number in the 2XMMi catalogue; for the X-ray undetected sources, arbitrary ID number (as in Table 3). Col. (2): Monochromatic optical continuum flux at Å, recovered as described in Sectt. 3 and 4 (in units of mJy). Col. (3): X-ray–to–optical spectral index, ; upper limit for sources undetected in the X-ray. Col. (4): Monochromatic optical continuum flux at Å, recovered as described in Sectt. 3 and 4.2 (in units of mJy); “-”: source without line in their spectra. Col. (5): Monochromatic radio flux at GHz (rest frame; in units of mJy), recovered from the integrated flux density at GHz assuming a power-law spectrum with index , as described in Sect. 4; OutFIRST: source not covered by FIRST; undet.: source not detected by FIRST. Col. (6): For sources covered but not detected by FIRST, monochromatic radio flux limit at GHz (rest frame; in units of mJy), calculated from the flux limit at GHz of the FIRST survey, mJy, assuming the same spectral shape ( with index ). Col. (7): Radio-UV radioloudness parameter, defined as the ratio between the radio flux at GHz and the optical flux at Å, both rest frame; OutFIRST: source not covered by FIRST; undet.: source not detected by FIRST. Col. (8): For sources covered but not detected by FIRST, limit to the radio-UV radioloudness parameter, calculated from the limit to the radio flux at GHz and the optical flux at Å, both rest frame. Col. (9): Radio classification: RL = radioloud; dRI = detected radiointermediate; ndRI = nondetected with ; RQ = radioquiet; NC = nonclassified; “-” = source not covered by FIRST. Col. (10): Radio-optical radioloudness parameter, defined as the ratio between the radio flux at GHz and the optical flux at Å, both rest frame; OutFIRST: source not covered by FIRST; undet.: source with line in its spectrum but not detected by FIRST; “-”: source (detected or not detected by FIRST) without line in its spectrum. Col. (11): For sources covered but not detected by FIRST, limit to the radio-optical radioloudness parameter, calculated from the limit to the radio flux at GHz and the optical flux at Å, both rest frame; “-”: source without line in its spectrum. Col. (12): Radio-X-ray radioloudness parameter, defined as the ratio between the radio luminosity at GHz and the X-ray luminosity in the keV energy range; OutFIRST: source not covered by FIRST; undet.: source not detected by FIRST. Col. (13): For sources covered but not detected by FIRST, limit to the radio-X-ray radioloudness parameter, calculated from the limit to the radio luminosity at GHz and the X-ray luminosity in the keV energy range. Note that for the X-ray detected AGN not detected by FIRST (first part), it is an upper limit, while for sources in the second part, radio-detected and X-ray undetected, it is a lower limit.