11
A. Schwope 11institutetext: Leibniz-Institute für Astrophysik Potsdam (AIP), An der Sternwarte 16, 14482 Potsdam, Germany 11email: aschwope@aip.de
CV surveys with eROSITA
Abstract
eROSITA will perform the most sensitive X-ray all-sky ever in the energy range keV. It will likely uncover several compact binaries, most of them will be cataclysmic variable stars. After a brief introduction to eROSITA we will discuss the source content of the eROSITA surveys, the expected number of CVs and possible strategies for the optical follow-up.
keywords:
Stars: cataclysmic variables – Stars: X-rays – surveys1 Introduction
eROSITA (extended ROentgen Survey with an Imaging Telescope Array) is an X-ray telescope array built by a German consortium, to be mounted on a Fregat booster and launched with a Russian Zenit rocket into an L2 halo orbit of the Sun-Earth system in late 2013 (Predehl et al. 2011; Pavlinsky et al. 2009). During the first four years of its mission, the eROSITA telescopes will scan the sky in great circles with a scanning speed corresponding to one full circle being completed every four hours. The scanning axis is either pointed directly towards the sun or a few degrees away from it. As the satellite moves around the sun, the plane of the scans is thus advanced by about one degree per day, resulting in a full coverage of the sky every half year.
Hence eROSITA will perform eight independent all-sky surveys in the energy range keV each lasting half a year. After four years the sky area around the poles of the ecliptic will be exposed for about 20 ks, the average exposure per survey is 240 s (eRASS:1) and for the full four year survey about 2000 s (eRASS:8). The average sensitivity for the detection of point sources in eRASS:8 will be erg cm-2 s-1 and erg cm-2 s-1 in the soft ( keV) and hard ( keV) energy bands, respectively. Around the poles of the ecliptic the limiting fluxes will be erg cm-2 s-1 (soft) and erg cm-2 s-1(hard).
The X-ray optics will have an on-axis angular resolution of 15\arcsec (HEW, half energy width), due to off-axis blurring the average survey resolution will be lower and is expected to be below 30 arc sec. Individual source positions will have a remaining positional inaccuracy of estimated arc sec.
Each of the seven mirror modules has its own camera in its focus, each equipped with a CCD-module and a processing electronics. The eROSITA-CCDs have pixels which correspond to an image area of 28.8 mm 28.8 mm, respectively, for a field of view of 1.03\degr diameter. The 384 channels are read out in parallel and the nominal integration time per CCD frame will be 50 ms.
Given the technical specifications, eROSITA can be very much compared to XMM-Newton with EPIC pn, it has however a factor 5 times larger grasp between 0.3 and 2 keV (effective area times FoV), making it a prime survey instrument. During its four-year all-sky survey it shall discover about clusters of galaxies to study the growth of structure and constrain the parameters of Dark Energy as the prime mission goal. Based on the known number-flux relations of AGN (e.g. Gilli et al. 2005)) one may expect the detection of about AGN of all kind up to redshift 6. The eROSITA X-ray sky will also be populated by about 300,000 coronal emitters. The huge stellar samples built from the large number of detections will help to disentangle the X-ray emitting populations and determine the shape of age-metalicity-activity relations.
Finally, compact galactic (and extragalactic) objects will be detected in large number and in the following sections the expectations are outlined.
2 CV forecast for eROSITA
The current version of the Catalogue of Cataclysmic Variables, Low-Mass X-ray Binaries and related objects (RKCat Edition 7.16 Ritter & Kolb 2003)) has entries for 926 CVs. Despite this comparatively large number, flux-limited samples that could be used to derive the space density of the CV population are comparatively small. The most comprehensive X-ray selected complete sample was collected as part of the ROSAT Bright Survey (RBS), an optical identification program of the more than 2000 brightest X-ray sources at high-galactic latitude (Schwope et al. 2000, 2002) und comprised 16 non-magnetic CVs, among them 5 new discoveries. The RBS sample of non-magnetic CVs was analyzed jointly with the CV sample from the ROSAT North Ecliptic Pole survey (Gioia et al. 2003) by Pretorius et al. (2007) and more recently by Pretorius & Knigge (2011). The NEP sample is small, it comprises just 4 objects. The NEP reached a flux limit comparable to eRASS:8 over a sky area of only 81 square degrees; the RBS on the other hand reached erg cm-2 s-1 over 20000 square degrees.
The joint analysis of NEP and RBS non-magnetic CVs revealed a luminosity function in the range erg s-1. Integration of the observed luminosity function gave a mid-plane space density of pc-3. The error in this quantity is of order a factor 2. Perhaps the biggest source of uncertainty therein is the often badly constrained distance to individual CVs. Because the number of CVs in those X-ray flux-limited samples was very small the galactic scale height could not be measured.
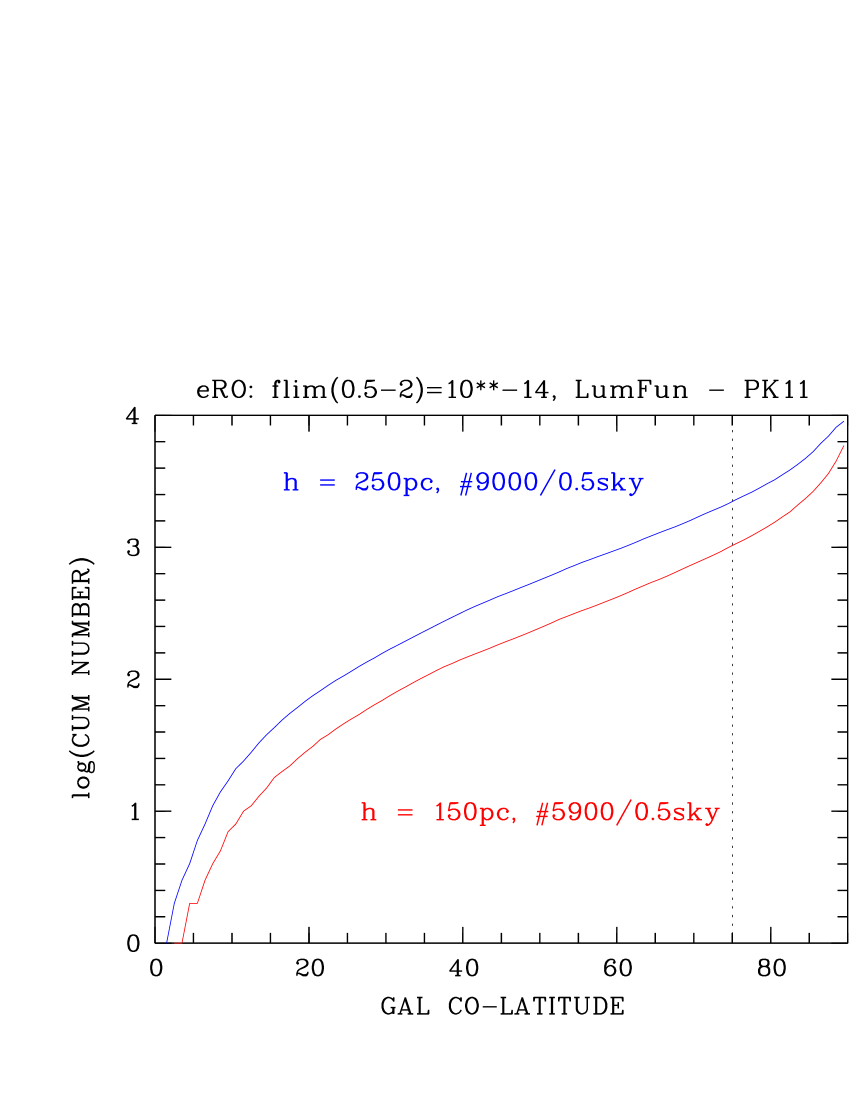
At a flux limit of about erg cm-2 s-1 ( keV, eRASS:8) one potentially might discover all CVs brighter than erg s-1 within 300, 900, 3000, and 9000 pc, respectively. The corresponding volumes are sufficiently large to determine the scale height of the distribution with high fidelity. In order to estimate the expected number of CVs in the eRASS, we adopted the parameterized version of the luminosity function of Pretorius & Knigge (2011), a truncated power law with index , and integrated the luminosity function between erg s-1 and erg s-1.
The results are shown in Fig. 1 for two adopted values of the galactic scale height, 150 pc and 250 pc, approximating a mildly young (CVs above the period gap) and a mildly old (CVs below the period gap) population. The figure shows cumulative numbers as a function of galactic co-latitude. Hence, one may expect about 6000 and 9000 CVs for the two assumed values of the scale height in half the sky (a German-Russian agreement gives exclusive data rights for two hemispheres, respectively, with a dividing line along a meridian through the galactic poles and the galactic center). However, strong absorption in the plane will make CV studies un-feasible at low latitudes. The expected cumulative numbers at latitude \degr are 1000 and 2100, respectively, hence sufficient to determine the local space density and the galactic scale height with high confidence, provided the new CVs can be identified as such among the many other sources.
The number of magnetic CVs, Polars and Intermediate Polars (IPs), that can be detected in the eROSITA all-sky survey is rather difficult to estimate. Polars are more abundant in the currently existing samples due to their frequently present soft X-ray component and the well-matching soft energy response of ROSAT which led to the discovery of numerous new Polars. After ROSAT the detection rate has slowed down, XMM-Newton made three additions to the class (XGPS-9 just being a candidate) (Vogel et al. 2008; Ramsay et al. 2009; Motch et al. 2010). MCVs on the other hand were discovered in the last decade serendipitously with RXTE, INTEGRAL and Swift (e.g. Bikmaev et al. 2006; Butters et al. 2007; Masetti et al. 2006). Here the IPs are clearly outstanding due to their comparatively high luminosity at hard X-ray energies. Their distances are notoriously uncertain. A very simplistic eROSITA IP forecast can be made by simply scaling the 12 IPs in the XTE all-sky slew survey (XSS, keV) with the ratio of the corresponding flux limits (the flux in the XSS band and in the hard eROSITA band are the same within a factor 1.5 for a typical thermal spectrum of keV) which reveals about 15000 IPs. This extrapolation from a more local sample assumes a constant space density and does not account for the scale height, hence it over-predicts the true number considerably. Nevertheless the current flux-limited samples of Polars and IPs will grow by orders of magnitude.
Of particular relevance will be the interplay between eROSITA-discovered CVs and the distances determined by Gaia which will resolve the distance related uncertainties in the luminosity functions of non-magnetic and magnetic CVs.
3 Source discrimination and optical follow-up
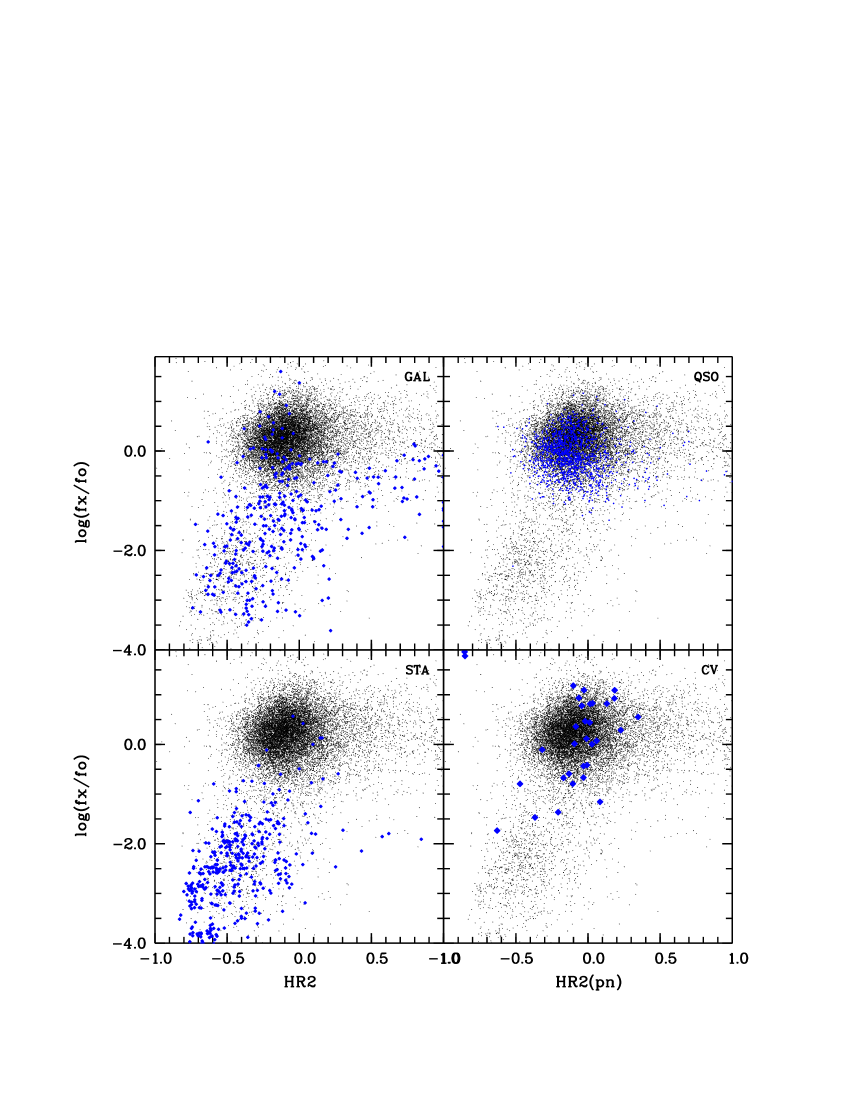
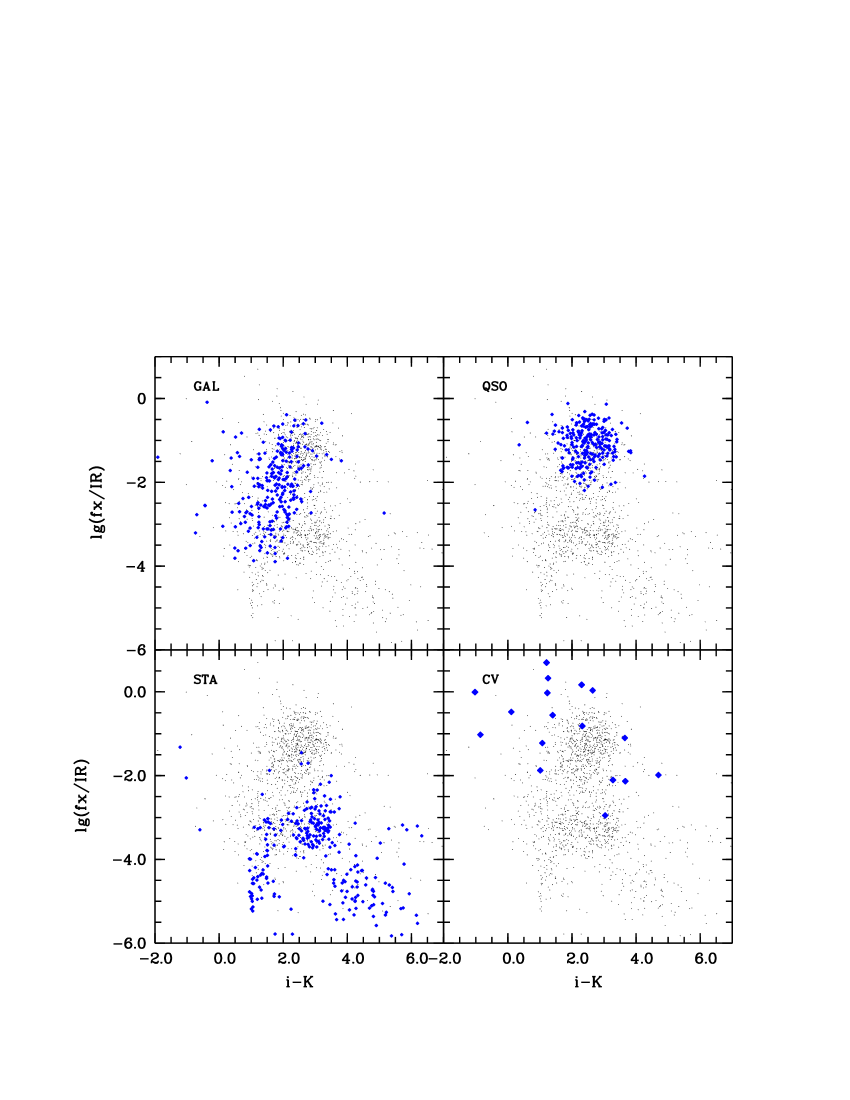
In Figs. 2 and 3 we show diagnostic diagrams involving X-ray, optical and infrared data of point-like X-ray sources detected serendipitously with XMM-Newton. They may serve as excellent templates and learning samples for the expected eROSITA discoveries. The X-ray sources were drawn from the 2XMMi-DR3 catalogue (Watson et al. 2009) and were correlated with sources found in SDSS-DR7 (Pineau et al. 2011) and with 2MASS. We are adopting the spectral classes as provided by the SDSS collaboration and do not further separate between different AGN types and different types of stars. CVs are not classified by the SDSS, we are using the correlation with RKCat by Pineau et al. (2011) and correlate the sample of almost 300 SDSS-CVs compiled by Szkody et al. (2011, and references therein) as well. The CV sample in Figs. 2 and 3 is still rather small and represents a mixture of magnetic and non-magnetic objects.
In Figs. 2 and 3 we are using the X-ray flux in the XID-band ( keV). The X-ray hardness ratio is defined as HR2 = (H)/(S+H) where S and H are the counts in the soft keV and the hard band keV, respectively. The X-ray to optical (infrared) flux ratio was computed as . The background of objects shown with small black dots is made by objects which have an associated counterpart in the SDSS photometric catalogue while big blue symbols indicate a spectroscopic counterpart.
The QSOs can be rather well located in both diagnostic diagrams. Objects classified as galaxies will be in most cases low-luminosity AGN with a considerable contribution from the host galaxy. Stars and Galaxies have a large overlapping region in Fig. 2, when infrared data are included they appear at mutually exclusive regions (Fig. 3). CVs finally represent the least constrained population and have overlaps with QSOs, Galaxies, and Stars in all parameters. Unless proper motion and parallax data are known for all involved source classes, significant and clean CV samples cannot be built from standard data products, i.e. fluxes from multi-wavelength surveys, that one finds in current and will find in future archives (e.g. from Pan-STARRS, DES, VHS and similar).
However, plans exist for massive spectroscopic follow-up of eROSITA X-ray sources which will be purely flux-limited and shall include all types of X-ray emitters. Projects are underway to build new facilities with high multiplexity. Perhaps the most ambitious is 4MOST (de Jong 2011, 4-metre Multi-Object Spectroscopic Telescope), a very large field (goal 5 square degrees) multi-object spectrograph with up to 3000 fibers and spectral resolutions of 5000 and 20000. It is currently in a Conceptual Design phase and will turn one of the ESO 4-metre telescopes, either VISTA or the NTT, into a spectroscopy machine that will be able to survey the entire sky accessible from either La Silla or Paranal. The unique combination of eROSITA detection, 4MOST identification/classification and Gaia distance determination will open a new ’Golden Age of Cataclysmic Variables’. One will be able to measure the contribution of the various CV sub-classes to the Galactic Ridge X-ray emission and, if orbital periods are available, perform a detailed comparison with binary population synthesis models (Howell et al. 2001).
Acknowledgements.
This project was supported in part by the German DLR under contract 50OR0807.References
- Bikmaev et al. (2006) Bikmaev, I. F., Revnivtsev, M. G., Burenin, R. A., & Sunyaev, R. A. 2006, Astronomy Letters, 32, 588
- Butters et al. (2007) Butters, O. W., Barlow, E. J., Norton, A. J., & Mukai, K. 2007, A&A, 475, L29
- de Jong (2011) de Jong, R. e. a. 2011, The Messenger, 145, 14
- Gilli et al. (2005) Gilli, R., Daddi, E., Zamorani, G., et al. 2005, A&A, 430, 811
- Gioia et al. (2003) Gioia, I. M., Henry, J. P., Mullis, C. R., et al. 2003, ApJS, 149, 29
- Howell et al. (2001) Howell, S. B., Nelson, L. A., & Rappaport, S. 2001, ApJ, 550, 897
- Masetti et al. (2006) Masetti, N., Morelli, L., Palazzi, E., et al. 2006, A&A, 459, 21
- Motch et al. (2010) Motch, C., Warwick, R., Cropper, M. S., et al. 2010, A&A, 523, A92
- Pavlinsky et al. (2009) Pavlinsky, M., Sunyaev, R., Churazov, E., et al. 2009, in Society of Photo-Optical Instrumentation Engineers (SPIE) Conference Series
- Pineau et al. (2011) Pineau, F.-X., Motch, C., Carrera, F., et al. 2011, A&A, 527, A126
- Predehl et al. (2011) Predehl, P., Andritschke, R., Becker, W., et al. 2011, in Society of Photo-Optical Instrumentation Engineers (SPIE) Conference Series
- Pretorius & Knigge (2011) Pretorius, M. L. & Knigge, C. 2011, MNRAS, 1688
- Pretorius et al. (2007) Pretorius, M. L., Knigge, C., O’Donoghue, D., et al. 2007, MNRAS, 382, 1279
- Ramsay et al. (2009) Ramsay, G., Rosen, S., Hakala, P., & Barclay, T. 2009, MNRAS, 395, 416
- Ritter & Kolb (2003) Ritter, H. & Kolb, U. 2003, A&A, 404, 301
- Schwope et al. (2000) Schwope, A., Hasinger, G., Lehmann, I., et al. 2000, Astronomische Nachrichten, 321, 1
- Schwope et al. (2002) Schwope, A. D., Brunner, H., Buckley, D., et al. 2002, A&A, 396, 895
- Szkody et al. (2011) Szkody, P., Anderson, S. F., Brooks, K., et al. 2011, AJ, 142, 181
- Vogel et al. (2008) Vogel, J., Byckling, K., Schwope, A., et al. 2008, A&A, 485, 787
- Watson et al. (2009) Watson, M. G., Schröder, A. C., Fyfe, D., et al. 2009, A&A, 493, 339