Evolution of the Most Massive Galaxies to 0.6: II. The link between radio AGN activity and star formation
Abstract
We analyze the optical spectra of massive (log ) radio-loud galaxies at 0.2 and 0.6. Our samples are generated by crossmatching the SDSS DR7 and BOSS spectroscopic galaxy catalogues with the FIRST and NVSS radio continuum surveys. By comparing stellar population parameters of these radio-loud samples with radio-quiet control samples matched in stellar mass, velocity dispersion and redshift, we investigate how the presence of a radio-emitting jet relates to the recent star formation history of the host galaxy. We also investigate how the emission-line properties of the radio galaxies evolve with redshift by stacking their spectra. Our main results are the following. (1) Both at low and at high redshift, half as many radio-loud as radio-quiet galaxies have experienced significant star formation in the past Gyr. This difference in star formation history is independent of the luminosity of the radio AGN, except at radio luminosities greater than , where it disappears. (2) The Balmer absorption line properties of massive galaxies that have experienced recent star formation show that star formation occurred as a burst in many of these systems. (3) Both the radio and the emission-line luminosity of radio AGN evolve significantly with redshift. The average [O iii] rest equivalent width increases by 1 dex from = 0.2 to = 0.6, and emission line ratios change from LINER-like at low redshift to Seyfert-like at high redshift. However, radio galaxies with similar stellar population parameters, have similar emission-line properties both at high- and at low-redshift. These results suggest that massive galaxies experience cyclical episodes of gas accretion, star formation and black hole growth, followed by the production of a radio jet that shuts down further activity. The behaviour of galaxies with log is the same at = 0.6 as it is at = 0.2, except that higher redshift galaxies experience more star formation and black hole growth and produce more luminous radio jets during each accretion cycle.
keywords:
galaxies: evolution – galaxies: star formation1 Introduction
Large redshifts surveys such as the Sloan Digital Sky Survey (SDSS; York et al., 2000) and the Two Degree Field (2DF) redshift survey (Colless et al., 2001) have provided the sky coverage needed to define sufficiently large samples of nearby radio sources to study the population statistics and global energetics of these systems at . Best et al. (2005b) investigated the properties of a sample of 2215 nearby radio galaxies with 1.4 GHz radio luminosity below from SDSS, finding that the fraction of radio-loud AGN is a strong function of both black hole and stellar mass. Mauch & Sadler (2007) studied a sample of 2661 radio-loud AGN selected from the 6dF Galaxy Survey. They confirmed the findings of Best et al. (2005b) that radio-loud AGN preferentially inhabit the brightest and most massive host galaxies, and showed that the fraction of galaxies which host a radio-loud AGN correlates with the infrared -band luminosity as . Best et al. (2005b) also reported that there was no correlation between radio luminosity and optical emission-line luminosity for the galaxies in their sample, concluding that optical AGN and low-luminosity radio-loud AGN are independent phenomena which are triggered by different physical mechanisms. In later work, it was found that at fixed stellar mass, radio-loud AGN are preferentially located in denser environments than control samples of radio-quiet galaxies with similar masses and redshifts (Best et al., 2007; Wake et al., 2008a; Wake et al., 2008b; Mandelbaum et al., 2009; Donoso et al., 2010) as well as control samples of optically-identified AGN (Kauffmann et al., 2008; Donoso et al., 2010). These results have led to the paradigm that strong optical AGN activity is associated with galaxies with a significant cold gas reservoir and ongoing star formation (Heckman et al., 2004), while radio AGN activity may be associated with the accretion of hot gas in galaxies located at the centers of massive dark matter halos (Bower et al., 2006; Croton et al., 2006).
Observational support for a scenario in which radio AGN play an important role in regulating the growth of massive galaxies has accumulated rapidly over the past decade. X-ray studies of groups and clusters of galaxies with Chandra and XMM-Newton have shown that these jets interact strongly with their environment, blowing clear cavities or ‘bubbles’ in the surrounding X-ray-emitting gas (Boehringer et al., 1993; Fabian et al., 2000; Churazov et al., 2001; Fabian et al., 2003; Fabian et al., 2005; Forman et al., 2005). These cavities provide a direct estimate of the radio jet power (Bîrzan et al., 2004, 2008) and hence an empirical calibration of the relation between radio luminosity and mechanical power of the radio jet in nearby galaxies. The energy input from jets has been found to be sufficient to prevent star formation activity in massive early-type galaxies by heating the interstellar gas and suppressing the onset of cooling flows (Binney & Tabor, 1995; Bîrzan et al., 2004; Rawlings & Jarvis, 2004; Best et al., 2006, 2007; Schawinski et al., 2006).
If radio jets regulate ongoing star formation in massive galaxies, one might expect to see differences in the stellar populations of the host galaxies of radio-loud AGN compared to radio-quiet galaxies. Best et al. (2005b) compared the fraction of radio-loud AGN among galaxies with different values of the 4000 Å break strength (D4000), which is a powerful measure of the mean age of the stellar population in a galaxy. As can be seen from Figure 10 of that paper, there appears to be a lower fraction of radio-loud AGN among the most massive galaxies () with young stellar populations (i.e. low values of D4000). The statistics were rather poor, so Best et al. did not place much emphasis on this result.
While much of our knowledge about radio AGN is based upon studies of local galaxies, our understanding of the interplay between gas cooling processes and radio AGN feedback at higher redshifts is still very much in its infancy. Strong cosmological evolution of the high-luminosity radio source population has been long established (e.g., Dunlop & Peacock, 1990), but the role of this strongly evolving population in regulating the growth of massive galaxies at high redshifts is largely unconstrained. Johnston et al. (2008) constructed high signal-to-noise ratio (S/N) composite optical spectra of 375 radio-detected luminous red galaxies at . They compared composite spectra binned by radio luminosity and redshift with those of radio-quiet control galaxies and concluded that there were no differences in the stellar populations of the two samples, except for the most powerful radio galaxies (with ), which had stronger optical emission lines and younger stellar populations. We note, however, that the galaxy survey on which this analysis was based was subject to a strong pre-selection on galaxy colour and would miss blue, star-forming galaxies enitirely.
The Baryon Oscillation Spectroscopic Survey (BOSS; Dawson et al. 2012, submitted), one of the surveys of SDSS-III (Eisenstein et al., 2011), is currently obtaining spectra of 1.5 million luminous galaxies to . At redshifts greater than , the galaxy samples are reasonably complete at stellar masses greater than . In this paper, we have cross-correlated galaxies with from the BOSS spectroscopic survey with the National Radio Astronomy Observatory (NRAO) Very Large Array (VLA) Sky Survey (NVSS; Condon et al., 1998) and the Faint Images of the Radio Sky at Twenty centimeters (FIRST) survey (Becker et al., 1995) and have generated the largest sample of intermediate redshift radio galaxies to date. We use this sample to investigate whether radio-loud AGN have had unusual star formation histories (SFHs) compared to galaxies of similar mass and redshift. Similar to Johnston et al. (2008), we create composite optical spectra to study the emission line properties of radio-loud and radio-quiet galaxies. By comparing results obtained for the BOSS samples with those from the low-redshift radio AGN catalogue of Best & Heckman (2012), we study how the radio AGN population has evolved over a timescale of 3.3 Gyr.
Our paper is arranged as follows. In §2, we describe the low and high redshift radio-loud AGN samples and the construction of the radio-quiet control samples. In §3, we discuss how we extract information about the past star formation histories of the galaxies in our samples, present results for the radio-loud AGN hosts and the control galaxies, and analyze the emission line properties of radio galaxies using composite spectra . Our results are summarized in §4. We use the cosmological parameters , and throughout this paper.
2 Sample selection
2.1 The low-redshift radio-loud AGN sample
The Sloan Digital Sky Survey (SDSS; York et al., 2000) obtained photometry of nearly a quarter of the sky. A drift-scanning mosaic CCD camera (Gunn et al., 1998) mounted on the SDSS 2.5m telescope at Apache Point Observatory (Gunn et al., 2006) imaged the sky in the bands (Fukugita et al., 1996). The imaging data are astrometrically (Pier et al., 2003) and photometrically (Hogg et al., 2001; Padmanabhan et al., 2008) calibrated and used to select stars, galaxies, and quasars for follow-up fiber spectroscopy.
The seventh data release (DR7; Abazajian et al., 2009) of the SDSS includes about one million galaxy spectra. The spectra have a wavelength coverage of Å and are taken through diameter fibers. The low-redshift radio galaxy sample is described in Best & Heckman (2012). It has a flux density limit of 5mJy, which means the sample extends down to a radio luminosity of at redshift . This sample was constructed by cross-correlating 927,552 galaxies from the DR7 MPA/JHU value-added spectroscopic catalogue111The MPA/JHU catalogue is available at http://www.mpa-garching.mpg.de/SDSS/. with the NVSS and FIRST surveys. The cross-matching followed the method described by Best et al. (2005a), but also included the improvement developed by Donoso et al. (2009) for identification of sources without FIRST detections. Best & Heckman (2012) also separated radio AGN from star-forming galaxies. We refer the reader to their Appendix A for more details.
For the current paper, we begin with a subset of 5818 radio galaxies with -band magnitude , redshift and SPECPRIMARY flag = 1 drawn from Best & Heckman (2012) catalogue. The -band magnitude limit restricts the sources to the ‘main’ galaxy sample (Strauss et al., 2002). With the SPECPRIMARY flag = 1, we avoid repeat observations of a given object. Properties of the radio source host galaxies required in this work include total stellar masses (), stellar velocity dispersions () and SFH parameters derived from the principal component analysis method (PCA, Chen et al., 2012). Radio luminosities are calculated using the formula
| (1) |
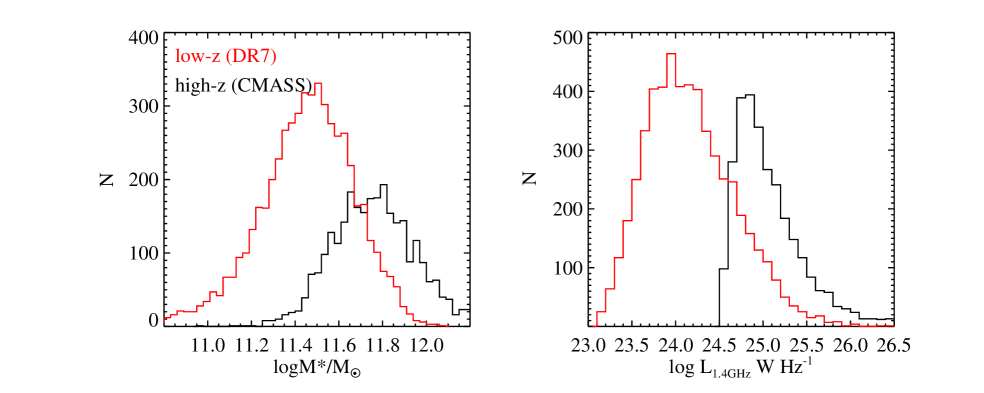
where is the luminosity distance in the adopted cosmology, is the measured radio flux density, is the standard -correction used in radio astronomy and is the radio spectral index (). We adopted , as is usually assumed for FRI radio galaxies (Condon et al., 2002). The red histograms in Figure 1 show the distribution of stellar mass and radio luminosities of the low redshift radio-loud AGN sample. Any galaxy that meets our radio flux cut is termed “radio-loud” in this paper.
2.2 The high-redshift radio-loud AGN sample
The SDSS-III project has completed an additional 3000 of imaging in the southern Galactic cap in a manner identical to the original SDSS imaging (Aihara et al., 2011). The Data Release 9 (DR9) of BOSS includes spectra of 462,979 luminous galaxies to (Ahn et al. 2012, submitted). The spectrographs (Smee et al. 2012, submitted) have been significantly upgraded from those used by SDSS-I/II, with improved CCDs with better red response, high throughput gratings. The new fibers are in diameter and the spectra cover the wavelength range 360010,000Å. Galaxy spectroscopic redshift is determined by the BOSS pipeline (Bolton et al. 2012, submitted). The details of how targets are selected from the photometry are described in Eisenstein et al. (2011).
The high redshift galaxy sample we analyze here is the “CMASS” sample (so-named, because it is very approximately stellar-mass limited). This sample is defined by the following cuts:
| (2) |
where is a “rotated” combination of colours defined as . The quantity is the -band magnitude of the galaxy measured within a BOSS fibre in the SDSS photometric system (Fukugita et al., 1996). All magnitude limits are given in terms of “cmodel” magnitudes whereas colour cuts are defined using “model” magnitudes. Two additional conditions are introduced to reduce contamination by stars: and (“psf” refers to the quantity in the SDSS database).
The cuts listed in equation (2) are designed to identify massive galaxies at . The parameter selects galaxies at high enough redshift that the 4000 Å break has shifted beyond the observer frame -band, leading to red observed colours. The cut on the -band magnitude is designed to produce a sample that is approximately complete down to a limiting stellar mass of (Chen et al., 2012).
We cross match the CMASS galaxies with NVSS and FIRST, using the same method as in Best & Heckman (2012). We generate a sample of 5469 radio galaxies with a flux density limit of 3mJy. In this work, we limit the sample to 2856 galaxies with where the colour incompleteness of the sample is minimized. As discussed in detail in Chen et al. (2012), the colour cut used to define the CMASS galaxies results in blue galaxies being missed from the survey, particularly at lower redshifts. Chen et al. (2012) showed that the fraction of massive galaxies with recent star formation could be under-estimated by more than an order of magnitude at . At higher redshifts, the correction to the fraction of actively star-forming galaxies is approximately a factor of two. The 3mJy flux limit corresponds to a radio luminosity of at redshift . At these very high radio luminosities, we will almost exclusively pick up radio-loud AGN rather than star-forming galaxies (Sadler et al., 2002; Best et al., 2005b).
Once again, the properties of the CMASS radio source host galaxies, including total stellar masses, stellar velocity dispersions and SFH parameters, are derived from the principal component analysis method, as described in (Chen et al., 2012). These authors found that the PCA method gives more robust estimations of D4000, HA and for the low S/N CMASS spectra ( 85% galaxies have a median S/N per pixel (69) below 4). The black histograms in Figure 1 show the distribution of stellar mass and radio luminosity of the high redshift radio-loud AGN sample. As can be seen, the high-redshift radio AGN are offset to higher stellar masses and radio luminosities compared to the low-redshift radio AGN, but there is a reasonable range in mass and luminosity where direct comparisons between the two samples can be made.
2.3 Radio-quiet control samples
We create samples of radio-quiet galaxies, which are matched as closely as possible to the radio-loud AGN hosts. The purpose of the control samples is to determine which galaxy properties are causally linked with the radio-emitting jet.
For each galaxy in the radio-loud sample, we find another galaxy located in the FIRST and NVSS survey area without a radio detection that is closely matched in redshift (), stellar mass (), and velocity dispersion ().
The motivation for choosing this set of matching parameters is the following:
-
1.
By constraining the control galaxy to be at similar redshift, we avoid any confusion due to evolutionary effects and we make sure the SDSS fibre spectrum includes light coming from the the same physical scales in both the radio galaxy and the control.
-
2.
Constraining the control galaxies to have similar stellar mass is extremely important because the probability that a galaxy is a radio source is a strong function of mass. Stellar population properties are known to vary strongly as a function of galaxy mass.
-
3.
Constraining the control galaxies to have similar velocity dispersions ensures that the radio-loud and the radio-quiet galaxy samples have roughly the same black hole mass distributions. Any AGN physics that is determined primarily by the black hole mass will thus be the same for the two samples.
Any radio galaxy without a radio-quiet twin is excluded from our analysis. This leaves a total of 5416 (2820) radio galaxies in the DR7 (CMASS) samples.
3 Results
3.1 Stellar populations of radio-loud and radio-quiet galaxies
In this section, we analyze the standard absorption line indices D4000 and HA, reconstructed using our PCA technique, as well as the parameter , defined as the ratio between the mass of the stars formed in the last Gyr and the stellar mass of the galaxy. The quantity can be transformed into the star formation rate (SFR) averaged over the last Gyr using the equation, SFR = .
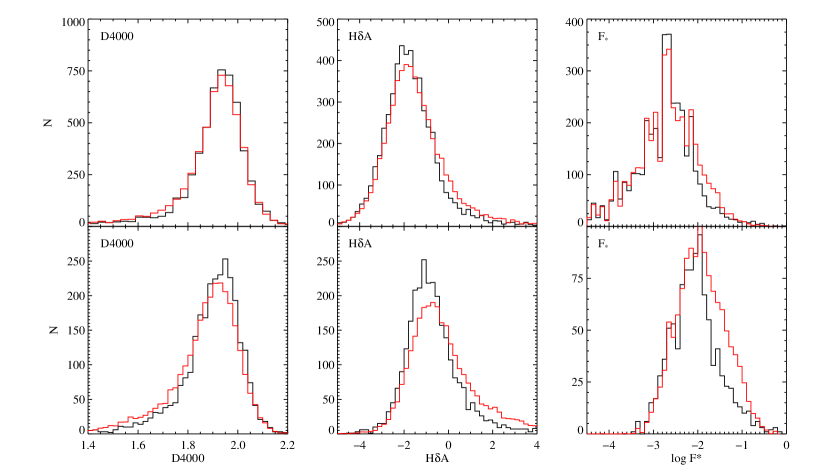
Figure 2 presents histograms of these quantities for DR7 radio-loud galaxies and controls in the top panel, and for CMASS radio-loud galaxies and controls in the bottom panel. The radio-loud galaxy sample (black histograms) is clearly shifted to larger values of D4000, smaller values of HA and smaller values of 222The number of galaxies included in the histograms is smaller than in the other two, because the majority of galaxies have undetectable small .. The largest differences are seen for HA and for at both low and at high redshifts. We performed a Kolmogorov-Smirnov (K-S) test on the D4000, HA, distributions of radio-loud and radio-quiet samples and obtained a probability smaller than for these three parameters for the null assumption that the radio-loud and radio-quiet galaxies are drawn from the same parent distribution.
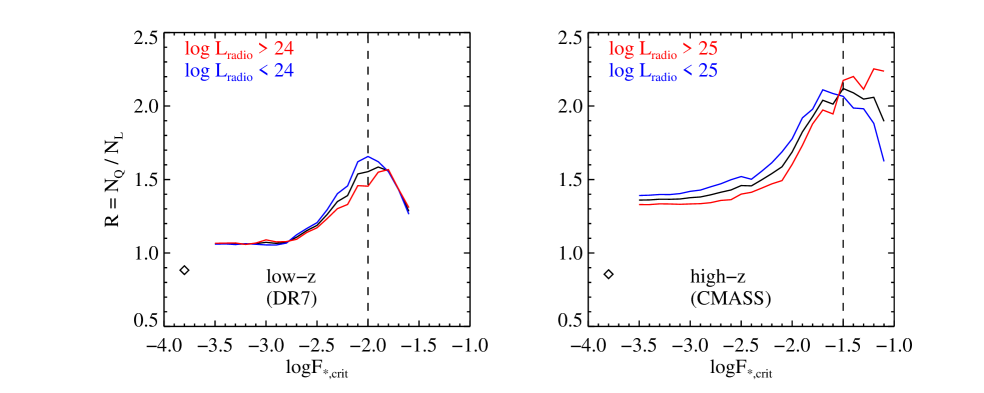
We now focus on (1) quantifying the difference between the stellar populations of radio-loud and radio-quiet galaxies in more detail; (2) studying the evolution of this difference with redshift. We define a parameter , where () is the number of galaxies with in the radio-loud (quiet) samples. is a certain value of . The left panel of Figure 3 shows as a function of log for DR7 galaxies, while the right panel shows the same thing for CMASS galaxies. In each panel, the red line represents galaxies with larger than the median radio luminosity ( for DR7, for CMASS), while the blue line is for galaxies with smaller than these values. The black line represents the whole sample. The diamonds in the bottom-left corner represent the ratio between the numbers of radio-quiet and radio-loud galaxies with . Figure 3 indicates that, 1) the ratio is always larger than 1, implying that the ratio of star forming to passive galaxies is always higher in the radio-quiet sample, 2) the ratio increases with , implying that radio AGN are more important for suppressing strong star formation as compared to weak star formation, 3) the differences in for low-luminosity and high-luminosity radio galaxies are negligible.
From Figure 3, one might be tempted to infer that is larger at higher redshifts. However, it is not fair to compare the DR7 and CMASS samples, because these two samples have very different stellar mass distributions (see the left panel of Figure 1), and the star formation history of a galaxy strongly depends on its stellar mass (e.g., Zheng et al., 2007; Chen et al., 2009; Karim et al., 2011). In order to study evolutionary effects, we match the DR7 and CMASS galaxies by stellar mass. We bin both samples by stellar mass with . For each stellar mass bin, we count the number of galaxies in both DR7 () and CMASS () samples. If , we randomly select galaxies from this certain mass bin of DR7, otherwise, we select galaxies from CMASS. This matching process leaves 1658 galaxies in both DR7 and CMASS samples. Unless specified otherwise, all future plots are based on mass-matched samples.
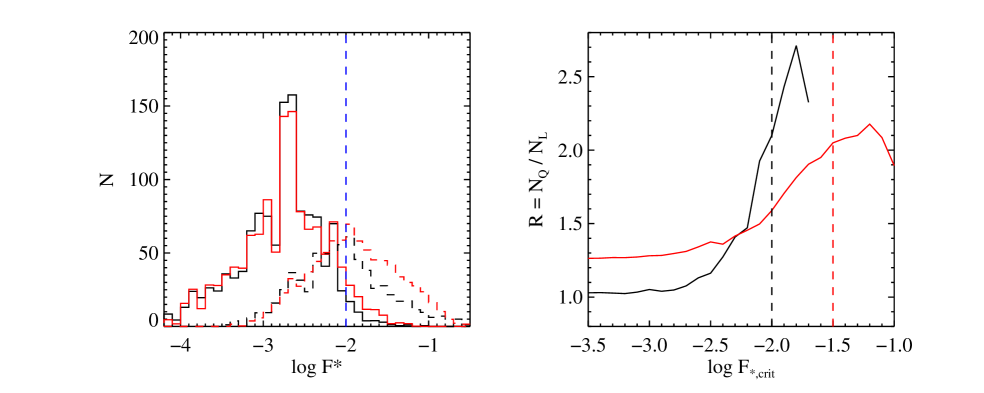
The left panel of Figure 4 shows the distributions of log for the four mass-matched samples: solid lines show results for DR7, dashed lines for CMASS; distributions for radio-loud and radio-quiet galaxies are shown as black and red histograms, respectively. Two conclusions are evident from this panel: (1) the distribution of is shifted to much higher values in the CMASS sample than in the DR7 sample. As shown by Chen et al. (2012), star formation in very massive galaxies () has evolved strongly since a redshift of 0.6; (2) in both DR7 and CMASS, there are more actively star-forming galaxies with log (the vertical blue line) in the radio-quiet sample than in the radio-loud sample. The right panel shows as a function of for the mass-matched DR7 (black) and CMASS (red) samples. As can be seen, the range in spanned by the two samples is much the same. For both the DR7 and CMASS samples increases from at low to a maximum value of around . The main difference is that the distribution of has been shifted to higher values in the CMASS sample, so the maximum occurs at a higher value of .
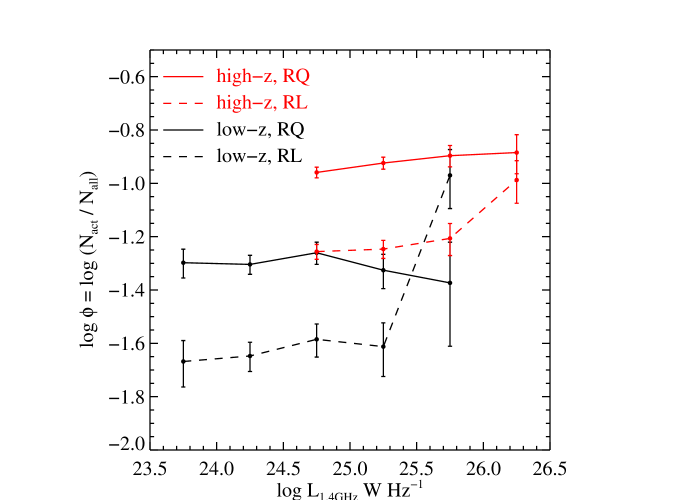
We now ask whether the fraction of actively star forming galaxies in the radio-loud sample depends on the threshold radio luminosity used to define it. We set log () for the CMASS (DR7) samples and we define the parameter to represent the fraction of galaxies with . Figure 5 shows as a function radio luminosity. Black lines are for DR7, while red lines are for CMASS. The dashed and solid lines represent radio-loud and radio-quiet galaxies, respectively. As expected, the fraction of actively star forming galaxies is higher in the radio-quiet samples. The main point of this plot is that remains constant over a wide range in radio luminosity. At the very highest radio luminosities ( for DR7, for CMASS), suddenly increases and the difference in the fraction of actively star forming galaxies in the radio-loud and the radio-quiet samples disappears.
3.2 Constraints on the star formation histories of massive galaxies
Figure 2 shows that the difference in HA between radio-loud AGN and radio-quiet control galaxies is much larger than the difference in D4000. This result is also true for the mass-matched samples. As discussed in Kauffmann et al. (2003a, b), the location of galaxies in the D4000HA plane can tell us whether they have been forming stars in a burst or continuously over the last Gyr. Galaxies with continuous star formation occupy a narrow strip in the D4000HA plane, while a recent burst displaces them away from this locus to higher values of HA for Gyr following the burst.
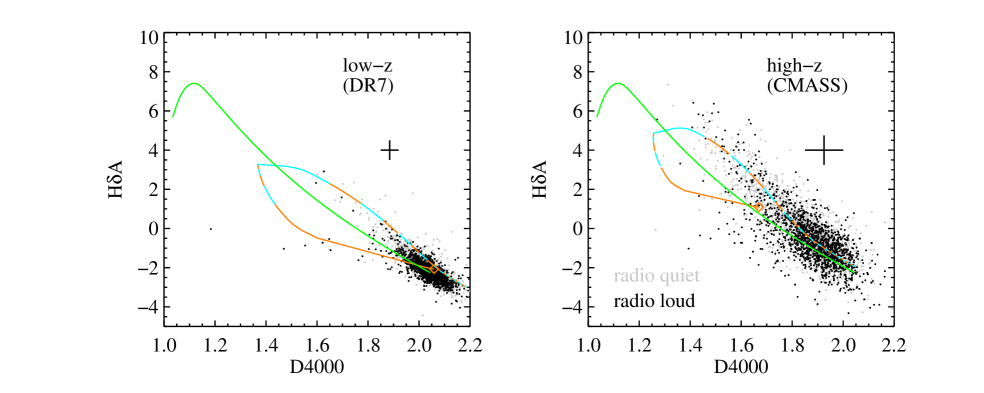
Figure 6 shows the DR7 (left) and CMASS (right) galaxies in the D4000HA plane. Black dots represent radio-loud AGN and grey dots represent radio-quiet galaxies. The over-plotted green line shows the locus of a model galaxy with exponentially declining SFH with time constant Gyr and twice solar metallicity. The orange-cyan line shows how a galaxy with an underlying old stellar population that experiences a recent burst of star formation evolves in the D4000HA plane. This model is calculated using Bruzual & Charlot (2003) population synthesis templates. The SFH consists of two parts: an underlying continuous model with Gyr plus a recent burst. The burst, which has twice solar metallicity and duration 0.5 Gyr, occurs when the galaxy is 8 (5) Gyr old and the fraction of stellar mass produced during the burst relative to the total mass formed by the continuous model is 1% (3%) in the left (right) panels. In the plot, the orange diamonds mark the place where the burst begins. Following the burst, every colour-coded section of the track represents a duration of 100 Myr.
These models are meant to be purely illustrative, and the values of burst duration and mass fraction that we have adopted are not tuned to fit to the data. The main conclusion that one reaches from studying Figure 6 is that the majority of CMASS and DR7 galaxies with D4000 lie systematically above the locus occupied by galaxies that have experienced exponentially declining star formation histories. These galaxies have D4000/HA values that can be explained if they have experienced recent bursts of star formation.
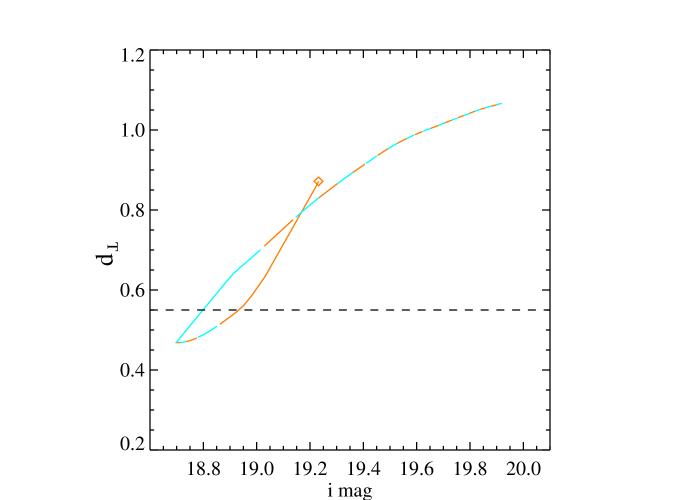
There are many more galaxies in the post-burst phase in which HA is offset to large values than in the “young burst phase”, when HA is low (in fact, often in emission). Part of the reason for this behaviour is that the time spent in the young burst phase is short. In addition, we caution that the colour cut used to define CMASS sample may exclude galaxies with a significant population of very young stars. Figure 7 shows the track of the burst model in the right panel of Figure 6 in the plane, where is the -band magnitude of the galaxy. A galaxy with a stellar mass of at the end of the burst is assumed. Once again, the orange diamond marks the point when burst begins; following the burst, every colour-coded part of the locus represents a duration of 100Myr. The horizontal dashed line marks the cut. It is clear that a burst can result in blue enough colours that a fraction of galaxies at may drop out of the sample. The burst track plotted in Figure 7 assumes no observational errors, which will scatter some young bursts into the region of . The effect of dust on the colours has also not been included in the models.
3.3 Emission line properties from composite spectra
3.3.1 Stacking by stellar population age
In this section, we analyze composite spectra in bins of , D4000 and HA for the DR7 and CMASS samples. The galaxy spectra are first corrected for foreground Galactic attenuation using the dust maps of Schlegel et al. (1998), transformed from flux densities to luminosity densities, and shifted to the rest frame using the redshift determined by the SDSS DR7/BOSS pipeline. Since most of the galaxies in our samples are intrinsically luminous galaxies, we normalize each spectrum by its mean luminosity in the wavelength range 53005500Å, and simply average the spectra with equal weight (note that the weight of the bad pixels identified in the SDSS mask array is set to zero).
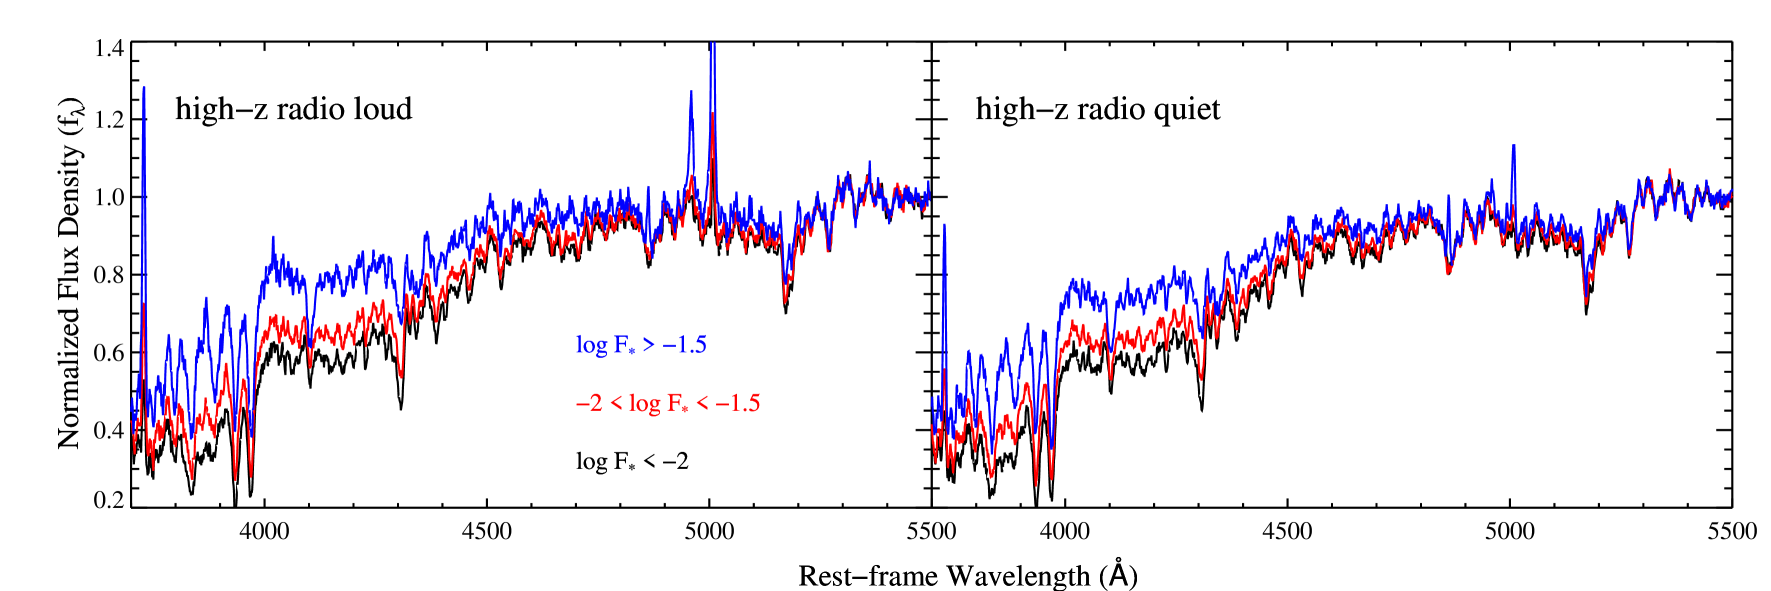
Figure 8 shows normalized composites of CMASS galaxies with log (black), log (red) and log (blue). We have not attempted to divide the galaxies with log into separate bins because the PCA method is not able to recover the SFHs of galaxies in which less than 1% of the stellar population formed in the last Gyr. As expected, for both radio-loud (left panel) and radio-quiet (right panel) galaxies, emission line fluxes (e.g. [O ii], [O iii]) increase for larger values of and the spectra also become bluer, and the bluest galaxies have stronger emission lines if they are radio-loud than radio-quiet. Composites binned by D4000 and HA yield very similar results, so we do not present them here.
3.3.2 Stacking by radio luminosity
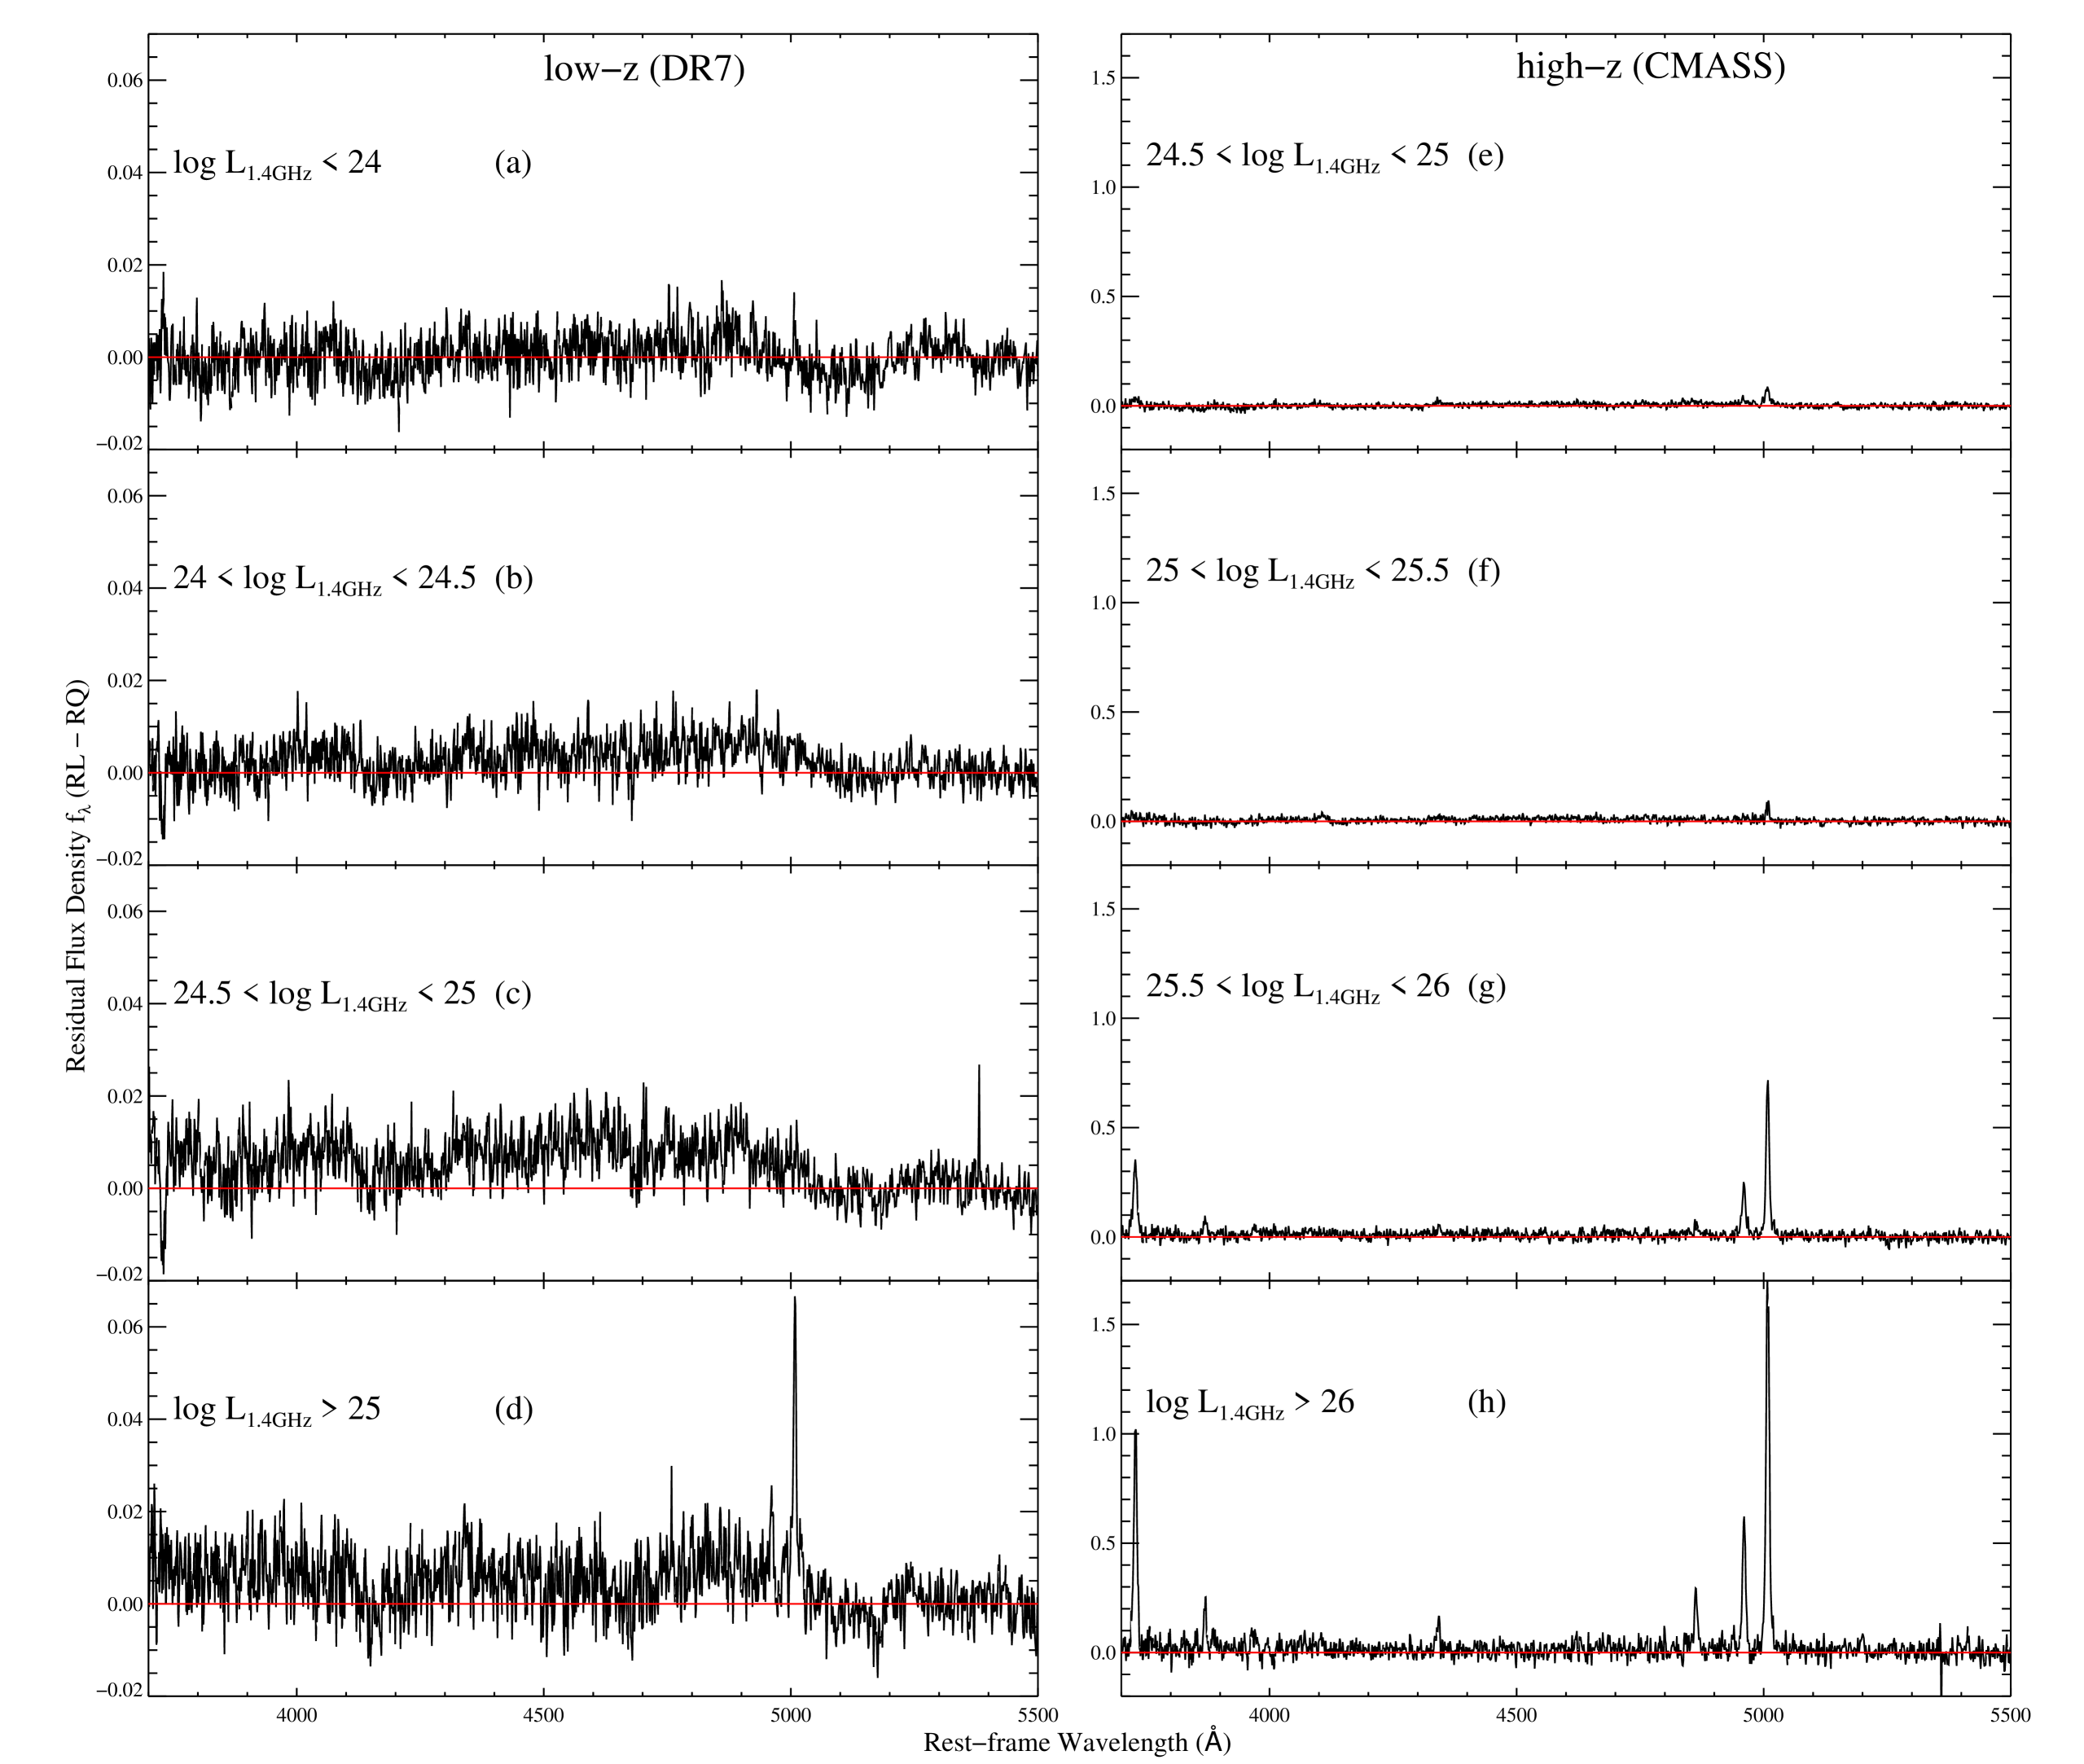
Figure 9 shows the difference between the composite spectra of radio-loud and radio-quiet galaxies for different bins in radio luminosity. Radio luminosity increases from top to bottom in the plot. The left panel shows results for DR7 and the right panel for CMASS. The red lines mark zero flux density difference. The near zero residual flux in Figure 9, except for regions around the emission lines, indicates that the average stellar continua of radio-loud and radio-quiet galaxies are quite similar. At first sight, this result may appear to conflict with the conclusions presented in the previous section. However, when we check the Bruzual & Charlot (2003) stellar population models, we find that a simple stellar population with an age of 0.5 Gyr is typically 10 times less luminous in the -band than a 5 Gyr old stellar population of similar mass. In the CMASS radio-quiet sample, the fraction of galaxies that have formed more than 3% of their stellar mass in the last Gyr is about 10%. We estimate that if we stack all the CMASS radio-quiet galaxies together, the fraction of light contributed by stars less than 1 Gyr in age will contribute only 3% of the total flux in the composite spectrum. This explains why the stellar continua of the radio-loud and radio-quiet composite spectra are nearly identical.
There are almost no emission lines visible in the composite spectra of the DR7 galaxies, except weak [O iii]4959,5007, which appears in panel (d) in the composite spectra of the most powerful radio sources. Almost all very massive galaxies () are inactive at low redshifts. In contrast, the spectra of the CMASS radio-loud galaxies have obvious emission lines (e.g., [O ii], [Ne iii], H, [O iii]) and the emission line strengths increase strongly with radio power.
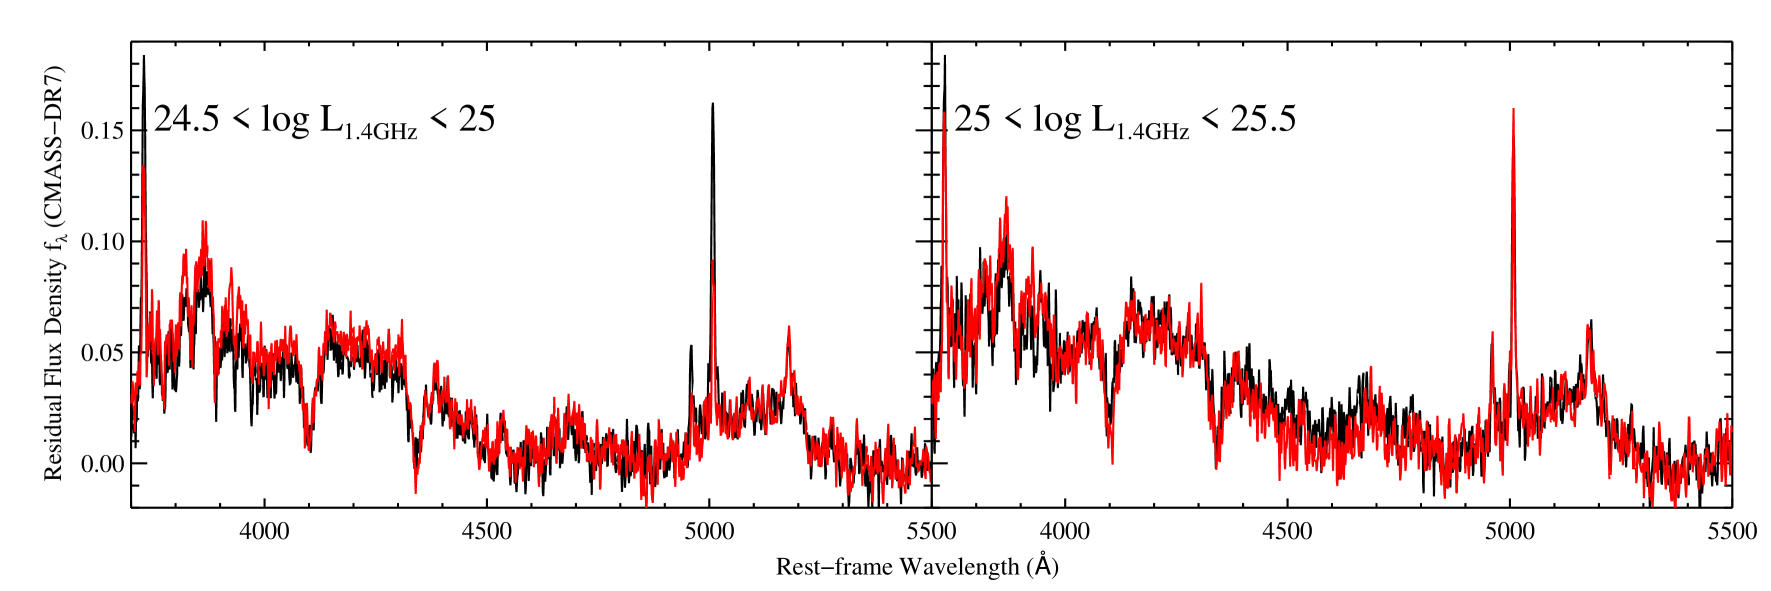
There are two bins of radio luminosity where we can compare the DR7 and CMASS composite spectra directly. Figure 10 shows the residual between CMASS and DR7 composites for these two bins: black lines are for radio-loud galaxies, while red lines are for radio-quiet galaxies. It is clear that the CMASS composite spectra are bluer and have stronger Balmer absorption lines. This indicates that the high redshift massive galaxies have significantly younger stellar populations on average.
3.3.3 Correlations between emission line properties and star formation
Following the methodology described in Tremonti et al. (2004) and Brinchmann et al. (2004), we fit a linear superposition of stellar population templates to the stellar continua of the composite spectra presented in §3.3.1 & 3.3.2. We subtract the continuum model from the composite, and measure the rest equivalent width (EQW) of [O iii]5007 from the residual spectrum.
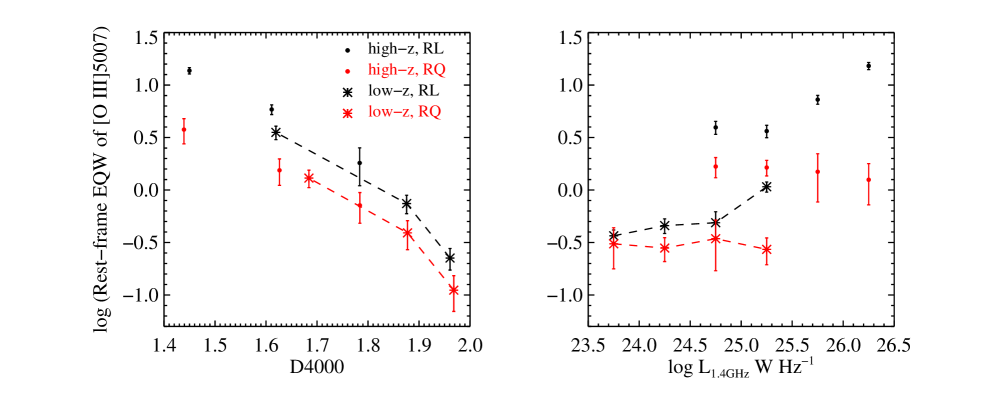
Correlations between [O iii] EQW and D4000 and radio power are shown in Figure 11. Black and red symbols represent radio-loud galaxies and radio-quiet galaxies, respectively. Stars connected by dashed lines represent galaxies from DR7 and solid points represent galaxies from CMASS. As can be seen from the left panel, the strength of [O iii] emission correlates strongly with D4000 for both radio-quiet galaxies and for radio-loud AGN. In the DR7 galaxy sample, the emission lines from extremely massive galaxies () almost always have ratios indicative of ionization by “hard spectrum” sources (AGN or post-asymptotic giant branch stars; Kauffmann et al., 2003c). For the CMASS galaxies, [N ii] and H have shifted out of the observed spectral range, but alternative diagnostic diagrams such as EQW-[O ii]/EQW-H vs. log EQW-[O ii] (Rola et al., 1997) indicate that the emission is still dominated by AGN.
If we regard the [O iii] line as a tracer of the accretion of matter onto a central black hole333Population synthesis models (e.g. Bruzual & Charlot 2003) show that [OIII] EQW of more than a few Å cannot be produced by PAGB star ionization., the left panel of Figure 11 indicates that the average black hole growth is correlated with the growth of the galaxy, as has been discussed previously (Heckman et al., 2004). It is interesting that at fixed D4000, radio AGN have somewhat higher [O iii] EQW values than the control galaxies. This suggests that shock excitation from the jet may contribute to the [O iii] emission. The effect is quite weak (less than a 50% change in [O iii] EQW). To zeroth order, one relation between [O iii] EQW and D4000 seems to adequately describe radio-loud and radio-quiet galaxies at and at .
The right panel of Figure 11 shows trends in [O iii] EQW as a function of radio power for the composite spectra constructed from the DR7 and CMASS samples. This plot shows that the [O iii] EQW does not correlate with radio power at radio luminosities below W Hz-1 both for the DR7 and the CMASS radio samples. At fixed radio luminosity, high-redshift radio galaxies have higher [O iii] EQW than low-redshift radio galaxies. The same effect is seen in the control sample, so we attribute this evolution to the fact the amount of recent star formation in the massive galaxy population increases with redshift. At radio luminosities higher than W Hz-1, the [O iii] EQW increases as a function of radio power. This is not seen in the control sample galaxies, so this phenomenon must be intrinsic to the radio-emitting jet itself.
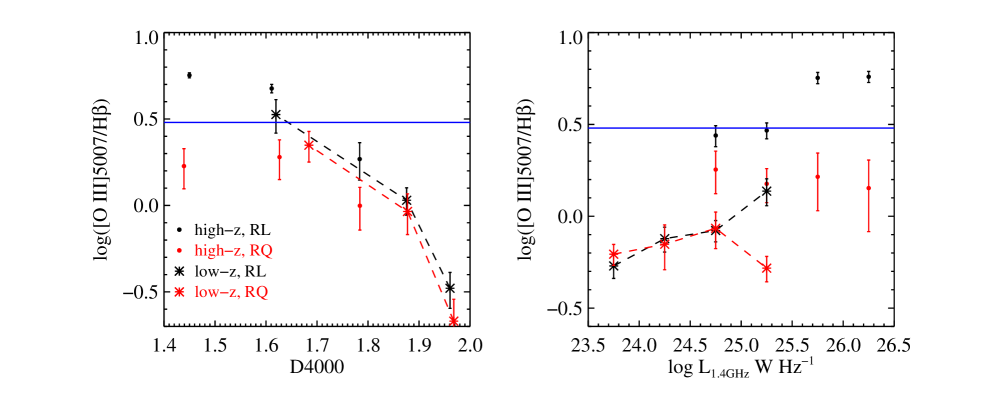
Figure 12 shows the ratio between the [O iii] and H line fluxes as a function of D4000 and radio power. The symbols and lines have the same meaning as that in Figure 11. The blue horizontal line demarcates the value of [O iii]/H that separates Seyferts from LINERs in the AGN population (Kauffmann et al., 2003c). The trends visible in this plot mirror what is seen in Figure 11. There is a strong correlation between [O iii]/H and D4000, which does not depend on redshift and which is roughly the same for radio-loud and radio-quiet galaxies (we again see a slight excess in [O iii] emission for the radio-loud population in this plot; it is particularly evident at low values of D4000). The “universal” correlation between [O iii]/H and D4000 again leads us to attribute much of the evolution in [O iii]/H in the right panel of Figure 12 to the changing stellar populations of high-redshift galaxies. However, the abrupt increase in [O iii]/H to Seyfert-like values found at radio luminosities in excess of W Hz-1 is not seen in control samples, and must be intrinsic to the most powerful radio sources.
Recall that in the previous subsection, we found that stellar population differences between radio-loud galaxies and the radio-quiet controls disappears at radio luminosities above W Hz-1. These highly luminous radio galaxies either correspond to a very early phase of the evolution of the black hole/jet before star formation has been suppressed, or they represent a separate population of black holes that are undergoing a different accretion mechanism. We will investigate these questions in more depth in future work.
4 Summary
We have cross-matched the SDSS-III BOSS galaxy spectroscopic sample with the NVSS and FIRST surveys, generating the largest radio galaxy sample with optical spectroscopy at to date. Combining this sample with the SDSS DR7 radio-loud AGN catalogue of Best & Heckman (2012), we study the evolution of the recent star formation histories of the host galaxies of radio-loud AGN, as well as radio-quiet “control” galaxies that are matched in redshift, stellar mass, and velocity dispersion.
In previous work (Chen et al 2012), we found that the fraction of massive galaxies that have formed a significant fraction ( a few percent) of their stars in the past Gyr has strongly decreased with redshift from to the present day. The goal of this paper is to analyze if this evolution is linked to the radio-emitting jets hosted by massive galaxies. Our main empirical results may be summarized as follows:
-
1.
For galaxies with stellar masses , the fraction of actively star-forming galaxies is times lower among galaxies with radio-emitting jets than in the radio-quiet control samples. This is true both at low- and at high- redshift. The factor of two difference in the fraction of star-forming galaxies is independent of radio luminosity, except for radio galaxies with luminosities in excess of W Hz-1, where the difference disappears.
-
2.
The locus of massive galaxies in the D4000HA plane suggests that their star formation histories are characterized by bursts rather than low-level continuous star formation. A smaller fraction of radio-loud galaxies have undergone significant ( a few percent in mass fraction) starbursts in the last Gyr compared to radio-quiet objects.
-
3.
There is a strong correlation between [O iii] EQW and stellar population age (D4000) both for radio-loud AGN and for the control sample of radio-quiet galaxies. The relation between [O iii] EQW and D4000 does not change with redshift.
-
4.
At fixed radio power, there is strong positive evolution in [O iii] EQW with redshift. The [O iii]/H ratio also increases at higher redshift, i.e.; radio galaxies are more LINER-like at low redshift and more Seyfert-like at high redshift. We interpret these correlations as induced trends, which follow from the fact that all high redshift massive galaxies have more gas, younger stellar populations and larger black hole accretion rates.
Our results suggest a picture in which massive galaxies experience cyclical episodes of gas accretion, star formation and black hole growth, followed by production of a radio jet that acts to shut down the star formation in the galaxy. The behaviour of galaxies with is the same at as it is at , except that higher redshift galaxies experience more black hole growth and star formation and produce more luminous radio jets during each accretion cycle.
Let us imagine a scenario in which gas is gradually accreting onto a massive galaxy. There may be an “accumulation phase” where the cold gas gradually builds up in a disk with little or no star formation. After some critical gas density is reached, the disk may become unstable and lose angular momentum (Salim et al., 2012). Molecular clouds form and star formation is triggered. This corresponds to the “burst phase”. The radio source is triggered when gas finally reaches the central black hole. As the jet expands, it pushes away the surrounding cold gas, causing the starburst to shut down. The radio lobes expand into the surrounding intra-cluster medium, heat the ambient gas and shut down cooling onto the central galaxy. The shutdown of cooling removes the power source of the jet and the galaxy eventually returns to its original radio-quiet accumulation phase.
This picture is consistent with a population of radio galaxies with lower cold gas content and older stellar populations than radio-quiet galaxies. The strong evolution in the fraction of massive galaxies with significant star formation may be explained by increased cooling efficiencies in massive halos at higher redshift (see Figure 2 of White & Frenk, 1991). If the accumulation and starburst phases have roughly equal durations, this would lead to a 2:1 ratio of starbursts in the radio-quiet and radio-loud populations, as observed. Recall, however, that clustering analyses demonstrate that radio-loud AGN are preferentially located at the centers of massive dark matter halos (Best et al., 2007; Wake et al., 2008a; Wake et al., 2008b; Mandelbaum et al., 2009; Donoso et al., 2010) where gas cooling and accumulation rates are presumably higher. A fair assessment of the jet/burst duty cycle requires one to control for such environment-dependent effects. However, in CMASS samples, most galaxies are classified as central galaxies, satellites are a very small fraction of the total this is because of the very high stellar mass selection (Kovac et al. 2012, in preparation).
The missing link in our analysis of the accretion/starburst/jet cycle in massive galaxies is direct observations of the gas itself. An analysis of Chandra X-ray Observatory archival data of the hot gas in 222 nearby galaxy clusters revealed that H and radio emission from the brightest cluster galaxy is much more pronounced when the the cluster’s core gas entropy is low (Cavagnolo et al., 2008). Systematic studies of atomic and molecular gas in massive galaxies are still limited to small samples (e.g. Schawinski et al., 2009; Catinella et al., 2010; Saintonge et al., 2011). Because radio galaxies are rare, large wide-field surveys will be required before samples are large enough to study how the cold interstellar medium of massive radio-loud galaxies differs from that of their radio-quiet counterparts. In the shorter term, it will possible to stack DR7 and BOSS spectra to search for signatures of ionized gas outflows in luminous radio-loud galaxies and in post-burst radio-quiet galaxies (e.g. Chen et al., 2010). This will be the subject of future work.
acknowledgements
We are very grateful to P. N. Best for kindly providing his codes for matching SDSS, NVSS and FIRST. The research is supported by the National Natural Science Foundation of China (NSFC) under NSFC-10878010, 10633040, 11003007 and 11133001, the National Basic Research Program (973 program No. 2007CB815405) and the National Science Foundation of the United States Grant No. 0907839.
Thanks go to the Aspen Center for Physics, which is supported by NSF Grant No. 1066293, for hospitality during the writing of this paper.
Funding for SDSS-III has been provided by the Alfred P. Sloan Foundation, the Participating Institutions, the National Science Foundation, and the U.S. Department of Energy. SDSS-III is managed by the Astrophysical Research Consortium for the Participating Institutions of the SDSS-III Collaboration including the University of Arizona, the Brazilian Participation Group, Brookhaven National Laboratory, University of Cambridge, University of Florida, the French Participation Group, the German Participation Group, the Instituto de Astrofisica de Canarias, the Michigan State/Notre Dame/JINA Participation Group, Johns Hopkins University, Lawrence Berkeley National Laboratory, Max Planck Institute for Astrophysics, New Mexico State University, New York University, Ohio State University, Pennsylvania State University, University of Portsmouth, Princeton University, the Spanish Participation Group, University of Tokyo, University of Utah, Vanderbilt University, University of Virginia, University of Washington, and Yale University.
The research uses the NVSS and FIRST radio surveys, carried out using the NRAO VLA: NRAO is operated by Associated Universities Inc., under co-operative agreement with the National Science Foundation.
References
- Abazajian et al. (2009) Abazajian K. N., Adelman-McCarthy J. K., Agüeros M. A., Allam S. S., Allende Prieto C., An D., Anderson K. S. J., Anderson S. F., Annis J., Bahcall N. A., et al. 2009, ApJS, 182, 543
- Aihara et al. (2011) Aihara H., Allende Prieto C., An D., Anderson S. F., Aubourg É., Balbinot E., Beers T. C., Berlind A. A., et al. 2011, ApJS, 193, 29
- Becker et al. (1995) Becker R. H., White R. L., Helfand D. J., 1995, ApJ, 450, 559
- Best & Heckman (2012) Best P. N., Heckman T. M., 2012, MNRAS, 421, 1569
- Best et al. (2006) Best P. N., Kaiser C. R., Heckman T. M., Kauffmann G., 2006, MNRAS, 368, L67
- Best et al. (2005a) Best P. N., Kauffmann G., Heckman T. M., Ivezić Ž., 2005a, MNRAS, 362, 9
- Best et al. (2005b) Best P. N., Kauffmann G., Heckman T. M., Brinchmann J., Charlot S., Ivezić Ž., White S. D. M., 2005b, MNRAS, 362, 25
- Best et al. (2007) Best P. N., von der Linden A., Kauffmann G., Heckman T. M., Kaiser C. R., 2007, MNRAS, 379, 894
- Binney & Tabor (1995) Binney J., Tabor G., 1995, MNRAS, 276, 663
- Bîrzan et al. (2008) Bîrzan L., McNamara B. R., Nulsen P. E. J., Carilli C. L., Wise M. W., 2008, ApJ, 686, 859
- Bîrzan et al. (2004) Bîrzan L., Rafferty D. A., McNamara B. R., Wise M. W., Nulsen P. E. J., 2004, ApJ, 607, 800
- Boehringer et al. (1993) Boehringer H., Voges W., Fabian A. C., Edge A. C., Neumann D. M., 1993, MNRAS, 264, L25
- Bower et al. (2006) Bower R. G., Benson A. J., Malbon R., Helly J. C., Frenk C. S., Baugh C. M., Cole S., Lacey C. G., 2006, MNRAS, 370, 645
- Brinchmann et al. (2004) Brinchmann J., Charlot S., White S. D. M., Tremonti C., Kauffmann G., Heckman T., Brinkmann J., 2004, MNRAS, 351, 1151
- Bruzual & Charlot (2003) Bruzual G., Charlot S., 2003, MNRAS, 344, 1000
- Catinella et al. (2010) Catinella B., Schiminovich D., Kauffmann G., Fabello S., Wang J., Hummels C., Lemonias J., Moran S. M., et al. 2010, MNRAS, 403, 683
- Cavagnolo et al. (2008) Cavagnolo K. W., Donahue M., Voit G. M., Sun M., 2008, ApJ, 683, L107
- Chen et al. (2012) Chen Y.-M., Kauffmann G., Tremonti C. A., White S., Heckman T. M., Kovač K., Bundy K., Chisholm J., et al. 2012, MNRAS, 421, 314
- Chen et al. (2010) Chen Y.-M., Tremonti C. A., Heckman T. M., Kauffmann G., Weiner B. J., Brinchmann J., Wang J., 2010, AJ, 140, 445
- Chen et al. (2009) Chen Y.-M., Wild V., Kauffmann G., Blaizot J., Davis M., Noeske K., Wang J.-M., Willmer C., 2009, MNRAS, 393, 406
- Churazov et al. (2001) Churazov E., Brüggen M., Kaiser C. R., Böhringer H., Forman W., 2001, ApJ, 554, 261
- Colless et al. (2001) Colless M., Dalton G., Maddox S., Sutherland W., Norberg P., Cole S., Bland-Hawthorn J., Bridges T., et al. 2001, MNRAS, 328, 1039
- Condon et al. (2002) Condon J. J., Cotton W. D., Broderick J. J., 2002, AJ, 124, 675
- Condon et al. (1998) Condon J. J., Cotton W. D., Greisen E. W., Yin Q. F., Perley R. A., Taylor G. B., Broderick J. J., 1998, AJ, 115, 1693
- Croton et al. (2006) Croton D. J., Springel V., White S. D. M., De Lucia G., Frenk C. S., Gao L., Jenkins A., Kauffmann G., et al. 2006, MNRAS, 365, 11
- Donoso et al. (2009) Donoso E., Best P. N., Kauffmann G., 2009, MNRAS, 392, 617
- Donoso et al. (2010) Donoso E., Li C., Kauffmann G., Best P. N., Heckman T. M., 2010, MNRAS, 407, 1078
- Dunlop & Peacock (1990) Dunlop J. S., Peacock J. A., 1990, MNRAS, 247, 19
- Eisenstein et al. (2011) Eisenstein D. J., Weinberg D. H., Agol E., Aihara H., Allende Prieto C., Anderson S. F., Arns J. A., Aubourg É., Balbinot E., et al. 2011, AJ, 142, 72
- Fabian et al. (2003) Fabian A. C., Sanders J. S., Allen S. W., Crawford C. S., Iwasawa K., Johnstone R. M., Schmidt R. W., Taylor G. B., 2003, MNRAS, 344, L43
- Fabian et al. (2000) Fabian A. C., Sanders J. S., Ettori S., Taylor G. B., Allen S. W., Crawford C. S., Iwasawa K., Johnstone R. M., et al. 2000, MNRAS, 318, L65
- Fabian et al. (2005) Fabian A. C., Sanders J. S., Taylor G. B., Allen S. W., 2005, MNRAS, 360, L20
- Forman et al. (2005) Forman W., Nulsen P., Heinz S., Owen F., Eilek J., Vikhlinin A., Markevitch M., Kraft R., et al. 2005, ApJ, 635, 894
- Fukugita et al. (1996) Fukugita M., Ichikawa T., Gunn J. E., Doi M., Shimasaku K., Schneider D. P., 1996, AJ, 111, 1748
- Gunn et al. (1998) Gunn J. E., Carr M., Rockosi C., Sekiguchi M., Berry K., Elms B., de Haas E., Ivezić Ž., et al. 1998, AJ, 116, 3040
- Gunn et al. (2006) Gunn J. E., Siegmund W. A., Mannery E. J., Owen R. E., Hull C. L., Leger R. F., Carey L. N., Knapp G. R., et al. 2006, AJ, 131, 2332
- Heckman et al. (2004) Heckman T. M., Kauffmann G., Brinchmann J., Charlot S., Tremonti C., White S. D. M., 2004, ApJ, 613, 109
- Hogg et al. (2001) Hogg D. W., Finkbeiner D. P., Schlegel D. J., Gunn J. E., 2001, AJ, 122, 2129
- Johnston et al. (2008) Johnston H. M., Sadler E. M., Cannon R., Croom S. M., Ross N. P., Schneider D. P., 2008, MNRAS, 384, 692
- Karim et al. (2011) Karim A., Schinnerer E., Martínez-Sansigre A., Sargent M. T., van der Wel A., Rix H.-W., Ilbert O., Smolčić V., et al. 2011, ApJ, 730, 61
- Kauffmann et al. (2008) Kauffmann G., Heckman T. M., Best P. N., 2008, MNRAS, 384, 953
- Kauffmann et al. (2003a) Kauffmann G., Heckman T. M., White S. D. M., Charlot S., Tremonti C., Brinchmann J., Bruzual G., Peng E. W., et al. 2003a, MNRAS, 341, 33
- Kauffmann et al. (2003b) Kauffmann G., Heckman T. M., White S. D. M., Charlot S., Tremonti C., Peng E. W., Seibert M., Brinkmann J., et al. 2003b, MNRAS, 341, 54
- Kauffmann et al. (2003c) Kauffmann G., Heckman T. M., Tremonti C., Brinchmann J., Charlot S., White S. D. M., Ridgway S. E., Brinkmann J., et al. 2003c, MNRAS, 346, 1055
- Mandelbaum et al. (2009) Mandelbaum R., Li C., Kauffmann G., White S. D. M., 2009, MNRAS, 393, 377
- Mauch & Sadler (2007) Mauch T., Sadler E. M., 2007, MNRAS, 375, 931
- Padmanabhan et al. (2008) Padmanabhan N., Schlegel D. J., Finkbeiner D. P., Barentine J. C., Blanton M. R., Brewington H. J., Gunn J. E., Harvanek M., et al. 2008, ApJ, 674, 1217
- Pier et al. (2003) Pier J. R., Munn J. A., Hindsley R. B., Hennessy G. S., Kent S. M., Lupton R. H., Ivezić Ž., 2003, AJ, 125, 1559
- Rawlings & Jarvis (2004) Rawlings S., Jarvis M. J., 2004, MNRAS, 355, L9
- Rola et al. (1997) Rola C. S., Terlevich E., Terlevich R. J., 1997, MNRAS, 289, 419
- Sadler et al. (2002) Sadler E. M., Jackson C. A., Cannon R. D., McIntyre V. J., Murphy T., Bland-Hawthorn J., Bridges T., Cole S., et al. 2002, MNRAS, 329, 227
- Saintonge et al. (2011) Saintonge A., Kauffmann G., Kramer C., Tacconi L. J., Buchbender C., Catinella B., Fabello S., Graciá-Carpio J., et al. 2011, MNRAS, 415, 32
- Salim et al. (2012) Salim S., Fang J. J., Rich R. M., Faber S. M., Thilker D. A., 2012, ArXiv e-prints
- Schawinski et al. (2006) Schawinski K., Khochfar S., Kaviraj S., Yi S. K., Boselli A., Barlow T., Conrow T., Forster K., et al. 2006, Nature, 442, 888
- Schawinski et al. (2009) Schawinski K., Lintott C. J., Thomas D., Kaviraj S., Viti S., Silk J., Maraston C., Sarzi M., et al. 2009, ApJ, 690, 1672
- Schlegel et al. (1998) Schlegel D. J., Finkbeiner D. P., Davis M., 1998, ApJ, 500, 525
- Strauss et al. (2002) Strauss M. A., Weinberg D. H., Lupton R. H., Narayanan V. K., Annis J., Bernardi M., Blanton M., Burles S., et al. 2002, AJ, 124, 1810
- Tremonti et al. (2004) Tremonti C. A., Heckman T. M., Kauffmann G., Brinchmann J., Charlot S., White S. D. M., Seibert M., Peng E. W., et al. 2004, ApJ, 613, 898
- Wake et al. (2008a) Wake D. A., Sheth R. K., Nichol R. C., Baugh C. M., Bland-Hawthorn J., Colless M., Couch W. J., Croom S. M., et al. 2008a, MNRAS, 387, 1045
- Wake et al. (2008b) Wake D. A., Croom S. M., Sadler E. M., Johnston H. M., 2008b, MNRAS, 391, 1674
- White & Frenk (1991) White S. D. M., Frenk C. S., 1991, ApJ, 379, 52
- York et al. (2000) York D. G., Adelman J., Anderson Jr. J. E., Anderson S. F., Annis J., Bahcall N. A., Bakken J. A., Barkhouser R., et al. 2000, AJ, 120, 1579
- Zheng et al. (2007) Zheng X. Z., Bell E. F., Papovich C., Wolf C., Meisenheimer K., Rix H.-W., Rieke G. H., Somerville R., 2007, ApJ, 661, L41