Effect of Co doping on the in-plane anisotropy in the optical spectrum of underdoped Ba(Fe1-xCox)2As2
Abstract
We investigated the anisotropy in the in-plane optical spectra of detwinned Ba(Fe1-xCox)2As2. The optical conductivity spectrum of BaFe2As2 shows appreciable anisotropy in the magnetostructural ordered phase, whereas the dc () resistivity is almost isotropic at low temperatures. Upon Co doping, the resistivity becomes highly anisotropic, while the finite-energy intrinsic anisotropy is suppressed. It is found that anisotropy in resistivity arises from anisotropic impurity scattering from doped Co atoms, extrinsic in origin. Intensity of a specific optical phonon mode is also found to show striking anisotropy in the ordered phase. The anisotropy induced by Co impurity and that observed in the optical phonon mode are hallmarks of the highly polarizable electronic state in the ordered phase.
pacs:
A parent compound of iron-arsenide superconductors, e.g., BaFe2As2, exhibits a magnetostructural phase transition from a paramagnetic-tetragonal (PT) to an antiferromagnetic-orthorhombic (AFO) phase. The antiferromagnetic order is of stripe type — Fe spins align antiferromagnetically along the longer crystallographic axis and ferromagnetically along the shorter axis Cruz2008 ; Rotter2008 ; Huang2008 . An anisotropic electronic state realized in the AFO phase of undoped and underdoped iron arsenides has attracted much interest as a proximate phase to superconductivity Fisher2011 . The resistivity measurement on detwinned single crystals of Ba(Fe1-xCox)2As2 revealed that the resistivity along the axis is higher than that along the axis Chu2010 ; Tanatar2010 . Spectroscopic experiments, such as neutron scattering Zhao2009 , scanning tunneling spectroscopy Chuang2010 , and angle-resolved photoemission spectroscopy (ARPES) Shimojima2010 ; Yi2011 , were also successful in observing the electronic anisotropy in the iron arsenides.
The origin of the anisotropy in the AFO phase which breaks the fourfold symmetry of the PT phase has been discussed in terms of either anisotropic spin exchange interactions Fang2008 ; Xu2008 ; Fernandes2010 or orbital ordering/polarization with inequivalent Fe 3dxz and 3dyz orbitals Lee2009 ; Kruger2009 ; Yin2010 ; Daghofer2010 ; Chen2010 ; Valenzuela2010 . In this context, the anisotropic resistivity in the parent compound has often been interpreted as related to the inherently anisotropic electronic structure of the AFO phase Tanatar2010 ; Valenzuela2010 ; Yin2011 ; Sugimoto2011 . However, it has been shown later that an annealing process makes the resistivity of BaFe2As2 much less anisotropic Nakajima2011 ; Ishida2011 , and robust anisotropy shows up in the optical spectrum Nakajima2011 .
With Co doping, the transition from the AFO to the PT phase is suppressed. Despite the suppression of the AFO order, the anisotropy in the in-plane resistivity is enhanced. Therefore, the origin of the resistivity anisotropy is not trivial, and the effect of the Co doping should be re-examined from a viewpoint different from simply carrier doping.
In this letter, we present the optical spectrum measured on detwinned single crystals of underdoped Ba(Fe1-xCox)2As2 (, 0.02, and 0.04). As previously reported, remarkable anisotropy is observed in the optical conductivity spectrum of BaFe2As2 persisting up to 17000 cm-1 ( 2 eV), while anisotropy in the dc () resistivity is hidden by an isotropic Drude component at low temperatures Nakajima2011 . We show that, whereas the anisotropy in the high-energy optical conductivity decreases with Co doping, it shows up in the width of the Drude component, which increases as doping proceeds. This gives evidence that a doped Co atom forms an impurity state which anisotropically scatters carriers. We also observe striking anisotropy in the intensity of a particular optical phonon mode at 257 cm-1 in the AFO phase. The phonon anisotropy weakens with Co doping, associated with the suppression of the AFO order.
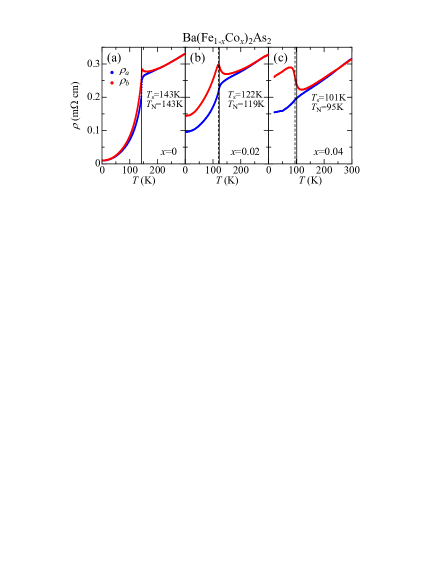
Single crystals of Ba(Fe1-xCox)2As2 (, 0.02, and 0.04) were grown and post-annealed according to the method described in Refs. Nakajima2010, ; Nakajima2011, . The structural (magnetic) transition temperatures, (), determined from the resistivity curve of free-standing twinned samples are 143 (143) K, 122 (119) K, and 101 (95) K for , 0.02, and 0.04, respectively Chu2010 ; Ishida . To remove twinned domains, we applied uniaxial compressive pressure of approximately 50 MPa. The anisotropy in resistivity becomes maximal at this pressure and ceases to increase with further application of pressure. Optical reflectivity was measured with the - and -axis polarized light in the energy range of 50–40000 cm-1 using a Fourier-transform-type infrared spectrometer (Bruker IFS113v) and a grating monochromator (JASCO CT-25C). The optical conductivity was derived from the Kramers-Kronig transformation of the reflectivity spectrum. In the higher-energy region, we used the spectrum of BaFe2As2 measured using vacuum ultraviolet synchrotron radiation (Supporting Information in Ref. Nakajima2011, ). The Hagen-Rubens and/or Drude-Lorentz formula was used for the low-energy extrapolation in order to smoothly connect to the spectrum in the measured region and to fit the measured resistivity value at .
Figures 1(a)-(c) show temperature () dependence of resistivity along the and axis ( and ) for the three compositions of annealed Ba(Fe1-xCox)2As2. Solid and broken vertical lines indicate and , respectively. For all the compositions, near the transition temperature, jumps up, whereas drops rapidly, and then both decrease with lowering temperature in a similar manner. The anisotropy is seen at temperatures above . Note that, the resistivity of undoped BaFe2As2 is nearly isotropic at low temperatures. With Co doping, anisotropy shows up predominantly in the residual-resistivity (RR) component. The RR in either direction increases roughly proportional to the Co content , indicating that the introduced Co atom anisotropically scatters carriers as an elastic scattering center.
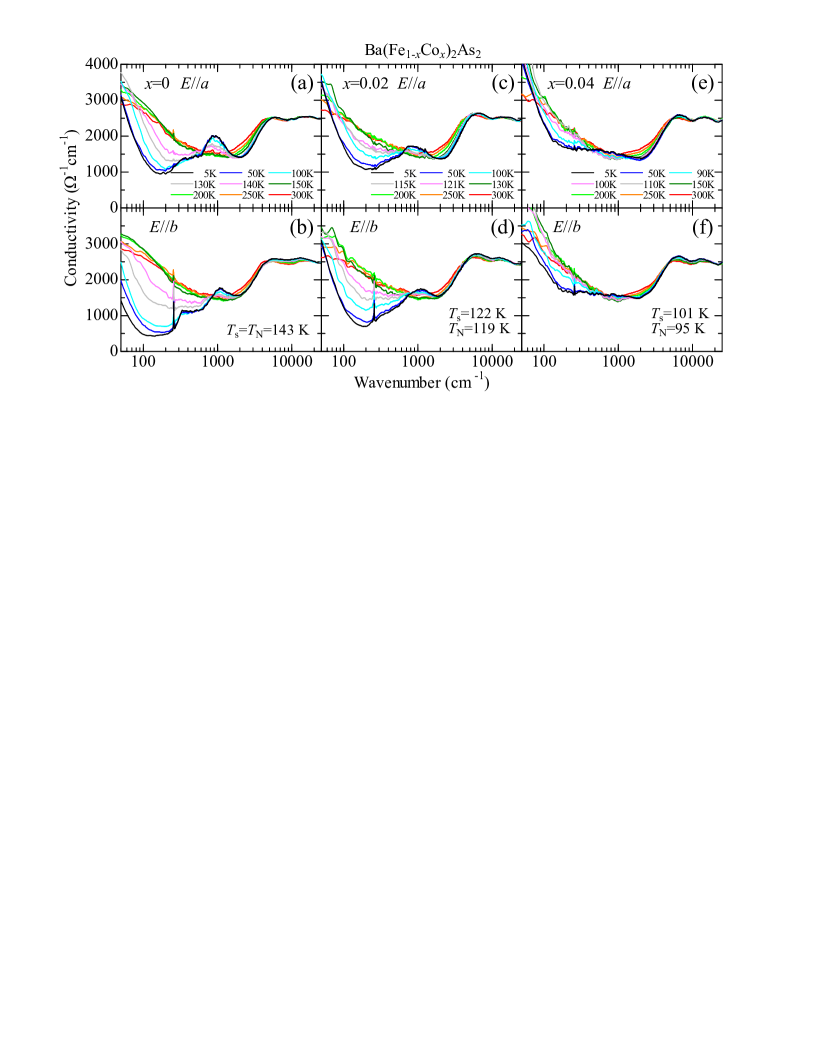
Figures 2(a) and 2(b) display the evolution of the optical conductivity spectra of BaFe2As2 for the - and -axis direction ( and ), respectively. Above , the conductivity shows a peak at and a long tail extending to a higher-energy region in which interband transitions dominate. No discernible anisotropy is observed between the - and -axis conductivity in the PT phase. Once temperature decreases below = 143 K, the spectrum exhibits a gap (pseudogap) feature associated with the development of the AFO order — the low-energy conductivity is suppressed and transferred to a higher-energy region. The gap behavior is observed in both the - and -axis spectra, but the energy scale is different. The -axis gap is larger than the -axis one, and hence the low-energy conductivity is suppressed more deeply in the direction. The different gap-energy scale between the and direction is responsible for the anisotropy in the optical conductivity Nakajima2011 .
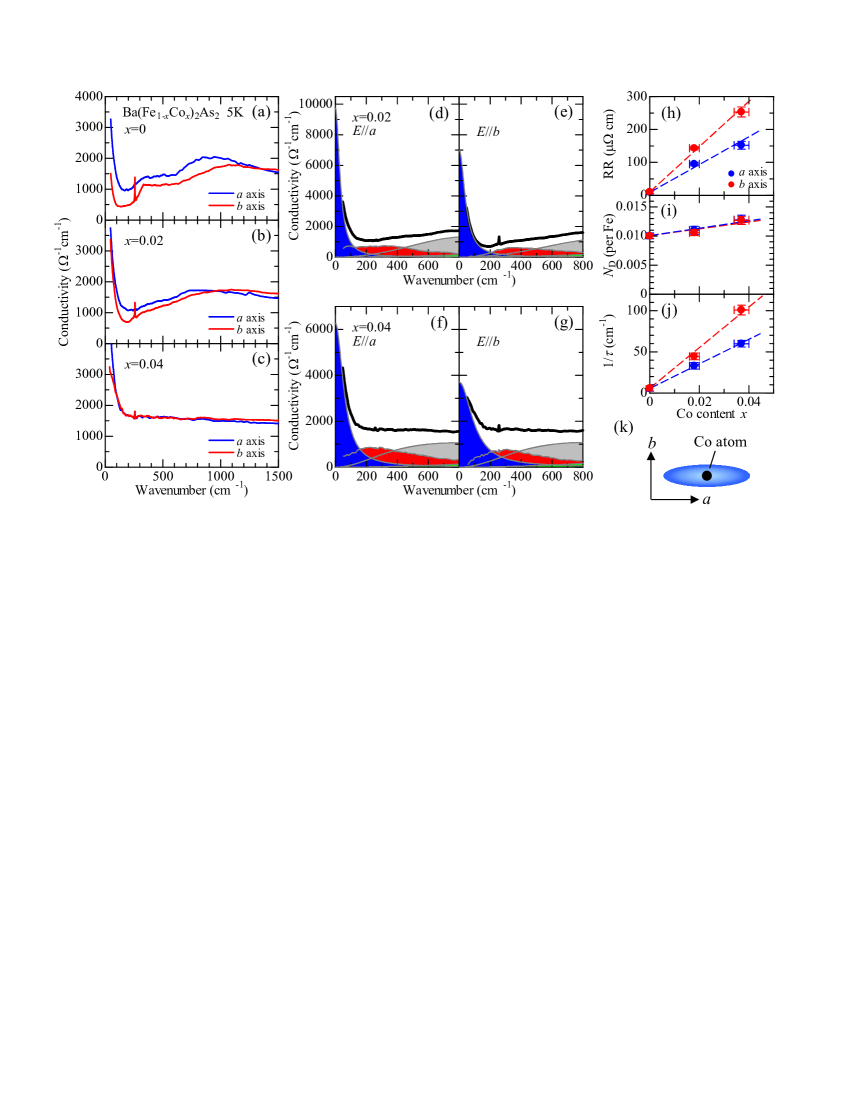
The evolution of the conductivity spectrum of the Co-doped compounds is similar to that of BaFe2As2 (Figs. 2(c)-(f)). As in the case of , the gap feature becomes apparent only below (see the spectrum colored in pink). The Co doping makes the gap feature less clear and the gap energy scale smaller. Figures 3(a)-(c) show the anisotropy in the low-energy conductivity at K. For , is higher than below 1350 cm-1. Above 1350 cm-1, the anisotropy is reversed and persists up to 17000 cm-1 ( 2 eV) Nakajima2011 . Almost isotropic resistivity at low temperatures stems from the isotropic and sharp Drude component showing extremely high conductivity peak. With doping (), the energy where the conductivity anisotropy is reversed decreases, and the magnitude of anisotropy in conductivity becomes smaller. For , the anisotropy in the optical conductivity is considerably diminished. This is in sharp contrast with the dc resistivity which becomes more anisotropic with doping.
Here, we consider the origin of the resistivity anisotropy for the Co-doped compounds based on the optical conductivity spectrum. In the AFO phase, and show almost the same dependence, so the anisotropy in resistivity is attributed to the anisotropy in the -independent residual component (Fig. 3(h)). Then, either the effective mass of carriers () and/or the carrier scattering time () appearing in the Drude formula, , should be anisotropic. An advantage of the optical spectrum is that one can estimate and separately by isolating a Drude component from the conductivity spectrum, the weight (area) and the width of which correspond to and , respectively. We decompose the spectra for Co-doped compounds (Figs. 3(d)–(g)), as we did for BaFe2As2 in Ref. Nakajima2011, . Since the gap feature, in particular the shoulder structure in and the cusp one in at 350 cm-1 for BaFe2As2, becomes smeared with Co doping, we fit the Drude and the higher-energy component (in blue and gray, respectively), and the rest is shown in red. Note that each component smoothly evolves with increasing . The estimated Drude weight () and the width () are plotted against the Co content in Figs. 3(i) and 3(j). shows no significant anisotropy, and hence is nearly isotropic. This is consistent with the direct observation of almost isotropic Fermi-surface pockets by ARPES Yi2011 and quantum oscillation Terashima2011 . On the other hand, the Drude width becomes anisotropic upon Co doping, and the anisotropy in increases in proportion to the Co content. Therefore, the resistivity anisotropy originates from the anisotropy in the elastic carrier scattering from dopant Co atoms.
A question is what makes Co atoms anisotropic scattering centers. We speculate that a Co atom polarizes its electronic surroundings anisotropically, as schematically sketched in Fig. 3(k), and thereby forms an unique impurity potential with anisotropic scattering cross section. This speculation is supported by the result of scanning tunneling spectroscopy measurements Allan . It is also suggested theoretically that local orbital order oriented in the axis is formed around an impurity Kontani2012 .
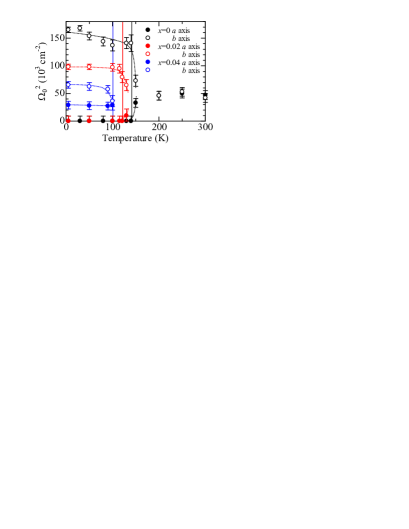
For BaFe2As2, the sharp peak centered at 257 cm-1 characterizes in the AFO phase. This peak is assigned to be an optical phonon mode corresponding to the in-plane relative displacements of Fe and As atoms Akrap2009 ; Schafgans2011 . In Fig. 4, we plot the intensity of the phonon mode as a function of temperature. It is observed in both and in the PT phase, but, in the AFO phase, its intensity is enhanced in , while reduced in to an indiscernible level Nakajima2011 . Such striking anisotropy in the phonon intensity strongly suggests that this lattice vibration induces an additional polarization field in the AFO state. The induced polarization would almost cancel out the dipole field associated with this optical phonon in the -axis direction, whereas it would enhance in the -axis direction. Exactly the same behavior is seen in the spectra for (Figs. 2(c) and 2(d)), but the -axis peak intensity is lower than that for the parent compound. For , the -axis phonon intensity further weakens, and the phonon mode is observed even in in the AFO phase. The result indicates that the phonon-induced anisotropic electronic environment weakens associated with the weakening of the AFO order by Co doping.
The anisotropy of the optical phonon mode together with the anisotropic scattering by dopant Co atoms gives evidence of the unique anisotropic state in the AFO phase highly polarizable in response to static impurities and dynamical lattice distortions. It is highly probable that the stripe antiferromagnetic order and the orthorhombic lattice distortion alone are difficult to produce such anisotropy. In the present optical spectra of the Co-doped compounds, the gap feature becomes apparent at a temperature between and (121 K and 100 K for and 0.04, respectively). More clearly, Dong et al. reported the result for NdFeAsO (=150 K and =140 K), indicating that the gap opens in the spectrum at 142 K above the AFO ordering temperature Dong2010 . This gives support for substantial role played by orbital degree of freedom.
An anisotropic electronic state (nematicity) associated with pseudogap is one of the hottest issues for the quest of mechanism of high- superconductivity in cuprates Fradkin2010 . In this state, a fourfold symmetry in the underlying lattice is retained, but the electron system spontaneously forms an anisotropic state with lower symmetry. For Ba(Fe1-xCox)2As2, the resistivity of detwinned single crystals shows an appreciable anisotropy in the tetragonal phase up to a temperature well above ( 170 K for and 0.04 and 200 K for ). Spectroscopic probes, such as ARPES Yi2011 , X-ray linear dichroism Kim2011 and optical spectroscopy Dusza2011 , also observed the anisotropy at temperatures above . A question is whether these experimental results point toward a nematic electronic state. In our previous study of annealed BaFe2As2 with =143 K, the optical conductivity spectra showed no appreciable anisotropy at 150 K Nakajima2011 . The applied unidirectional pressure was 50 MPa larger than that used by Chu et al. Chu2010 , but the spectrum at 150 K was nearly isotropic, indicating that the applied pressure did not enhance the anisotropy or extend the anisotropic region above . Although the non-equivalence between 3dxz and 3dyz orbitals is observed above in the spectroscopic measurements on BaFe2As2 Yi2011 ; Kim2011 , the observed temperature is around 150 K, which is just above of the present high-quality crystal. In fact, these measurements were done on as-grown crystals, which show sizable resistivity anisotropy at temperatures well above . In the light of our experimental results Ishida , as-grown crystals contain fairly large amount of impurities and/or lattice defects, which would broaden the transition or make distributed over some temperature range. Thus, it is likely that the observed anisotropy above is extrinsic in origin and there is no need to explain in terms of nematicity.
In summary, we have revealed the highly polarizable anisotropic electronic state realized in the AFO phase from the in-plane optical spectra of detwinned Ba(Fe1-xCox)2As2. Upon Co doping, the anisotropy in the finite-energy conductivity decreases as a result of the weakening of the order, in contrast to the resistivity anisotropy becoming sizable. The resistivity anisotropy results from the doped Co atom anisotropically polarizing its surroundings and working as an anisotropic scatterer in the AFO phase. The anomalous anisotropy in the specific optical phonon mode at 257 cm-1 also indicates that dynamical electronic polarization is induced by this lattice vibration. These results are suggestive of involvement of the orbital degree of freedom in the formation of the AFO order.
Acknowledgements.
M.N. and S.I. thank the Japan Society for the Promotion of Science (JSPS) for the financial support. This work was supported by the Japan-China-Korea A3 Foresight Program and Grant-in-Aid for JSPS Fellows from JSPS, Grant-in-Aid for Scientific Research from JSPS and the Ministry of Education, Culture, Sports, Science, and Technology, Japan, and Strategic International Collaborative Research Program (SICORP) from Japan Science and Technology Agency.References
- (1) C. de la Cruz et al., Nature 453, 899 (2008).
- (2) M. Rotter et al., Phys. Rev. B 78, 020503(R) (2008).
- (3) Q. Huang et al., Phys. Rev. Lett. 101, 257003 (2008).
- (4) I. R. Fisher, L. Degiorgi, and Z. X. Shen, Rep. Prog. Phys. 74 124506 (2011), and references therein.
- (5) M. A. Tanatar et al., Phys. Rev. B 81, 184508 (2010).
- (6) J. H. Chu et al., Science 329, 824 (2010).
- (7) J. Zhao et al., Nature Phys. 5, 555 (2009).
- (8) T.-M. Chuang et al., Science 327, 181 (2010).
- (9) T. Shimojima et al., Phys. Rev. Lett. 104, 057002 (2010).
- (10) M. Yi et al., Proc. Natl. Acad. Sci. U.S.A. 108, 6878 (2011).
- (11) C. Fang, H. Yao, W. F. Tsai, J. P. Hu, and S. A. Kivelson, Phys. Rev. B 77, 224509 (2008).
- (12) C. Xu, M. Muller, and S. Sachdev, Phys. Rev. B 78, 020501(R) (2008).
- (13) R. M. Fernandes et al., Phys. Rev. Lett. 105, 157003 (2010).
- (14) C. C. Lee, W. G. Yin, and W. Ku, Phys. Rev. Lett. 103, 267001 (2009).
- (15) F. Krüger, S. Kumar, J. Zaanen, and J. van den Brink, Phys. Rev. B 79, 054504 (2009).
- (16) Z. P. Yin and W. E. Pickett, Phys. Rev. B 81, 174534 (2010).
- (17) M. Daghofer et al., Phys. Rev. B 81, 180514(R) (2010).
- (18) C.-C. Chen et al., Phys. Rev. B 82, 100504(R) (2010).
- (19) B. Valenzuela, E. Bascones, and M. J. Calderón, Phys. Rev. Lett. 105, 207202 (2010).
- (20) Z. P. Yin, K. Haule, and G. Kotliar, Nature Phys. 7, 294 (2011).
- (21) K. Sugimoto, E. Kaneshita, and T. Tohyama, J. Phys. Soc. Jpn. 80, 033706 (2011).
- (22) M. Nakajima et al., Proc. Natl. Acad. Sci. U.S.A. 108, 12238 (2011).
- (23) S. Ishida et al., Phys. Rev. B 84, 184514 (2011).
- (24) M. Nakajima et al., Phys. Rev. B 81, 104528 (2010).
- (25) S. Ishida et al. (in preparation).
- (26) T. Terashima et al., Phys. Rev. Lett. 107, 176402 (2011).
- (27) M. P. Allan et al. (unpublished).
- (28) H. Kontani, Y. Inoue, T. Saito, Y. Yamakawa, and S. Onari, Solid State Commun. 152, 718 (2012).
- (29) A. Akrap et al., Phys. Rev. B 80, 180502(R) (2009).
- (30) A. A. Schafgans et al., Phys. Rev. B 84, 052501 (2011).
- (31) T. Dong et al., Phys. Rev. B 82, 054522 (2010).
- (32) E. Fradkin, S. A. Kivelson, M. J. Lawler, J. P. Eisenstein, and A. P. Mackenzie, Annu. Rev. Condens. Matter Phys. 1, 153 (2010).
- (33) Y. K. Kim et al., arXiv:1112.2243 (unpublished).
- (34) A. Dusza et al., EPL 93, 37002 (2011).