A Universal Neutral Gas Profile for Nearby Disk Galaxies
Abstract
Based on sensitive CO measurements from HERACLES and H I data from THINGS, we show that the azimuthally averaged radial distribution of the neutral gas surface density (+ ) in 33 nearby spiral galaxies exhibits a well-constrained universal exponential distribution beyond (inside of which the scatter is large) with less than a factor of two scatter out to two optical radii r25. Scaling the radius to r25 and the total gas surface density to the surface density at the transition radius, i.e., where and are equal, as well as removing galaxies that are interacting with their environment, yields a tightly constrained exponential fit with average scale length 0.610.06 r25. In this case, the scatter reduces to less than 40% across the optical disks (and remains below a factor of two at larger radii). We show that the tight exponential distribution of neutral gas implies that the total neutral gas mass of nearby disk galaxies depends primarily on the size of the stellar disk (influenced to some degree by the great variability of inside ). The derived prescription predicts the total gas mass in our sub-sample of 17 non-interacting disk galaxies to within a factor of two. Given the short timescale over which star formation depletes the H2 content of these galaxies and the large range of r25 in our sample, there appears to be some mechanism leading to these largely self-similar radial gas distributions in nearby disk galaxies.
Subject headings:
Galaxies:ISM — Galaxies:Evolution1. Introduction
Scaling relations are important because they are often thought to be manifestations of some underlying fundamental physical processes. They also make it possible to determine properties of a system with incomplete measurements to within the scatter of the scaling. The total neutral gas content of galaxies has long defied such characterizations because of the wide diversity of previously observed gas surface density distributions (see, e.g., Helfer et al., 2003). This was at least partly due to the lack of comprehensive, resolved, extended and deep observations of atomic (H I) and molecular gas (H2) across the disks of a significant sample of galaxies. This limitation has been overcome by the availability of new radio surveys providing sensitive H I and CO (the standard tracer for H2) radio data, tracing the gas content of many nearby galaxies out to large galactocentric radii (THINGS, HERACLES, Walter et al., 2008; Leroy et al., 2009).
With these data sets in hand, we can now re-assess the azimuthally averaged gas distributions (radial profiles) in nearby spiral galaxies. Both HI and CO profiles tend to show quite distinct behavior: the HI surface density distributions are often depressed in the centers, increasing in the inner disk and slowly declining in the outer regions. Furthermore, the surface density in the outer regions can be affected by environmental factors such as interaction with companions or truncation due to the ram pressure stripping by the hot gas in galaxy clusters (Cayatte et al., 1994). As for the molecular gas, it tends to fall off much more sharply than the HI in an approximately exponential fashion that varies from galaxy to galaxy (Young & Scoville, 1982; Regan et al., 2001; Leroy et al., 2008; Bigiel et al., 2008).
We show in this paper, however, that when the totality of the neutral (i.e., atomic and molecular) gas in normal spirals is considered based on the data from these new surveys, and the profiles are properly scaled, the gas exhibits a radial profile shape that is remarkably constant from galaxy to galaxy. The gas surface density is found to vary by no more than about a factor of two from this average profile across the optical disk and even beyond. We show that the scatter reduces even further when we eliminate galaxies that are interacting with their environment.
2. Data & Methodology
In this paper we use radial profiles (i.e., azimuthal averages in tilted rings) of atomic hydrogen, , molecular hydrogen (as traced by CO emission), , and the total gas surface density =+. We derive the H2 profiles out to one and the H I and total gas profiles from the centers out to two optical radii r25, which is defined as the 25 mag arcsec-2 B-band isophote. We will refer to the regime within r25 as the optical disk.
The VLA THINGS survey (The HI Nearby Galaxy Survey, Walter et al., 2008), provides sensitive ( M⊙ pc-2 at 30 resolution), extended ( field-of-view) HI data. These data, together with new and archival data for some of the target galaxies, allow us to track the HI distribution out to with good sensitivity.
The IRAM 30m survey HERACLES provides the distribution of 12CO(2-1) emission in our sample galaxies (HERA CO Line Extragalactic Survey, Leroy et al., 2009). HERACLES provides sensitive ( M⊙ pc-2 for the most distant, face-on systems) data covering the entire optical disk out to r25. The quoted H2 surface densities in this paper include a Galactic CO-to-H2 conversion factor and a CO line ratio (see Leroy et al., 2012). Because H I can be observed out to much larger radii for individual lines-of-sight, Schruba et al. (2011) used the velocity information from the H I as a prior to stack individual CO spectra. This technique allows one to probe down to M⊙ pc-2 and thus to derive radial CO profiles out to the edge of the optical disk (). This represents a significant improvement over previous studies and we adopt their radial H2 profiles derived from this approach.
We thus focus our analysis on the data and galaxy sample presented in Schruba et al. (2011), which consists of 33 nearby, star-forming disk galaxies (excluding edge-on, low-mass and low-metallicity systems). All quoted surface densities in this paper include the contribution from helium (a factor of 1.36) and are corrected for inclination. We refer the reader to Schruba et al. (2011) for further details and references regarding sample selection and properties, H I and CO datasets, the stacking technique for the CO data and the conversion of line intensities to surface densities.
We stress that it is the combination of such deep, wide-field CO data, the stacking technique as well as the sensitive HI data, which permits to derive unprecedentedly accurate radial distributions of the atomic, molecular and total gas across galaxy disks. These radial profiles are shown for each galaxy in the galaxy atlas in the Appendix of Schruba et al. (2011) (note, however, that we extend their H I profiles out to 2r25).
We also include radial gas profiles for the Milky Way for comparison. We adopt the H I and H2 profiles from Dame (1993)111We use their H I profile based on the Kulkarni et al. (1982, KBH) rotation curve and the H2 profile following Digel (1991) at large radii., adjust the latter to match our adopted value for and include the contribution from helium. We assume kpc, based on the observation that H II regions, planetary nebulae and carbon stars seem to disappear at about 2 R☉ in the Milky Way (Fich & Blitz, 1984; Schneider & Terzian, 1983; Schechter et al., 1988).
3. Results
3.1. Unscaled Radial Profiles
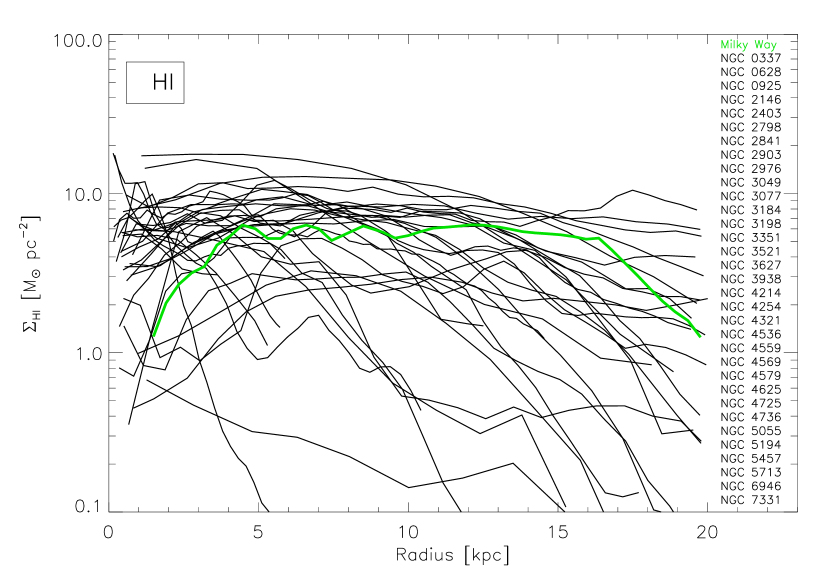
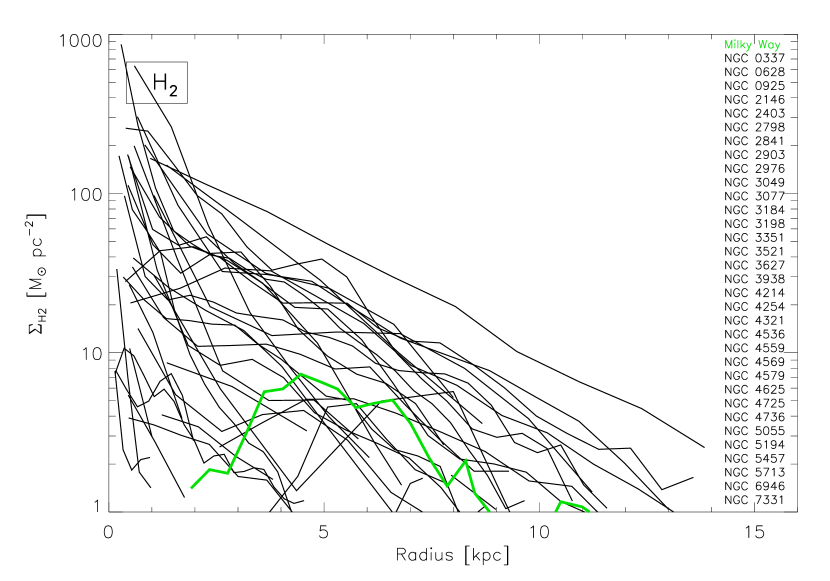
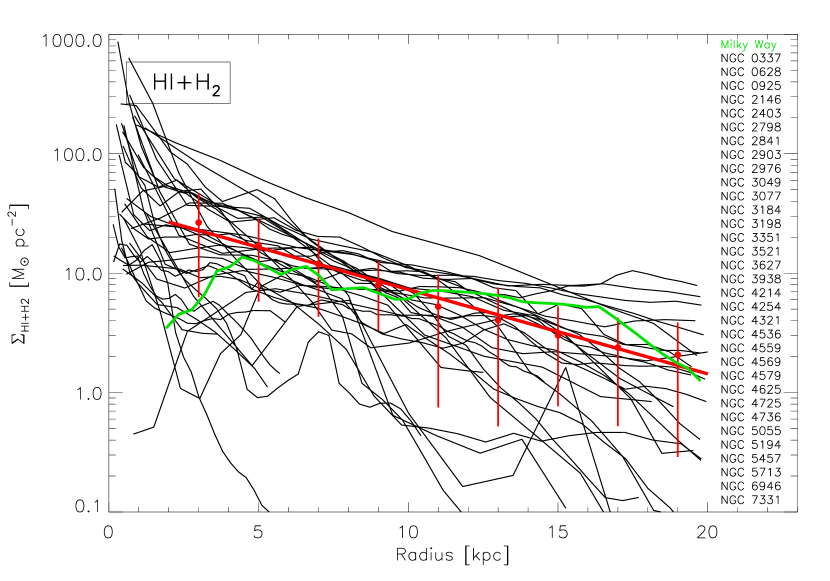
Figure 1 shows the H I, H2 and total gas surface density profiles of the 33 sample galaxies and the Milky Way. Radially slightly less extended versions of these profiles as well as the H I and CO maps they are derived from are shown for each of our sample galaxies in Schruba et al. (2011). We refer the reader to the Appendix of that paper to match individual galaxies to particular profiles.
The top panel of Figure 1 shows the H I profiles. They are generally relatively flat and show a great deal of scatter with little apparent regularity except for a concentration just below 10 M⊙ pc-2 for radii kpc. This is the maximum H I surface density (for near solar-metallicity galaxies) before the interstellar medium (ISM) becomes primarily molecular (Martin & Kennicutt, 2001; Wong & Blitz, 2002; Leroy et al., 2008; Bigiel et al., 2008). Note that the profiles fill almost all of the “phase space” between 1 and 10 M⊙ pc-2 at all radii. Some profiles are truncated and decrease steeply: these are often interacting systems or cluster members. In the inner parts, many galaxies show a more or less pronounced depression. These central “H I holes” are usually regions where the ISM is predominantly molecular (the / ratio increases roughly exponentially with decreasing radius; e.g., Leroy et al., 2008; Bigiel et al., 2008). The Milky Way H I profile agrees well with the overall trend: H I-deficient in the center and relatively flat throughout at M⊙ pc-2.
Almost all H2 profiles in the middle panel show an exponential-like decline. The scale length, however, is different from galaxy-to-galaxy, i.e. some profiles are steeper than others. Like the H I profiles, the H2 profiles fill almost all of the “phase space” up to the most molecule-rich galaxy. In their inner parts, many galaxies deviate from this exponential trend and the H2 surface density rises much more steeply (see also Regan et al., 2001). Even when averaged over many square kpc, some galaxies reach surface densities of many 100 M⊙ pc-2 in the inner parts, quite similar to what is observed in starburst galaxies (e.g., Kennicutt, 1998). The Milky Way profile also declines roughly exponentially from kpc on outward, but shows a depression at smaller radii. Where it declines exponentially, it does so with a scale length typical of many of the other galaxies.
The plot of the total gas profiles is given in the bottom panel and shows that the combination of the relatively flat H I profiles (over large parts of the radius range considered here) and the exponential H2 profiles leads to somewhat more coherent total gas profiles for many of the galaxies than do either the H I or H2 profiles alone. The total gas profiles cluster at surface densities between a few and a few times 10 M⊙ pc-2 between kpc. The Milky Way profile falls quite in the middle of the bulk of the profiles and thus its averaged gas distribution matches that of most of the other galaxies well.
We also show mean data values (red points) and associated 1 RMS scatter of the profiles in 2 kpc wide bins (note that the means are plotted in the middle of these bins). We exclude the central 2 kpc for the binning where the profiles rise much more steeply than further out. The relative scatter ranges from to within the optical disks, i.e., for , and remains within a factor of two even at large radii where the profiles begin to flare significantly.
The red line shows an ordinary-least-squares (OLS) fit to the means and yields an average scale length of 6.1 kpc with standard deviation 0.3 kpc. Even though the fit is relatively well constrained (reflected by the small standard deviation), we estimate the impact of several other factors on the fit result by doing the following: 1) we add noise to each data point (mean) and re-fit, 2) we bootstrap (sampling profiles from the ensemble allowing repetition), 3) we vary the radius range to fit over and 4) we vary the bin size we use to derive the means. The first method is an uncertainty estimate based on the error on the mean in each bin, the second addresses how much individual profiles drive the fit and the last two approaches probe the impact of our specific choices for radius range and bin size. Adding noise as well as varying radius range and bin size lead to an uncertainty 0.5 kpc. Bootstrapping leads to an uncertainty of kpc, which we adopt as our uncertainty on the fit so that we quote the mean scale length of the unscaled total gas profiles as kpc. We will show in the following that the agreement among these profiles can be improved further by scaling both axes the right way and by focusing on non-interacting galaxies.
3.2. Scaled Radial Profiles
By measuring the radius in physical units (kpc), intrinsic differences in the size of the galaxies will lead to scatter in the profile distribution. This can be accounted for if the x-axis (radius) is normalized by the optical radius (r25) of the galaxy. This scaling reduces the scatter to across the optical disk (beyond which it reaches up to 100% at large radii, similar to the unscaled profiles). This is notably less than the in the unscaled case above.
Blitz & Rosolowsky (2004) noted, that there is a natural scale to the gas in normal spirals if the conversion from H I to H2 is governed primarily by the midplane hydrostatic pressure in galactic disks. In that case, the location where the gas in the disk goes from being primarily molecular in the inner regions, to where it becomes primarily atomic in the outer regions, should occur at a constant stellar surface density. They showed that for the 28 galaxies they analyzed, this constancy is good to about 40% and has a value of 120 M☉ pc-2. Leroy et al. (2008) reached the same conclusion (although they derived a stellar surface density of M☉ pc-2), using a combination of HERACLES, THINGS and BIMA SONG (BIMA Survey of Nearby Galaxies, Helfer et al., 2003) data for 23 nearby galaxies. We determine this transition radius (i.e., where ) directly for each galaxy from the radial profiles (typically the transition occurs at M☉ pc-2).
In Figure 2 we show the profiles one obtains if both scalings are applied: the radius is normalized to the size of the optical disk (x-axis) and the gas surface density is scaled to the value of at the transition radius (y-axis). For six galaxies the transition radius cannot be readily determined: the ISM in these galaxies is either entirely dominated by H I (NGC 337, NGC 925, NGC 4214, NGC 4559) or entirely H2 dominated (NGC 4569, NGC 2798). We will not include these galaxies in this plot and the following.
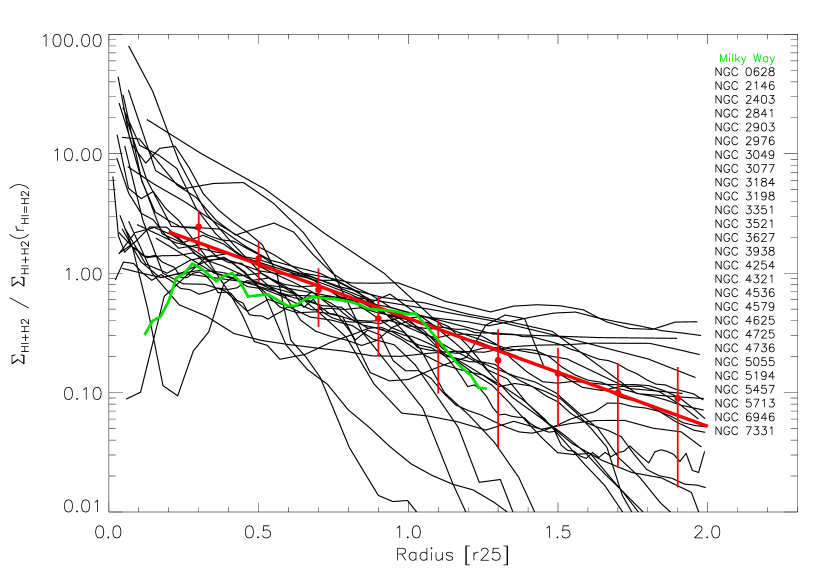
The red points in Figure 2 show mean values and 1 scatter in 0.2r25-wide bins. The scatter increases from to at large radii where the profiles begin to flare. Across the optical disks the scatter is between and . While the normalization of the x-axis has a bigger impact reducing the scatter, the additional scaling of the surface density reduces the scatter further to or less within the optical disks and to less than a factor of two even at large radii. The minimum scatter of is almost a factor of two improvement compared to the minimum scatter of for the unscaled case. This matches the visual impression that the scaled profiles in Figure 2 show a remarkably tight distribution.
The red line shows the OLS fit to the means and yields an average scale length of r25, where the error is the standard deviation. Following the approach described in Section 3.1, we estimate the uncertainty of the fitted scale length in several ways. We find that bootstrapping and varying the radius range dominate the uncertainties and we quote our final fit result as r25.
The gas distribution, particularly in the outer parts, can be significantly affected by interactions with other galaxies in groups or clusters or by ram pressure stripping from a hot intracluster medium. Oftentimes these interactions result in truncated H I profiles, driving the scatter in the profile ensemble.
In addition to the six galaxies with uncertain transition radii above, we further eliminate 10 galaxies that exhibit evidence for interactions with their environments. These are galaxies that show signs of strong tidal interactions in their HI distributions and those which are members of the Virgo or Coma clusters subject to ram-pressure stripping. These galaxies are: NGC 2146, NGC 2976, NGC 3077, NGC 3627, NGC 4254, NGC 4321, NGC 4579, NGC 4725, NGC 5194, NGC 5713 (note that NGC 2798 and NGC 4569 would be part of this list too, but are already excluded based on the unclear transition radius in these galaxies).
Figure 3 shows the plot that results if both axes are scaled as in Figure 2, but after removing the interacting galaxies. For the remaining 17 galaxies, the scatter within the optical disks reduces to and remains between beyond r25. The Milky Way profile is a good match to the overall trend. The ensemble constitutes a tight, well-defined exponential distribution across the optical disk with deviations in the centers and flaring in the outer disks. The fit yields a scale length of r25 and we quote our final result based on bootstrapping as the dominant source of uncertainty as r25.
4. Discussion
Figure 3 shows that galaxies not interacting with their environment exhibit a tight exponential distribution of their total gas content when the radius is scaled to the optical radius and the surface density of the gas is scaled to the surface density of the gas at the transition radius. The scaling relation for disk galaxies we derive is:
| (1) |
where is the surface density of the gas at the transition radius. The factors and are obtained from the y-intercept and slope of the exponential fit in Figure 3. This implies that for these disk galaxies the total mass of neutral gas, , is given by
| (2) |
where the factor X depends on how far out from the center one integrates Equation 1. Integrating out to the optical radius r25 yields , out to 2r25 yields and integrating to infinity yields .
Equation 2 shows that for any given maximum radius, depends only on and . does not vary a great deal from galaxy to galaxy and has a typical value of about 14 M⊙ pc-2 (also compare Leroy et al., 2008; Bigiel et al., 2008). Thus, depends primarily on , which varies by two orders of magnitude for the galaxies plotted.
This leads to the surprising result that the mass of neutral hydrogen gas depends mostly on the size of the stellar disk and that the gas arranges itself somehow into a distribution that is self-similar among galaxies. The result also implies that except for the region of a galaxy at , which is highly variable, the total neutral gas mass of a disk galaxy at can be estimated if r25, i.e., the extent of the stellar disk, is known. The variable inner regions of galaxies, are, however, quite small, and despite either depressions or large excesses of the molecular gas in these regions, they typically only account for a small fraction of the total neutral gas mass ( on average in our sample).

We examine this conclusion in Figure 4, which shows the total gas mass of the galaxies in Figure 3 as measured in the respective H I and H2 intensity maps, compared to the predictions made using Equation 2 (where the integration is carried out to 2r25). We estimate the uncertainty on the total gas masses derived from the intensity maps (x-axis) from the calibration uncertainties of the THINGS and HERACLES data ( and , respectively, Walter et al., 2008; Leroy et al., 2009). We thus adopt as the overall uncertainty. For the masses derived from the fit (y-axis), we estimate the uncertainty from error propagation (from Equation 2). We take into account the uncertainties on the fit (slope and intercept), r25 (estimated from Paturel et al., 1991) and (from Leroy et al., 2008). This results in an uncertainty estimate of for the mass prediction. Both uncertainties are indicated as error bars in Figure 4.
Figure 4 shows that this equation offers a robust way to predict the total gas mass of disk galaxies to within a factor of two (indicated by the dashed lines, the solid line indicates unity). The mean ratio of predicted versus measured total gas mass is (with standard deviation ), which underlines the good correspondence between prediction and data. This close correspondence is rooted in the tightly constrained fit in Figure 3, which falls almost directly on the means in the individual radius bins.
Based on observed metallicity gradients across galaxy disks (e.g., Moustakas et al., 2010), one might speculate about a similarly radially varying CO-to-H2 conversion factor. Recent work indeed suggests that systematic variations of with radius (albeit not necessarily driven primarily by metallicity) occur in at least some of the galaxies studied in this paper: in these cases, is observed to increase with increasing radius (Sandstrom et al., in prep.). A low value for XCO in galaxy centers seems to be a more common feature (Sandstrom et al., in prep.). The former effect would lead to shallower H2 profiles , while the latter might in fact explain the observed apparent H2 excesses in galaxy centers, possibly even giving rise to truly exponential H2 profiles including the centers.
One of the implications of a universal gas profile is that there appears to be some mechanism that keeps the relationship constant in the face of star formation in these galaxies. For example, Bigiel et al. (2008); Leroy et al. (2008); Bigiel et al. (2011) show that the depletion time for the molecular gas in disk galaxies is yr. The region of Figure 3 where (roughly for ) is the region dominated by molecular gas and that gas will therefore be exhausted in about 15% of a Hubble time. In order to keep the profiles self-similar, this implies that either new gas comes from outside the disk and falls preferentially in the central regions, an unlikely occurrance, or that gas flows through the disk to make up the gas lost to star formation, which takes place preferentially within . In either case, it is difficult to understand why the total gas profiles would be so self-similar. For the infall case, one expects such infall to be sporadic, possibly occurring in the form of small galaxies merging with the bigger disk galaxies in our sample. For the inflow case, Figure 3 encompasses a variety of galaxy types and morphologies, and it is hard to see how inflow could be so closely regulated to produce the tight observed relationship.
As cosmological simulations of galaxy evolution including gas become ever more refined, it will become necessary for these simulations to reproduce the universal relationship when carried out to the present epoch. Because of the limitations in making observations of the atomic gas to higher redshift with present day instrumentation, it will be difficult in the near future to extend the work presented here to normal disk galaxies at significantly higher redshifts. It will also be a challenge to extend this work to lower metallicity systems, where CO emission becomes an increasingly poor tracer of the molecular hydrogen (e.g., Bolatto et al., 2011). On the other hand, r25 can be determined in many galaxies to higher redshifts and Equation 2 could be used to estimate Mgas. As it becomes possible to measure total neutral gas masses to higher redshifts with ALMA, the JVLA, and Arecibo, direct comparisons of the predicted and measured total mass of neutral gas can be extended both to higher redshift and to a larger sample of local galaxies providing good tests of the universality of the neutral gas profile presented in this paper.
The universal gas profile we have described seems to be a fundamental property of normal disk galaxies at . We have, however, only probed galaxies of near solar metallicity and none of the galaxies in our final sample are dwarfs. Also, Young et al. (2011) and Serra et al. (2012) have shown recently that a surprisingly large fraction of early type galaxies, i.e., ellipticals and lenticulars, contain large amounts of atomic and molecular gas. Whether these galaxies obey the same universal gas profile is still to be determined.
References
- Bigiel et al. (2008) Bigiel, F., Leroy, A., Walter, F., Brinks, E., de Blok, W. J. G., Madore, B., & Thornley, M. D. 2008, AJ, 136, 2846
- Bigiel et al. (2011) Bigiel, F., Leroy, A. K., Walter, F., et al. 2011, ApJ, 730, L13
- Blitz & Rosolowsky (2004) Blitz, L., & Rosolowsky, E. 2004, ApJ, 612, L29
- Bolatto et al. (2011) Bolatto, A. D., Leroy, A. K., Jameson, K., et al. 2011, ApJ, 741, 12
- Cayatte et al. (1994) Cayatte, V., Kotanyi, C., Balkowski, C., & van Gorkom, J. H. 1994, AJ, 107, 1003
- Dame (1993) Dame, T. M. 1993, “Back to the Galaxy”, AIP Conference Proceedings, 278, 267
- Digel (1991) Digel, S. W. 1991, Ph.D. Thesis, Harvard University
- Fich & Blitz (1984) Fich, M., & Blitz, L. 1984, ApJ, 279, 125
- Helfer et al. (2003) Helfer, T. T., Thornley, M. D., Regan, M. W., et al. 2003, ApJS, 145, 259
- Kennicutt (1998) Kennicutt, R. C., Jr. 1998, ApJ, 498, 541
- Kulkarni et al. (1982) Kulkarni, S. R., Heiles, C., & Blitz, L. 1982, ApJ, 259, L63
- Leroy et al. (2008) Leroy, A. K., Walter, F., Brinks, E., et al. 2008, AJ, 136, 2782
- Leroy et al. (2009) Leroy, A. K., Walter, F., Bigiel, F., et al. 2009, AJ, 137, 4670
- Leroy et al. (2012) Leroy, A. K., Bigiel, F., de Blok, W. J. G., et al. 2012, AJ, 144, 3
- Martin & Kennicutt (2001) Martin, C. L., & Kennicutt, R. C., Jr. 2001, ApJ, 555, 301
- Moustakas et al. (2010) Moustakas, J., Kennicutt, R. C., Jr., Tremonti, C. A., et al. 2010, ApJS, 190, 233
- Paturel et al. (1991) Paturel, G., Garcia, A. M., Fouque, P., & Buta, R. 1991, A&A, 243, 319
- Regan et al. (2001) Regan, M. W., Thornley, M. D., Helfer, T. T., et al. 2001, ApJ, 561, 218
- Schechter et al. (1988) Schechter, P. L., Aaronson, M., Cook, K. H., & Blanco, V. M. 1988, The Outer Galaxy, 306, 31
- Schneider & Terzian (1983) Schneider, S. E., & Terzian, Y. 1983, ApJ, 274, L61
- Schruba et al. (2011) Schruba, A., Leroy, A. K., Walter, F., et al. 2011, AJ, 142, 37
- Serra et al. (2012) Serra, P., Oosterloo, T., Morganti, R., et al. 2012, MNRAS, 422, 1835
- Walter et al. (2008) Walter, F., Brinks, E., de Blok, W. J. G., et al. 2008, AJ, 136, 2563
- Wong & Blitz (2002) Wong, T., & Blitz, L. 2002, ApJ, 569, 157
- Young & Scoville (1982) Young, J. S., & Scoville, N. 1982, ApJ, 258, 467
- Young et al. (2011) Young, L. M., Bureau, M., Davis, T. A., et al. 2011, MNRAS, 414, 940