Density functional theory study of phase stability, vibrational and electronic properties of Mo3Al2C
Abstract
Based on density functional theory the noncentrosymmetric superconductor Mo3Al2C in its well established -Mn type (P4132) crystal structure is investigated. In particular, its thermodynamical and dynamical stabilities are studied by calculating lattice vibrations within the harmonic approximation. It is found that the fully stoichiometric compound is dynamically unstable. However, compounds with carbon vacancies, i.e., Mo3Al2C1-x, can be dynamically stabilized for vacancy concentrations . By means of a simple thermodynamical model we estimate for Mo3Al2C1-x at the experimental preparation temperatures. The influence of the carbon vacancy concentration on the electronic structure is investigated.
pacs:
63.20.D-,63.70.+h,71.15.Mb,71.20.-b,61.72.jdI Introduction
Mo3Al2C has been already synthesized in the 1960s Jeitschko et al. (1963) and subsequently classified as a superconductor.Johnston et al. (1964); Fink et al. (1965); Toth and Zbasnik (1968); Toth (1971) Recently it has attracted renewed attention,Bauer et al. (2010); Karki et al. (2010); Bonalde et al. (2011); Koyama et al. (2011); Kuo et al. (2012) because its cubic -Mn type crystal structure does not contain a center of inversion. In such noncentrosymmetric superconductors, as first discussed for CePt3Si,Bauer et al. (2004) the electron pairing process is described to be be a mixture of spin-singlet and spin-triplet states. Gor’kov and Rashba (2001); Sigrist et al. (2007) The question whether Mo3Al2C can be classified as a conventional or unconventional superconductor remains still unresolved according to very recent investigations.Bauer et al. (2010); Karki et al. (2010); Bonalde et al. (2011) In this work, we will not tackle this issue directly but will provide results of extensive density functional theory (DFT) calculations on the thermodynamical and dynamical stability as well as the electronic structure of this compound as a function of carbon content.
Mo3Al2C crystalizes in the cubic -Mn type P4132 structure containing 24 atoms in the unit cell with, namely 12 Mo, 8 Al, and 4 C atoms. The C atoms are in the center of regular Mo6 octahedrons which are tilted to each other.Jeitschko et al. (1963); Bauer et al. (2010) The comparison of our DFT structural parameters to experimental values Bauer et al. (2010) in Table 1 shows both in excellent agreement.
| exp.111experimental results from Ref. Bauer et al.,2010 | DFT222DFT calculation (present work) | |
|---|---|---|
| lattice parameter : | ||
| Mo on 12d y: | ||
| Al on 8c x: | ||
| C on 4a | ||
| crystal structure: | cubic -Mn type | |
| space group: | 213 or P4132 | |
II Computational Details
The DFT calculations were done using the Vienna ab initio simulation package (VASP) Kresse and Furthmüller (1996); Kresse and Joubert (1999) utilizing the pseudopotential construction according to the projector augmented wave method.Blöchl (1994) For the exchange-correlation functional the generalized gradient approximation as parametrized by Perdew, Burke, and Ernzerhof Perdew et al. (1996) was chosen. The potential for Mo contained 9 valence states including the 4p semicore states, whereas for Al and C three and four valence states were included, respectively. The size of the basis set was defined by an energy cutoff of 500 eV. The Brillouin-zone integration for the computation of total energies was made using the tetrahedron method with with Blöchl’s corrections Blöchl et al. (1994) based on a Monkhorst and Pack Monkhorst and Pack (1976) -point mesh, whereas for the structural relaxations and for the derivation of the force constants the first order Methfessel-Paxton smearing method Methfessel and Paxton (1989) on a -point mesh was chosen.
The vibrational properties were calculated within the harmonic approximation by making use of the direct force-constant method as implemented in our program package fPHON (full-symmetry PHON), which is based on the package PHON.Alfè (2009) The structural parameters, i.e., the volume and shape of the unit cell as well as the positions of the atoms within the unit cell, were relaxed until the residual forces were less than eV/Å. Furthermore, for a high accuracy of the phonon calculations the force constants derived from the displaced atoms were corrected by subtracting the tiny but still finite forces of the fully relaxed structures. Some of the phonon dispersions were cross checked by using density functional perturbation theory Baroni et al. (2001) (DFPT) as implemented in VASP.
III Vibrational Properties
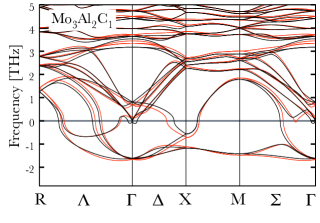
It turns out that perfectly stoichiometric Mo3Al2C is dynamically unstable. According to panel (a) of Fig. 1 optical modes with imaginary frequencies around arise. The dynamical instability seems surprising considering the well-established crystal structure of Mo3Al2C.Jeitschko et al. (1963); Johnston et al. (1964); Fink et al. (1965); Toth and Zbasnik (1968); Toth (1971); Bauer et al. (2010); Karki et al. (2010); Bonalde et al. (2011); Koyama et al. (2011); Kuo et al. (2012) One should, however, be aware that the actual carbon content is experimentally difficult to discern by X-ray diffraction because of carbons comparatively small X-ray cross sectionMcMaster et al. (1969) and therefore there exists some uncertainty with respect to carbon vacancies. In general, many carbides are prone to have vacancies on the C sublattice.
Before speculating on the physical explanation of the detected instability we undertook numerical and methodological tests. First of all, it is assured that the results are converged with respect to the number of -points. Furthermore, for deriving the force constants several atomic displacements of the atoms, i.e., were chosen and calculations without any symmetry were performed. All calculations confirm the existence of imaginary modes for Mo3Al2C. In particular, the calculation with the smallest displacement of yielded imaginary optical modes with a frequency of THz at . As a further test the DFPT Baroni et al. (2001) technique as implemented in VASP was applied also resulting in imaginary modes of THz at . From these DFPT calculations force constants have been derived and used as input for fPHON. Both, the direct force-constant method and the DFPT treatment gave very similar results for the phonon dispersions as shown in panels (a) of Fig. 1.
In order to study if another similar structure exists that is dynamically stable and energetically more favorable compared to the cubic -Mn type structure, all atoms were displaced from their equilibrium positions. In addition, a tetragonal deformation was enforced onto the unit cell. Using VASP this deformed structure was subsequently relaxed without any symmetry constrains, resulting in the well-known crystal structure described before.
| (a) | (b) |
|---|---|
 |
 |
Because the perfectly stoichiometric compound Mo3Al2C is found to be dynamically unstable, we investigated if dynamical stabilization can be achieved by vacancies, in particular by carbon vacancies.
In general, vacancies on all sublattices will stabilize the phonon dispersion, at least above a certain concentration. Vacancies on the Mo or Al sublattice are less likely to exist since they would be easily detectable, i.e., they have a comparatively large X-ray cross section.McMaster et al. (1969) Furthermore, our DFT derived vacancy formation energies in the following Section IV strongly indicate that Mo or Al vacancies are thermodynamically too costly to be formed.
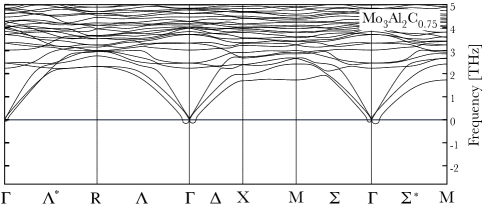
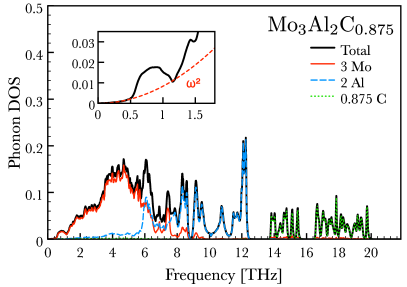
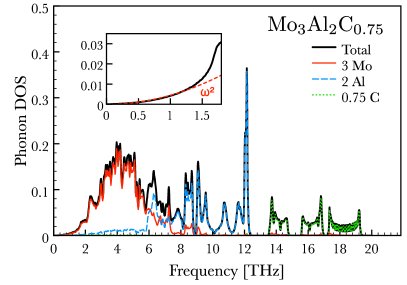
Assuming a certain carbon vacancy concentration suitable supercell calculations were done for the defect structures. Panel (b) in Fig. 1 shows the phonon dispersion for Mo3Al2C0.75, i.e., for a single carbon vacancy in the standard unit cell ( supercell) with 3 out of possible 4 carbon sites occupied. Further calculations, of which the dispersions are not shown, were also done for a single carbon vacancy in a supercell (Mo3Al2C0.875 with 7 out of possible 8 C sites occupied) and in a supercell (Mo3Al2C0.96875 with 31 out of 32 C sites occupied). Both Mo3Al2C0.75 and Mo3Al2C0.875 are found to be dynamically stable with no imaginary modes, whereas Mo3Al2C0.96875 is found to be significantly unstable with the value of the lowest imaginary optical modes at being THz quite close to that of the perfect stoichiometric compound (THz).
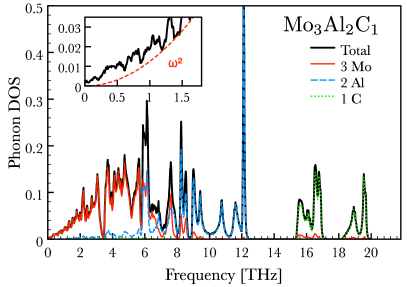
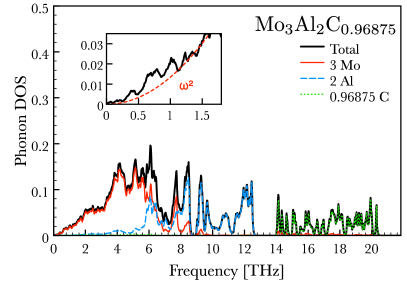
In Fig. 2 the normalized phonon density of states (DOS) of the dynamically unstable compounds Mo3Al2C1 and Mo3Al2C0.96875 are compared to those of the dynamically stable compounds Mo3Al2C0.875 and Mo3Al2C0.75. While at low frequencies no Debye-like behavior is observed for Mo3Al2C1 and Mo3Al2C0.96875, it is seen for the other two cases. For Mo3Al2C0.875 the Debye-like behavior is observed only in a rather narrow frequency range up to THz due to the softening of the acoustical and optical modes. However, for Mo3Al2C0.75 the Debye-feature reaches up to THz. The partial DOS reveals that Mo, as the heaviest atomic species, dominates the lower frequency spectrum (up to THz), whereas C, being the lightest atom, has contributions only at frequencies above THz. Furthermore, the carbon dominated frequency modes are shifted down by the introduction of vacancies from above THz for Mo3Al2C1 to about THz for Mo3Al2C0.75. Strikingly, in all the DOS’s a pronounced Al peak at THz occurs. The Al spectrum is rather broad with significant contributions from THz to THz. Even below this range a telling small contribution is found indicating a hybridization with Mo modes.
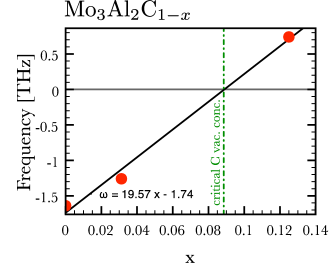
The results indicate, that there is a critical concentration of carbon vacancies below which the compound becomes dynamically unstable. Assuming that the frequency of the lowest optical mode at scales linearly with the carbon vacancy concentration , the critical carbon vacancy concentration is estimated to be (using the values of Mo3Al2C1-x at , and as input; see Fig. 3).
| (a) | (b) |
 |
 |
| (c) | (d) |
 |
 |
The cause of the stabilization of the optical low-frequency Mo modes by the carbon vacancies is the changed Mo-C bonding in the Mo6C subunits. We examined the relaxations occurring in Mo3Al2C0.75, i.e., when a single C atom is removed from one of the four Mo6C subunits in the unit cell of Mo3Al2C1. Thereby a strong influence on the Mo-C bonds in all three remaining Mo6C subunits is observed because they share a common Mo atom with the defect subunit. By relaxing the atomic positions the C atom drifts into an off-center position within the remaining Mo6C subunits, increasing the average Mo-C bond length by 1.4 % and the corresponding octahedral volume by 3.6 %. The distortion of the remaining Mo6C subunits seems to be the stabilizing factor for the vibrational modes. Concomitantly we notice this distortion for the Mo-Al bonding, e.g., the two distinctive nearest Mo-Al bonds with bond-lengths 2.84 Å and 2.95 Å in the fully stoichiometric compound are distorted in Mo3Al2C0.75 to lengths in the range of Å. Such a distortion for the Mo-Al bonds has recently been indicated experimentally.Kuo et al. (2012)
IV Carbon Vacancies
As discussed, a certain amount of carbon vacancies is needed to stabilize the imaginary optical modes. The key question is if the formation of vacancies is at all thermodynamically possible. This question is investigated by calculating vacancy formation energies and by means of a model.
Within a standard DFT approach, the vacancy formation energy per atom is defined by subtracting the total energy of the stoichiometric compound from the total energy of the compound with a vacancy of atom type and adding the ground-state energy of the removed atom by
| (1) | |||||
Because standard DFT calculations are strictly valid only at K no temperature dependency has been yet introduced. This can be done by considering the temperature dependent vibrational free energies and defining the vibrational vacancy formation energy per atom similar to Equ. 1,Reith and Podloucky (2009)
| (2) | |||||
Both, and are formulated for a standard unit cell. To derive results for smaller vacancy concentrations larger supercells are needed and the stoichiometries in Equs. 1 and 2 have to be scaled accordingly. The reference energies and were derived for the ground states of body-centered cubic Mo, face-centered cubic Al, and C in the graphene structure.
| Mo-vac | Al-vac | C-vac | C-vac | ||
| supercell size | 111 | 111 | 111 | 211 | |
| 1.74 | 0.86 | 0.60 | |||
| K: | 1.58 | 0.50 | 0.20 | ||
| K: | 1.51 | 0.39 | 0.08 | ||
| C vacancy concentration for Mo3Al2C1-x: | 0.25 | ||||
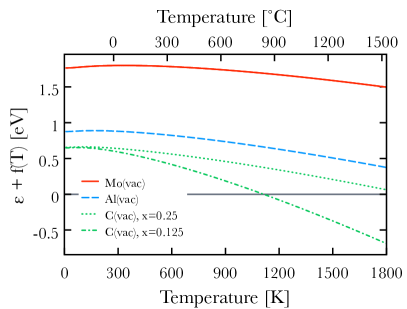
The vacancy formation energies in Table 2 and Fig. 4 at K are strongly positive for all types of vacancies, whereby the Mo vacancy with its formation energy of 1.74 eV is by far the most unfavorable one. Carbon vacancies are the most favorable ones with a formation energy of 0.60 eV for Mo3Al2C0.75. This value is reduced by only 0.04 eV for the smaller vacancy concentration of Mo3Al2C0.875.
The experimental samples were synthesized at K and heat treated at K.Bauer et al. (2010) Therefore, theory needs to consider temperature dependent vacancy formation energies combined with the composition dependent configurational entropy Reith and Podloucky (2009) in order to compare with experiment. For the actual calculation of the vibrational free energy the small amount of imaginary modes in the fully stoichiometric compound were omitted.
Table 2 and Fig. 4 show that the vibrational contributions reduce the strongly positive vacancy formation energies at K. While this reduction is rather small for the Mo vacancy (from eV to eV at K), it is much larger for the other two types of vacancies.
In particular, the formation energy of the carbon vacancy in Mo3Al2C0.75 decreases from eV to eV at K. Remarkably, this reduction is much larger for the smaller carbon vacancy concentration, i.e., Mo3Al2C0.875, with a decrease by more than eV down to eV. These negative values for the formation energy indicate a possible thermodynamical stabilization of carbon vacancies in Mo3Al2C1-x. Noticeably, this difference of the temperature dependent free energies for different carbon vacancy concentrations comes exclusively from the vibrational contributions , because –as mentioned above– at K the vacancy formation energies are almost equal.
From an isolated defect model Ashcroft and Mermin (2001) the temperature dependent equilibrium vacancy concentration can be calculated. However, the vacancy formation energy in the description of the internal energy, ,Mayer and Fähnle (1997) is strongly dependent on . Hence, the isolated defect model cannot be applied directly, as the internal energy is not a linear function of . In our case it is described as a quadratic function of , wherein and are temperature-dependent parameters fitted to the calculated carbon values at , , and .
Thus, the free energy for the vacancy formation including the configurational entropy is formulated as
| (3) |
Assuming is the mixing entropy of non-interacting vacancies , the derivative of with respect to can be used to search for the temperature dependent concentration by minimizing the free energy, i.e.,
| (4) |
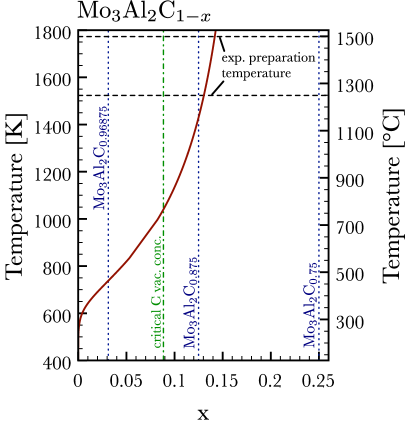
with . This expression enables the numerical calculation of , as shown in Fig. 5, using a bracketing root finding algorithm.Press et al. (2007) Inspecting Fig. 5 the C vacancy concentration is 0.130.14. at the experimental preparation temperatures Bauer et al. (2010) of K and K. As elaborated in the previous Section III at such vacancy concentrations Mo3Al2C1-x is dynamically stable.
V Electronic Structure
| (a) | (b) |
|---|---|
 |
 |
After finding that vacancies do exist on the carbon sublattice and that these are necessary to stabilize the crystal structure we will now briefly discuss the band structure and the electronic DOS of Mo3Al2C1-x. As will be shown the influence of a changed carbon stoichiometry on the band structure can not be described by a simple rigid band model. Especially, the spin-orbit splitting on the bands in a fully relativistic calculation strongly depends on .
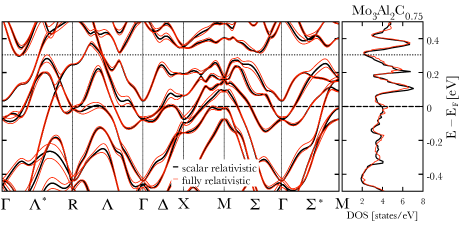
In Fig. 6 the electronic band structure and DOS of the fully stoichiometric compound is compared to that of Mo3Al2C0.75. The attentive reader might question this choice of as being too high, because our thermodynamical model (described in the previous section) predicted a much lower carbon vacancy concentration. However, we chose this value due to the fact that the unit cells of both compounds have equal size and shape making it easier to compare these.
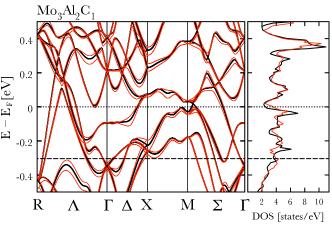
At this point it should be remarked that our calculated band structure for Mo3Al2C1 shown in panel (a) in Fig. 6 resembles the one published previously by Bauer et al.Bauer et al. (2010) but differs distinctively from that published by Karki et al.Karki et al. (2010) The different finding by Karki et al. can only stem from the use of a different crystal structure. We have recalculated the band structure by means of the full-potential linearized augmented plane-wave method using our own code FLAIRWeinert et al. (1982, 2009) and also by comparing to a recent calculation with the code Wien2KBlaha (2012) (the later was also used by Karki et al.Karki et al. (2010)). All these calculations yielded the same result for the band structure of Mo3Al2C1 in the cubic -Mn type crystal structure, i.e., the one shown in panel (a) of Fig. 6.
We have calculated the band structures both in a scalar relativistic approximation, omitting spin-orbit coupling, and fully relativistically, including spin-orbit coupling in a self-consistent manner. As expected, some degeneracies at the high-symmetry points are different whether spin-orbit coupling is included or not, e.g., a splitting of meV at and of meV at R in Mo3Al2C1 and of meV at both and R in Mo3Al2C0.75 just below the Fermi energy is evident. However, the most striking point is the loss of the double degeneracy of the bands due to spin-orbit coupling in noncentrosymmetric compounds.Callaway (1964); Bauer et al. (2009) From Fig. 6 we observe this vertical spin-orbit splitting of the bands, e.g., meV on the path around eV in Mo3Al2C1 and meV on the path around eV in Mo3Al2C0.75. As a consequence the Fermi surfaces of noncentrosymmetric Mo3Al2C1-x do also split due to spin-orbit coupling which can be seen in Fig. 6 as the horizontal band splitting at .
Comparing the band structure and electronic DOS of Mo3Al2C1 with that of Mo3Al2C0.75 in Fig. 6 one immediately notices that removing a carbon atom from the carbon sublattice has a substantial effect and it is not sufficient to simply shift the Fermi level in order to account for the carbon vacancy.
From these results we conclude, that the structure of the Fermi surfaces and hence any nesting, paramount to the understanding of superconductivity, strongly depend on .
VI Conclusions
In the present work we have shown, that vacancies are necessary to dynamically stabilize the cubic -Mn type (P4132) crystal structure of Mo3Al2C, whereby vacancies on the carbon sublattice are energetically the most favorable ones. According to our thermodynamical model the most probable carbon vacancy concentration in Mo3Al2C1-x is about considering actual experimental preparation temperatures.
We have demonstrated that there exists a critical value of below which Mo3Al2C1-x becomes dynamically unstable, and especially the frequency at which the Debye-like behavior of the phonons ends strongly depends on .
Likewise, the band structure and electronic DOS are influenced by the carbon vacancy concentration.
The still unresolved question if Mo3Al2C is a conventional or unconventional superconductor can only be answered when the carbon vacancies are properly considered, as the structure and nesting of the Fermi surfaces depend on the carbon vacancy concentration. If this carbon vacancy concentration could be controlled, it might be possible to tune the superconducting properties of Mo3Al2C1-x. This might be rather difficult, because it may depend on the sample preparation and the cooling process. Further, one can safely assume, that at the preparation temperature of K the sample is in its thermodynamic equilibrium. This is not the case when its superconducting properties are measured where it is in a quenched meta-stable state.
Acknowledgements.
This work was supported by the Austrian Science Fund FWF under Grant No. P22295. Computational calculations were done on the Vienna Scientific Cluster (VSC).References
- Jeitschko et al. (1963) W. Jeitschko, H. Nowotny, and F. Benesovsky, Monatshefte für Chemie / Chemical Monthly 94, 247 (1963).
- Johnston et al. (1964) J. Johnston, L. Toth, K. Kennedy, and E. R. Parker, Solid State Commun. 2, 123 (1964).
- Fink et al. (1965) H. J. Fink, A. C. Thorsen, E. Parker, V. F. Zackay, and L. Toth, Phys. Rev. 138, A1170 (1965).
- Toth and Zbasnik (1968) L. Toth and J. Zbasnik, Acta Metall. 16, 1177 (1968).
- Toth (1971) L. E. Toth, Transition Metal Carbides and Nitrides. Refractory Materials Monographs., vol. 7 (Academic Press, New York, 1971).
- Bauer et al. (2010) E. Bauer, G. Rogl, X.-Q. Chen, R. T. Khan, H. Michor, G. Hilscher, E. Royanian, K. Kumagai, D. Z. Li, Y. Y. Li, et al., Phys. Rev. B 82, 064511 (2010).
- Karki et al. (2010) A. B. Karki, Y. M. Xiong, I. Vekhter, D. Browne, P. W. Adams, D. P. Young, K. R. Thomas, J. Y. Chan, H. Kim, and R. Prozorov, Phys. Rev. B 82, 064512 (2010).
- Bonalde et al. (2011) I. Bonalde, H. Kim, R. Prozorov, C. Rojas, P. Rogl, and E. Bauer, Phys. Rev. B 84, 134506 (2011).
- Koyama et al. (2011) T. Koyama, Y. Ozaki, K. Ueda, T. Mito, T. Kohara, T. Waki, Y. Tabata, C. Michioka, K. Yoshimura, M.-T. Suzuki, et al., Phys. Rev. B 84, 212501 (2011).
- Kuo et al. (2012) C. N. Kuo, H. F. Liu, and C. S. Lue, Phys. Rev. B 85, 052501 (2012).
- Bauer et al. (2004) E. Bauer, G. Hilscher, H. Michor, C. Paul, E. W. Scheidt, A. Gribanov, Y. Seropegin, H. Noël, M. Sigrist, and P. Rogl, Phys. Rev. Lett. 92, 027003 (2004).
- Gor’kov and Rashba (2001) L. P. Gor’kov and E. I. Rashba, Phys. Rev. Lett. 87, 037004 (2001).
- Sigrist et al. (2007) M. Sigrist, D. Agterberg, P. Frigeri, N. Hayashi, R. Kaur, A. Koga, I. Milat, and K. W. Y. Yanase, J. Magn. Magn. Mater. 310, 536 (2007).
- Kresse and Furthmüller (1996) G. Kresse and J. Furthmüller, Phys. Rev. B 54, 11169 (1996).
- Kresse and Joubert (1999) G. Kresse and D. Joubert, Phys. Rev. B 59, 1758 (1999).
- Blöchl (1994) P. E. Blöchl, Phys. Rev. B 50, 17953 (1994).
- Perdew et al. (1996) J. P. Perdew, K. Burke, and M. Ernzerhof, Phys. Rev. Lett. 77, 3865 (1996).
- Blöchl et al. (1994) P. E. Blöchl, O. Jepsen, and O. K. Andersen, Phys. Rev. B 49, 16223 (1994).
- Monkhorst and Pack (1976) H. Monkhorst and J. Pack, Phys. Rev. B 13, 5188 (1976).
- Methfessel and Paxton (1989) M. Methfessel and A. T. Paxton, Phys. Rev. B 40, 3616 (1989).
- Alfè (2009) D. Alfè, Comp. Phys. Commun. 180, 2622 (2009).
- Baroni et al. (2001) S. Baroni, S. de Gironcoli, A. Dal Corso, and P. Giannozzi, Rev. Mod. Phys. 73, 515 (2001).
- McMaster et al. (1969) W. H. McMaster, N. D. Grande, J. Mallett, and J. Hubbell, Compilation of X-Ray Cross Sections (Lawrence Livermore National Laboratory Report UCRL-50174 Section II Revision I, 1969).
- Reith and Podloucky (2009) D. Reith and R. Podloucky, Physical Review B 80, 054108 (2009).
- Ashcroft and Mermin (2001) N. W. Ashcroft and N. D. Mermin, Festkörperphyik (Oldenbourg Verlag München Wien, 2001), chap. 30, pp. 782–785, translation by J. Gress.
- Mayer and Fähnle (1997) J. Mayer and M. Fähnle, Acta Materialia 45, 2207 (1997).
- Press et al. (2007) W. H. Press, B. P. Flannery, S. A. Teukolsky, and W. T. Vetterling, Numerical Recipes: The Art of Scientific Computing (Cambridge University Press, 2007), p. 445.
- Weinert et al. (1982) M. Weinert, E. Wimmer, and A. J. Freeman, Phys. Rev. B 26, 4571 (1982).
- Weinert et al. (2009) M. Weinert, G. Schneider, R. Podloucky, and J. Redinger, J. Phys.: Condens. Matter 21, 084201 (2009).
- Blaha (2012) P. Blaha (2012), private communication.
- Callaway (1964) J. Callaway, Energy Band Theory (Academic Press, New York and London, 1964), chap. 1.
- Bauer et al. (2009) E. Bauer, R. T. Khan, H. Michor, E. Royanian, A. Grytsiv, N. Melnychenko-Koblyuk, P. Rogl, D. Reith, R. Podloucky, E.-W. Scheidt, et al., Phys. Rev. B 80, 064504 (2009).