Constraints on the gamma-ray emission from the cluster-scale AGN outburst in the Hydra A galaxy cluster
Abstract
Context. In some galaxy clusters powerful AGN have blown bubbles with cluster scale extent into the ambient medium. The main pressure support of these bubbles is not known to date, but cosmic rays are a viable possibility. For such a scenario copious gamma-ray emission is expected as a tracer of cosmic rays from these systems.
Aims. Hydra A, the closest galaxy cluster hosting a cluster scale AGN outburst, located at a redshift of 0.0538, is investigated for being a gamma-ray emitter with the High Energy Stereoscopic System (H.E.S.S.) array and the Fermi Large Area Telescope (Fermi-LAT).
Methods. Data obtained in 20.2 hours of dedicated H.E.S.S. observations and 38 months of Fermi-LAT data, gathered by its usual all-sky scanning mode, have been analyzed to search for a gamma-ray signal.
Results. No signal has been found in either data set. Upper limits on the gamma-ray flux are derived and are compared to models. These are the first limits on gamma-ray emission ever presented for galaxy clusters hosting cluster scale AGN outbursts.
Conclusions. The non-detection of Hydra A in gamma-rays has important implications on the particle populations and physical conditions inside the bubbles in this system. For the case of bubbles mainly supported by hadronic cosmic rays, the most favorable scenario, that involves full mixing between cosmic rays and embedding medium, can be excluded. However, hadronic cosmic rays still remain a viable pressure support agent to sustain the bubbles against the thermal pressure of the ambient medium. The largest population of highly-energetic electrons which are relevant for inverse-Compton gamma-ray production is found in the youngest inner lobes of Hydra A. The limit on the inverse-Compton gamma-ray flux excludes a magnetic field below half of the equipartition value of 16 G in the inner lobes.
1 Introduction
At the center of some galaxy clusters powerful Active Galactic Nuclei (AGN) reside and the feedback of outbursts generated by these AGN on the embedding Intra-Cluster Medium (ICM) can be seen in several systems (for a review, see McNamara & Nulsen, 2007). Typical signatures for an AGN – ICM interaction are surface brightness depressions in the diffuse thermal X-ray emission of the cluster which are caused by cavities in the ICM. These cavities appear to be filled with non-thermal electrons which radiate in the radio band due to synchrotron emission (e.g. Bîrzan et al., 2004; Dunn & Fabian, 2006). AGN-blown bubbles surrounded by thermal plasma offer the exciting possibility to constrain the energetics of these outbursts. This can be done by estimating the work that is necessary to expand the bubbles against the thermal pressure of the embedding ICM (pV work in the following). The energetics involved in this AGN activity can be enormous, in some cases even exceeding 1061 erg (McNamara & Nulsen, 2007). The most powerful AGN outbursts known to date are found in MS 0735+7421 (McNamara et al., 2005), Hercules A (Nulsen et al., 2005a) and Hydra A (Nulsen et al., 2005b). The AGN created bubbles in these systems have ages of about 108 years and exhibit sizes on the scale of the galaxy cluster itself.
The nature of the main pressure support agent which fills the bubbles in the ICM is not known to date. Viable possibilities for the pressure support in such systems would be relativistic particles such as hadronic cosmic rays or electrons (e.g. Dunn & Fabian, 2004; Ostrowski & Sikora, 2001; Hinton et al., 2007), magnetic fields (e.g. Dunn & Fabian, 2004) or hot plasma (e.g. Gitti et al., 2007). The energy required to expand bubbles with volume into a surrounding ICM with pressure ranges from for magnetic fields to for relativistic fluids such as cosmic rays (e.g. Wise et al., 2007).
One inevitable consequence of bubbles filled with non-thermal particles would be the production of gamma-ray emission. For the case of hadronic cosmic rays, gamma rays are produced by inelastic collisions between the high energy particles and the thermal surrounding medium (e.g. Hinton et al., 2007). In case of electrons, gamma-rays are produced by up-scattering of cosmic microwave background (CMB) and infrared extragalactic background light (EBL) photons by these electrons (e.g. Abdo et al., 2010a). Large-scale leptonic gamma-ray emission connected to AGN lobes has indeed been discovered with the Fermi satellite from the radio galaxy Centaurus A (Abdo et al., 2010a) and potentially from NGC 6251 (Takeuchi et al., 2012). Both galaxies are not hosted by a cluster. To date, no galaxy cluster has been firmly detected in gamma rays (Perkins et al., 2006; Aharonian et al., 2009a, b; Aleksić et al., 2010; Ackermann et al., 2010). However, the detection of an extended gamma-ray signal resulting from annihilation emission from supersymmetric dark matter has been claimed for the Virgo, Fornax and Coma cluster (Han et al., 2012). Recently, NGC 1275 the central radio galaxy of the Perseus cluster has been detected in VHE gamma rays (Aleksić et al., 2012a), and with this deep exposure stringent upper limits on the emission of the Perseus cluster itself have been obtained (Aleksić et al., 2012b). Galaxy clusters hosting cluster-scale AGN outbursts appear to be promising targets for gamma-ray observations according to the extraordinary energetics inferred from the AGN – ICM interaction seen in these systems. To date, no gamma-ray observations on galaxy clusters that host cluster-scale AGN outbursts have been presented.
The Hydra A system (Abell 0780) at RA(J2000) = 9h18m05.7s and Dec(J2000) = -12∘05′44′′at a redshift of 0.0538 is the closest known galaxy cluster which hosts a cluster-scale AGN outburst (Nulsen et al., 2005b). It features several cavities with a total expansion work of erg done on the ICM. Thus the total energy required, depending on the equation of state of the main pressure agent, is erg which were deposited in the last few 108 years in the surroundings (Wise et al., 2007). Hydra A also features low-frequency radio lobes extending to almost 4′ from the cluster center (Lane et al., 2004). Shocks in the ICM surround these radio lobes (Nulsen et al., 2005b) with energetics of erg, comparable to the expansion work done in the cavities against the thermal plasma. The central AGN outburst has also driven substantial gas dredge-up in the Hydra A system (Gitti et al., 2012).
Chandra has furthermore revealed an extensive cavity system consisting of three generations of cavities with decreasing ages, which points towards a complex activity history of the system (Wise et al., 2007). Most relevant for gamma-ray production are the giant outer lobes that dominate the energetics in the Hydra A system and the inner lobes that are expected to contain the youngest population of particles. Both possibilities will be further discussed in Sec. 4.
Due to its proximity and energetics, Hydra A is expected to feature the highest gamma-ray flux of all galaxy clusters harboring cluster-scale AGN outbursts. For the case of hadron-dominated bubbles it was inferred that the flux might be close to the detection limit of the current generation of gamma-ray instruments (Hinton et al., 2007).
In this paper, upper limits on the gamma-ray emission from the Hydra A system are reported. Limits obtained by the High Energy Stereoscopic System (H.E.S.S.) and the Fermi Large Area Telescope (Fermi-LAT) are presented in Sec. 2 and Sec. 3, respectively. These limits are used to obtain constraints on the energy of hadronic cosmic rays (Sec. 4.1.1) and electrons (Sec. 4.1.2 and 4.2) which may populate the AGN outburst region in this galaxy cluster.
Throughout this paper a CDM cosmology with = 70 km s-1 Mpc-1, = 0.7 and = 0.3 is assumed, corresponding to a luminosity distance of = 240 Mpc, an angular diameter distance of 216 Mpc and a linear scale of 1.05 kpc per arcsecond (Wise et al., 2007).
2 H.E.S.S. data analysis
Hydra A was observed in the VHE gamma-ray range (E 100 GeV) with H.E.S.S. (Hinton, 2004), which is an array of four Imaging Atmospheric Cherenkov Telescopes located at the Khomas Highland in Namibia (23∘16’18” S 16∘30’00” E, altitude 1800 m). Data were taken in March and April 2007 and from January to March 2010. In total 20.2 hours of good quality data (excluding data taken during bad weather and data affected by hardware irregularities, see Aharonian et al., 2006) were collected. The data were obtained with a mean zenith angle of 15∘ which resulted in an energy threshold of 240 GeV.
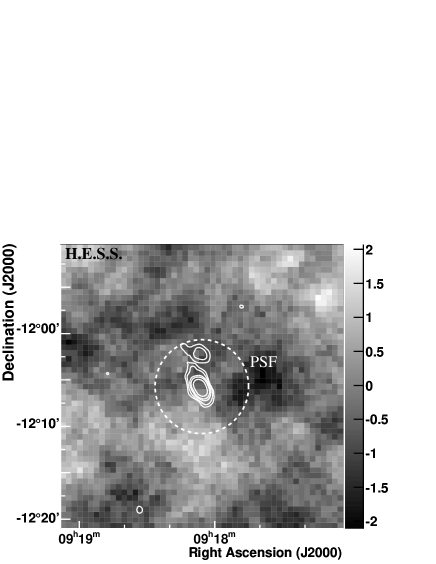
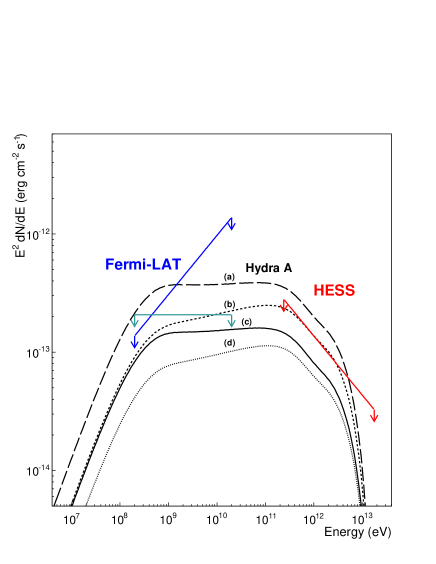
The data were analyzed with a boosted decision tree method (Ohm et al., 2009). For H.E.S.S., Hydra A was treated as a point-like source. This is a reasonable assumption since the lobes of Hydra A extend over 4′ in comparison to the 68% containment radius of the H.E.S.S. point spread function (PSF) of 6′ (Aharonian et al., 2006). Using std cuts ( denotes the boosted decision tree classifier and for the definition of std cuts see Ohm et al., 2009)111software version hap-11-02-pl07 and reflected background model (Berge et al., 2007), a total number of counts of 456 on the target and a number of background counts of 7265 (with source to background normalization ) were measured. This results in an excess of 9.7 events corresponding to a significance of 0.4 (Li & Ma, 1983) and hence no significant signal has been found (see Fig. 1). This result was confirmed with an independent calibration and analysis chain (de Naurois & Rolland, 2009). Since no signal was detected, upper limits were derived using the method of Rolke et al. (2005). At a confidence level of 95% an upper limit of cm-2s-1 for a power-law of the form with an assumed photon index is found. The gamma-ray index is chosen to approximately match the shape of the predicted spectrum (see Hinton et al., 2007). Upper limits were computed also for and only weakly depend on the spectral index with a difference of less than 10%. In Fig. 2 upper limits for that fits closest to the model predictions, are plotted and compared to model predictions.
3 Fermi data analysis
Hydra A has been observed by the Large Area Telescope (LAT), which is the primary instrument on the Fermi Gamma-ray Space Telescope (Fermi). It is a pair conversion telescope for high-energy gamma-rays with a wide field of view. It covers the energy regime from 20 MeV to 300 GeV with an angular resolution of approximately 3.5∘ at 100 MeV and narrowing to 0.14∘ at 10 GeV (see Atwood et al., 2009). In survey mode, the observatory is rocked north and south on alternate orbits so that every part of the sky is observed for 30 minutes every 3 hours.
Fermi-LAT observations of Hydra A from MJD 54682.9 to 55816.7, corresponding to a period of 38 months from August 2008 to September 2011, are used in this paper. The data were retrieved from the public data archive and analyzed using the Fermi Science Tools v9r23 package. The standard event filtering, reconstruction and classification were applied to the data (Abdo et al., 2009). The instrument response function, P7SOURCE_V6, is applied throughout the data analysis.
Events with energies between 200 MeV and 200 GeV and within a circular region of 15∘ radius have been considered in the analysis. A binned maximum likelihood analysis was performed on the data using the gtlike tool. All sources in the Fermi second year catalog (Abdo et al., 2011) within 15∘ are included in the source model as well as the Galactic diffuse emission model, gal_2yearp7v6_v0.fits, and the corresponding extragalactic isotropic diffuse emission model. The isotropic model used is iso_p7v6source.txt, which is valid for P7SOURCE_V6 instrument response functions. All point sources were modeled with parameters fixed to those reported in the Fermi second year catalog unless they were within 10∘ of Hydra A. Since Hydra A does not appear in the Fermi second year catalog, an additional point source was inserted at its position, assuming a power-law spectrum. Details on the likelihood analysis techniques and the models used can be found on the Fermi Science Support Center website222 http://fermi.gsfc.nasa.gov/ssc/ (see also Abdo et al., 2009).
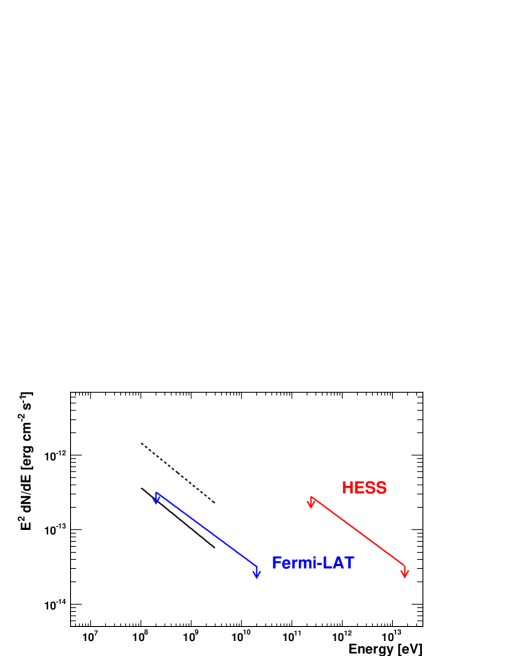
The TS value, which square root is a measure of the significance of a source, at the position of Hydra A is about 1. This implies that no significant signal has been found in the data. Therefore, 95% flux upper limits are produced for a point-like source with an assumed spectral index of (1.5, 2.0 and 2.5, that are given in Table 1). Models are compared to upper limits obtained for the spectral index that is most compatible with the prediction. Flux upper limits are shown in Fig. 2 for (blue) and (cyan) whereas the limit obtained for is shown in Fig 3 and 4.
| (200 MeV) [erg cm-2 s-1] | |
|---|---|
| 1.5 | |
| 2.0 | |
| 2.5 |
4 Discussion
Several scenarios of gamma-ray production in the Hydra A galaxy cluster are possible. The whole system consists of three generations of AGN outbursts that created bubbles of different energetics and consecutive ages (see Wise et al., 2007). The giant outer lobes inflated by the oldest cycle of AGN activity contain most of the energy. For these outer lobes a hadronic scenario is investigated in Sec. 4.1.1 and a potential leptonic scenario is discussed in Sec. 4.1.2. In a hadronic scenario it is expected that gamma-ray emission is dominated by the giant outer lobes, since cooling of hadronic cosmic rays on timescales relevant for the evolution of the outer lobes of years (see Hinton et al., 2007) is unimportant in the Hydra A system. The situation is different for electrons since they are effected by cooling on this rather long time scale. It is expected that the largest population of highly-energetic electrons which are relevant for IC gamma-ray production is found in the youngest inner lobes. Therefore, a leptonic scenario for the inner lobes is examined in Sec. 4.2.
4.1 Constraints on the particle population in the giant outer lobes
4.1.1 Hadronic population
The gamma-ray luminosity in a hadronic scenario is given by the total energy in cosmic rays and the mean density of target material. In galaxy clusters which harbor cluster-scale AGN outbursts, the total energy in cosmic rays can in principle be estimated from the energetics of the AGN outbursts if this is assumed to be the energetically dominant feedback agent on the ICM. Viable proxies for the energy in cosmic rays could be the energetics of the shock wave or the energy needed to sustain the X-ray cavities. In the general picture for AGN outbursts in galaxy clusters, the radio bubbles are dominated by cosmic rays, whereas the thermal ICM is distributed around these bubbles. The radio bubbles appear as surface brightness depressions in X-rays. This indicates a depletion of the hot ICM inside them. The three-dimensional structure of the bubbles is not known and, consequently, the actual density of X-ray emitting plasma inside the cavities can only loosely be constrained. Limits on the density of thermal plasma inside the lobes can also be obtained with the depolarization effect of the radio emission of the lobes (Garrington & Conway, 2001). The actual gamma-ray luminosity of the system will depend on the level of mixing between hadronic cosmic rays and the thermal ICM. Processes which can lead to an effective mixing between cosmic rays and target material in AGN outbursts are diffusion of cosmic rays out of the bubbles to the regions with higher ICM density (e.g. Hinton et al., 2007), and entrainment of non-relativistic material in the outflow from the central engine (e.g. Pope et al., 2010).
For Hydra A order of magnitude estimates give a gamma-ray luminosity of erg s-1, with erg is the total energy in hadronic cosmic rays and years is the cooling time for proton-proton interactions for a mean density of target material of cm-3, as obtained from X-ray measurements (Nulsen et al., 2005b). This results in a gamma-ray flux at Earth of erg cm-2 s-1. This estimate shows that for an optimistic scenario where cosmic rays are well mixed with the embedding target material, this object is within reach of the current generation of gamma-ray instruments. The predicted gamma-ray flux for a more elaborate model for Hydra A, assuming a hadronic emission mechanism and corrected for absorption by the EBL for a redshift of 0.0538, is shown for different scenarios (models from Hinton et al., 2007) in Fig. 2. For all cases the adopted mean density of thermal plasma outside the bubbles is cm-3.
Cases (a) and (b) consider an energy in cosmic rays corresponding to the energetics of the blast wave surrounding the bubbles of erg. In case (a) the bubbles are filled with cold, unseen gas with the same density as the surroundings which could be entrained by the AGN outflow. In case (b) bubbles are completely evacuated from the thermal ICM and mixing between the thermal ICM, and the cosmic rays results solely from energy-dependent diffusion of cosmic rays to the outside medium of the bubbles.
For the cases (c) and (d) it is adopted that the total energy in cosmic rays is erg, which is necessary to prevent the cavities in the X-ray emitting gas to collapse. In case (c) the density of the ICM in the bubbles is half of the density outside the bubbles and for case (d) the same scenario comprising empty cavities as (b) is adopted.
Predictions of these different model assumptions are compared to the upper limits on the gamma-ray emission of the Hydra A system obtained with Fermi-LAT and H.E.S.S. From Fig. 2 it is evident that these instruments are able to constrain the most favorable scenario for hadronic cosmic ray content and mixing of cosmic rays and thermal gas in the Hydra A galaxy cluster. This scenario would require a complete compound between cosmic rays and ICM. This model (a) predicts a flux of erg cm-2 s-1 in the range of about 1 GeV - 300 GeV. The presence of cavities in the ICM seems to argue against complete mixing between these two components. However, it has to be noted that 10% of the entire ICM contained within a radius of 150 kpc from the cluster center has been dredged-up by the AGN outburst. This up-lifted cooler gas partially follow the location of the giant outer bubbles (Gitti et al., 2012). Since these bubbles occupy 10% of the cluster volume within a radius of 150 kpc (Wise et al., 2007), significant entrainment of cool gas in the outer bubbles can be expected. From the upper limits obtained with Fermi-LAT (see Tab. 1) and H.E.S.S. above 240 GeV of erg cm-2 s-1 (assuming ) limits on the degree of mixing between cosmic rays and ICM can be derived. Fermi-LAT can constrain the degree of mixing to 0.5 and H.E.S.S. can limit the degree of mixing to less than 0.7 where 0 means no mixing and 1 defines complete mixing between the two components. It is expected that particles with higher energies diffuse faster into their surroundings and therefore also mix faster with the ambient medium. Thus both values for the limit on the degree of mixing at different energies provide interesting constraints on particle transport in the Hydra A system. In general, hadronic cosmic rays as the energetically most important feedback agent in cluster-scale AGN outbursts can currently not be excluded.
4.1.2 Electronic population
Electrons, as opposed to hadrons, can lose their energy efficiently during the evolution time of the outburst in Hydra A of years (Hinton et al., 2007). For magnetic fields found in Hydra A of about 6 G (Taylor & Perley, 1993) only electrons with energies 1 GeV are still present after synchrotron-cooling on such a time-scale. This picture is supported by a steepening of the radio index of synchrotron radiation from about close to the core to almost at the edge of the lobes in the radio band of 330 – 1415 MHz (Lane et al., 2004). For such a cooling-dominated electron population no gamma-ray inverse-Compton (IC) emission is expected in the Fermi-LAT energy range.
However, Fermi-LAT has detected gamma-ray emission from the giant lobes of the Centaurus A system (Abdo et al., 2010a). Since this is the only system where gamma-ray emission from an AGN outburst has been detected on spatial scales of the order of 100 kpc, it is the only example which can in principle be compared to the limits obtained for the Hydra A lobes. It has to be noted that Centaurus A and Hydra A are quite different systems. In contrast to Centaurus A, Hydra A is located in a galaxy cluster environment with buoyantly rising bubbles. This fact together with different jet power, differing black hole mass and different accretion history in both systems may limit the applicability of such a comparison.
The Fermi-LAT discovery of the Centaurus A lobes has been interpreted in the framework of a leptonic scenario where energetic electrons up-scatter CMB and EBL photons to gamma-ray energies. The limited radiative lifetimes of these energetic electrons may point towards in situ particle acceleration in the lobes. These processes may also be at work in the Hydra A system.
To test a similar scenario for Hydra A as has been found for Centaurus A, the upper limits on gamma-ray emission obtained from Hydra A are compared to the flux measurements of the Centaurus A lobes scaled for the different distance and energetics of the Hydra A system. For this comparison for the combined emission of both Centaurus A lobes a flux above 100 MeV of ph cm-2s-1 and a spectral index of 2.55 is adopted (Abdo et al., 2010a). It has to be noted that in addition to the lobes, the nucleus of Centaurus A also emits gamma-rays with a comparable flux (Abdo et al., 2010b) but for the following discussion only the emission from the lobes is considered. To constrain the total energy in electrons in the lobes also the intensity of the photon field available for IC up-scattering has to be known. For the case of Centaurus A it was found that CMB and EBL are the dominating photon fields and a total energy of electrons of erg was estimated (Abdo et al., 2010a). The intensities of the CMB and EBL photon fields are equivalent for the Hydra A and the Centaurus A systems. With the assumption that the Hydra A lobes contain electrons with the same spectral characteristics as the Centaurus A lobes and corrected for the distance to Hydra A it is found that the total energy in electrons in the Hydra A lobes can be constrained to erg with an uncertainty dominated by the measured gamma-ray flux of the Centaurus A lobes of about 30% (Abdo et al., 2010a). This is smaller than the 1 work of erg (see Fig. 3). This limit can be regarded as conservative since the central galaxy in Hydra A with log (apparent V-band magnitude , extinction )333http://ned.ipac.caltech.edu/ is about 20 times more luminous than Centaurus A and can therefore provide an additional photon field for IC up-scattering (see Sec. 4.2).
To summarize, for an electron population with the same spectral characteristics as it is found in the Centaurus A lobes, electrons can be excluded to be the main pressure support of the large scale bubbles in Hydra A. This result together with the fact that radio emission from the Centaurus A giant lobes extends to higher frequency than in in the Hydra A giant lobes (Abdo et al., 2010a; Lane et al., 2004) points towards quite distinct properties of the electron population in these systems.
4.2 Leptonic scenario for the inner lobes
The situation for leptonic gamma-ray emission may be more promising in the youngest, innermost lobes. Indeed the Hydra A system is detected in the radio band up to frequencies of 90 GHz (Cotton et al., 2009; Wright et al., 2009). These observations show the presence of highly-energetic electrons which are relevant for IC gamma-ray production. Thus, here the upper limits on the gamma-ray emission for Hydra A are compared to the expected gamma-ray flux from the inner radio lobes.
For estimating the expected gamma-ray IC luminosity in a leptonic scenario, first the population of electrons in the lobes is explored according to their radio synchrotron emission. The particle populations are evaluated separately for the inner and outer lobes of Hydra A. The inner lobes (denoted as ‘A’ and ‘B’ in Wise et al., 2007) are assumed to be prolate spheroids located at the distance of kpc from the center, with semi-minor axis and semi-major axis (as inferred from 1.4 GHz radio maps in Bîrzan et al., 2008). The total volume of the inner lobes is therefore . For the outer lobes (denoted as ‘E’ and ‘F’ in Wise et al., 2007) kpc, and (Bîrzan et al., 2008) are used.
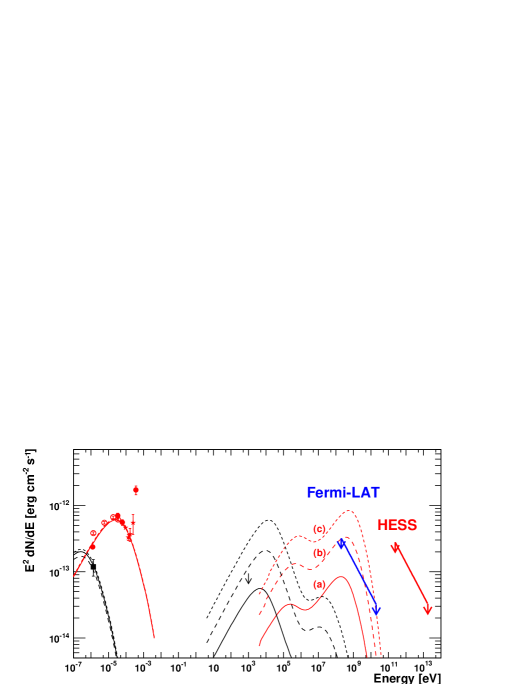
The radio fluxes for the inner lobes are taken from Bîrzan et al. (2008), Cotton et al. (2009), and Wright et al. (2009) and are shown as red open circles, red filled circles, and red stars in Fig. 4, respectively. The radio flux for the outer lobes is adopted from Bîrzan et al. (2008, black square in Fig. 4). Note that the WMAP fluxes as given in Wright et al. (2009) match well the radio continuum of the inner lobes, with the exception of the 61 GHz flux. Therefore it is assumed that these fluxes represent indeed the high-energy tail of the synchrotron emission of the inner lobes. For the 61 GHz flux as well as the 90 GHz flux (Cotton et al., 2009) it is anticipated that they are dominated by the flat-spectrum synchrotron emission of the jets and the nucleus of the radio galaxy in Hydra A instead of the inner lobes.
As discussed in Bîrzan et al. (2008) the synchrotron continua of both the inner and the outer lobes of Hydra A can be well represented by broken power laws with the low- and high-frequency radio spectral indices , and , respectively. Therefore the lobes’ electron energy distribution is assumed to be for , and for . In the case of the inner lobes, the break and the maximum electron Lorentz factors are assumed to correspond to the synchrotron frequencies 10 GHz and 100 GHz, respectively. In the case of the outer lobes the analogous synchrotron break and maximum frequencies are taken as GHz and 1 GHz, respectively.
For the evaluation of the IC-fluxes the following target photon fields are taken into account: CMB, EBL, IR emission of the nuclear dust, and the starlight emission of the elliptical host. The EBL is approximated by the spectrum given in Raue & Mazin (2008). For the circumnuclear dust emission a modified black body spectrum with the dust temperature K and the total IR luminosity integrated over the frequency range Hz equal to erg s-1 is assumed. This model can account well for the SCUBA and MIPS data for the radio galaxy in Hydra A (Shi et al., 2005; Zemcov et al., 2007; Dicken et al., 2008). The IR energy density at the position of the inner and outer lobes is therefore taken as . In the case of the starlight emission of the host galaxy, the template spectrum as discussed in Stawarz et al. (2006), normalized to the total V-band luminosity erg s-1, is adopted. The energy density of the starlight at the position of the lobes is then evaluated as . For the inner lobes the dominating photon fields are CMB in the microwave regime, the dust emission in the infrared and the star light in the optical, respectively. EBL has been found to be unimportant for IC up-scattering in the inner lobes.
With all the model parameters and assumptions as specified above, the synchrotron and inverse-Compton fluxes of the inner and outer lobes of Hydra A are evaluated for the remaining two free parameters: the lobes’ magnetic field intensity , and the equipartition ratio . The latter parameter is defined as where , and . These values also define the total energy in ultrarelativistic electrons and the magnetic field stored in the bubbles with volume . The calculations are done for different sets of the values of and to match the observed radio fluxes in all the cases. The results are presented in Fig. 4. There the red curves correspond to the emission of the inner lobes, and the black curves represent the outer lobes. The evaluated synchrotron fluxes (see Fig. 4) match well the collected data-set and are in general agreement with the spectral analysis carried out by Lane et al. (2004) and Bîrzan et al. (2008). The solid curves illustrate the case with the exact electron–magnetic field energy equipartition, namely G, , G, and (model a). Note that the standard minimum-energy calculations return typically the equipartition magnetic field G for the inner lobes and G for the outer lobes (e.g., Taylor et al., 1990; Bîrzan et al., 2008) which is in agreement with our modeling. Parameters of further models can be found in Tab. 2. Model (b) is for a case with the magnetic field twice lower than the equipartition value, and in model (c) the magnetic field is three times below the equipartition value.
| model | ||||||
|---|---|---|---|---|---|---|
| [G] | [erg] | [G] | [erg] | |||
| a | 16 | 1 | 6.3 | 1 | ||
| b | 8 | 12 | 3 | 12 | ||
| c | 5 | 65 | 2 | 65 |
These calculations are now compared to the upper limits obtained in the gamma-ray range. Additionally also the upper limit for the power-law emission at 1 keV for the outer (Northern) lobe (black arrow in Fig. 4, Hardcastle & Croston, 2010) obtained with XMM is included. The inverse-Compton emission of the lobes in Hydra A is expected to be negligible at TeV photon energies. It may however be pronounced within the lower energy range from keV–to–GeV photons. The XMM and Fermi-LAT upper limits for the Hydra A system seem to already exclude a magnetic field in the lobes below half of the equipartition value.
5 Conclusion
In this paper the nearby galaxy cluster Hydra A that hosts a cluster-scale AGN outburst is investigated for being a gamma-ray emitter. Galaxy clusters hosting a cluster-scale AGN outburst are potentially detectable gamma-ray sources due to the enormous energetics inferred from the observed AGN - ICM interactions. However, only upper limits could be obtained from 20.2 hours of H.E.S.S. and 38 month of Fermi-LAT observations. The non-detection of Hydra A in gamma-rays has important implications on the particle populations and physical conditions inside the bubbles in this system. These upper limits constrain the total energy contained in relativistic particles such as hadronic cosmic rays and electrons, which can be compared to the energy which is necessary to prevent the observed cavities in the ICM from collapsing.
Constraints on the particle population in the Hydra A galaxy cluster can also be compared to the limits on such a non-thermal component inferred for the Perseus cluster (Aleksić et al., 2012b). The Perseus cluster is an interesting candidate for this comparison since it also shows signatures of AGN – ICM interactions in form of radio lobes and cavities in the ICM (e.g. Fabian et al., 2011). For the Perseus cluster Aleksić et al. (2012b) constrained the average fraction of energy in hadronic cosmic rays to thermal energy to % depending on the exact assumptions. For Hydra A the hadronic cosmic ray content in the central 200 kpc can be limited to about erg, assuming complete mixing between cosmic rays and ICM (see Fig. 2). When adopting a total gas mass of M⊙ and a temperature of 4 keV for the central 200 kpc of Hydra A (Davis et al., 2001) then % is found. This is significantly less constraining than for the case of the Perseus cluster. Hydra A, however, is the prime candidate to explore the particle content of giant AGN-blown lobes in galaxy clusters. This follows from the fact that the AGN outburst in the Perseus cluster is about an order of magnitude less energetic ( erg, Fabian et al., 2011) than the AGN feedback in Hydra A. The smaller energetics is not readily compensated by the shorter distance to the Perseus cluster ( = 75 Mpc).
For Hydra A for the case of bubbles mainly supported by hadronic cosmic rays these upper limits can exclude the most favorable model, that requires full mixing between relativistic particles and embedding thermal medium. It is found that Fermi-LAT can constrain the degree of mixing to 50% and H.E.S.S. can limit the degree of mixing to less than 70%. However, hadronic cosmic rays still remain a viable pressure support for the bubbles.
In contrast to hadrons, electrons cool quite fast above GeV energies in the environment of the Hydra A system. Consequently, a passively evolving population of electrons in the oldest outer lobes cannot be detected with the presented observations. However, for the youngest, inner radio lobes, the limit on the IC flux seems to exclude a magnetic field below about 8 G, that is half of the equipartition value. For the large outer lobes, a population of electrons rejuvenated by in situ particle acceleration comparable to the one detected in the Centaurus A system can be excluded as the main pressure support of the bubbles. Upper limits in the VHE gamma-ray range are not constraining for leptonic scenarios with respect to limits obtained in the GeV range.
The main feedback agent which drives the evolution of the cavities in the ICM in the Hydra A galaxy cluster still remains unidentified. The upcoming Cherenkov Telescope Array (CTA, Actis et al., 2011) with its increased sensitivity will be crucial to test especially the presence of hadronic cosmic rays in the Hydra A galaxy cluster.
Acknowledgements.
The support of the Namibian authorities and of the University of Namibia in facilitating the construction and operation of H.E.S.S. is gratefully acknowledged, as is the support by the German Ministry for Education and Research (BMBF), the Max Planck Society, the French Ministry for Research, the CNRS-IN2P3 and the Astroparticle Interdisciplinary Programme of the CNRS, the U.K. Science and Technology Facilities Council (STFC), the IPNP of the Charles University, the Polish Ministry of Science and Higher Education, the South African Department of Science and Technology and National Research Foundation, and by the University of Namibia. We appreciate the excellent work of the technical support staff in Berlin, Durham, Hamburg, Heidelberg, Palaiseau, Paris, Saclay, and in Namibia in the construction and operation of the equipment.References
- Abdo et al. (2009) Abdo, A. A. et al. (Fermi-LAT collaboration) 2009, ApJS, 183, 46
- Abdo et al. (2010a) Abdo, A. A. et al. (Fermi-LAT collaboration) 2010a, Science, 328, 725
- Abdo et al. (2010b) Abdo, A. A. et al. (Fermi-LAT collaboration) 2010b, ApJ, 719, 1433
- Abdo et al. (2011) Abdo, A. A. et al. (Fermi-LAT collaboration) 2011, e-prints (ArXiv:1108.1435)
- Ackermann et al. (2010) Ackermann, M. et al. (Fermi-LAT collaboration) 2010, ApJ, 717, L71
- Actis et al. (2011) Actis, M. et al. (CTA collaboration) 2011, ExA, 32, 193
- Aharonian et al. (2006) Aharonian, F. et al. (H.E.S.S. collaboration) 2006, A&A, 457, 899
- Aharonian et al. (2009a) Aharonian, F. et al. (H.E.S.S. collaboration) 2009a, A&A, 495, 27
- Aharonian et al. (2009b) Aharonian, F. et al. (H.E.S.S. collaboration) 2009b, A&A, 502, 437
- Aleksić et al. (2010) Aleksić, J. et al. (MAGIC collaboration) 2010, ApJ, 710, 634
- Aleksić et al. (2012a) Aleksić, J. et al. (MAGIC collaboration) 2012a, A&A, 539, L2
- Aleksić et al. (2012b) Aleksić, J. et al. (MAGIC collaboration) 2012b, A&A, 541, A99
- Atwood et al. (2009) Atwood, W. B. et al. (FERMI-LAT collaboration) 2009, ApJ, 697, 1071
- Berge et al. (2007) Berge, D., Funk, S. & Hinton, J. 2007, A&A, 466, 1219
- Bîrzan et al. (2004) Bîrzan, L., Rafferty, D. A., McNamara, B. R., Wise, M. W. & Nulsen, P. E. J. 2004, ApJ, 607, 800
- Bîrzan et al. (2008) Bîrzan, L., McNamara, B. R., Nulsen, P. E. J., Carilli, C. L., & Wise, M. W. 2008, ApJ, 686, 859
- Condon et al. (1998) Condon, J. J., Cotton, W. D., Greisen, E. W., et al. 1998, AJ, 115, 1693
- Cotton et al. (2009) Cotton, W. D., Mason, B. S., Dicker, S. R., et al. 2009, ApJ, 701, 1872
- Dicken et al. (2008) Dicken, D., Tadhunter, C., Morganti, R., et al. 2008, ApJ, 678, 712
- Davis et al. (2001) David, L. P., Nulsen, P. E. J., McNamara, B. R., et al. 2001, ApJ, 557, 546
- Dunn & Fabian (2004) Dunn, R. J. H. & Fabian, A. C. 2004, MNRAS, 355, 862
- Dunn & Fabian (2006) Dunn, R. J. H. & Fabian, A. C. 2006, MNRAS, 373, 959
- Fabian et al. (2011) Fabian, A. C., Sanders, J. S., Allen, S. W., et al. 2011, MNRAS, 418, 2154
- Garrington & Conway (2001) Garrington S. T. & Conway, R. G. 1991, MNRAS, 250, 198
- Gitti et al. (2007) Gitti, M., McNamara, B. R., Nulsen, P. E. J.& Wise, M. W. 2007, ApJ, 660, 1118
- Gitti et al. (2012) Gitti, M., Nulsen, P. E. J., David, L. P., McNamara, B. R. & Wise, M. W. 2012, ApJ, 732, 13
- Han et al. (2012) Han, J., Frenk, C. S., Eke, V. R., Gao, L. & White, S. D. M. 2012, arXiv:1201.1003
- Hardcastle & Croston (2010) Hardcastle, M. J., & Croston, J. H. 2010, MNRAS, 404, 2018
- Hinton (2004) Hinton, J. A. 2004, NewAR, 48, 331
- Hinton et al. (2007) Hinton, J. A., Domainko, W. & Pope, E. C. D. 2007, MNRAS, 382, 466
- Lane et al. (2004) Lane, W. M., Clarke, T. E., Taylor, G. B., Perley, R. A. & Kassim, N. E. 2004, 127, 48
- Li & Ma (1983) Li, T.-P. & Ma, Y.-Q. 1983, ApJ, 272, 317
- McNamara et al. (2005) McNamara, B. R., Nulsen, P. E. J., Wise, M. W. et al. 2005, Nature, 433, 45
- McNamara & Nulsen (2007) McNamara, B. R. & Nulsen, P. E. J. 2007, ARA&A, 45, 117
- de Naurois & Rolland (2009) de Naurois, M. & Rolland, L. 2009, APh, 32, 321
- Nulsen et al. (2005a) Nulsen, P. E. J., Hambrick, D. C., McNamara, B. R. et al. 2005a, ApJ, 625, L9
- Nulsen et al. (2005b) Nulsen, P. E. J., McNamara, B. R., Wise, M. W. & David, L. P. 2005b, ApJ, 628, 629
- Ohm et al. (2009) Ohm, S., van Eldik, C. & Egberts, K. 2009, APh, 31, 383
- Ostrowski & Sikora (2001) Ostrowski, M. & Sikora, M. 2001, AIPC, 586, 865
- Perkins et al. (2006) Perkins, J. et al. (Whipple collaboration) 2006, ApJ, 644, 148
- Pope et al. (2010) Pope, E. C. D., Babul, A., Pavlovski, G., Bower, R. G. & Dotter, A. 2010, MNRAS, 406, 2023
- Raue & Mazin (2008) Raue, M., & Mazin, D. 2008, IJMPD, 17, 1515
- Rolke et al. (2005) Rolke, W. A., López, A. M. & Conrad, J. 2005, Nuclear Instruments and Methods in Physics Research A, 551, 493
- Shi et al. (2005) Shi, Y., Rieke, G. H., Hines, D. C., et al. 2005, ApJ, 629, 88
- Stawarz et al. (2006) Stawarz, Ł., Aharonian, F., Wagner, S. & Ostrowski, M. 2006, MNRAS, 371, 1705
- Takeuchi et al. (2012) Takeuchi, Y., Kataoka, J., Stawarz, Ł. et al. 2012, ApJ, 749, 66
- Taylor et al. (1990) Taylor, G. B., Perley, R. A., Inoue, M., et al. 1990, ApJ, 360, 41
- Taylor & Perley (1993) Taylor, G. B. & Perley, R. A. 1993, ApJ, 416, 554
- Wise et al. (2007) Wise, M. W., McNamara, B. R., Nulsen, P. E. J. Houck, J. C. & David, L. P. 2007, ApJ, 659, 1153
- Wright et al. (2009) Wright, E. L., Chen, X., Odegard, N., et al. 2009, ApJS, 180, 283
- Zemcov et al. (2007) Zemcov, M., Borys, C., Halpern, M., Mauskopf, P., & Scott, D. 2007, MNRAS, 376, 1073