Mutual induction of magnetic and order
in multiferroic hexagonal ErMnO3
Abstract
The complex interplay between the and moments in hexagonal ErMnO3 is investigated by magnetization, optical second harmonic generation, and neutron-diffraction measurements. We revise the phase diagram and provide a microscopic model for the emergent spin structures with a special focus on the intermediary phase transitions. Our measurements reveal that the exchange between Mn3+ ions dominates the magnetic symmetry at with Mn3+ order according to the representation triggering ordering according to the same representation on the Er3+(4b) site. Below 10 K the magnetic order is governed by exchange interactions of Er3+ ions on the 2a site. The magnetic Er order according to the representation induces a magnetic reorientation () at the Er and the Mn3+ sites. Our findings highlight the fundamentally different roles the Mn3+, (2a), and (4b) magnetism play in establishing the magnetic phase diagram of the hexagonal RMnO3 system.
I Introduction: multiferroic hexagonal manganites
Materials with coexisting magnetic and electric order, the so-called multiferroics, have been attracting a lot of attention since it was recognized that they can display gigantic magnetoelectric coupling effects: Magnetic properties can be controlled by electric fields and vice versa.Kimura03a ; Hur04a ; Fiebig05a ; Cheong07a In this context the hexagonal (h-) manganites h-MnO3 with = Sc, Y, Dy–Lu play an exceptional role because they offer great flexibility for tuning such magnetoelectric correlations and studying the coupling between spin, charge, and lattice degrees of freedom in multiferroics. Crystals of the h-MnO3 family are structurally equivalent and display ferroelectric order below about 1000 K with a spontaneous polarization of C/cm2 along the hexagonal -axis.Coeure66a ; Pauthenet70a ; Kumagai12a The ions vary in size and magnetic moment and due to the interaction with the Mn3+ ions the variety of magnetic phases and magnetoelectric interaction phenomena emerging below about 100 K is particularly rich. This includes contributions to the magnetization induced by ferroelectric poling, giant magneto-elastic coupling effects, and a coupling between magnetic and ferroelectric domain walls.Lottermoser04a ; Lee08a ; Fiebig02b
A discussion of the magnetoelectric coupling phenomena in the h-MnO3 compounds with = Dy–Yb invariably involves the magnetic moments. Yet, investigations of the rare-earth order had remained scarce for a long time. Only recently, earlier magnetization measurements have been complemented by a structural analysis of the order in h-HoMnO3, h-YbMnO3, and h-DyMnO3 by neutron or resonant x-ray diffraction. The studies revealed that the – interaction in h-RMnO3 is more complex than previously assumedFabreges08a ; Harikrishnan09a ; Lonkai02a ; Sugie02a ; Munawar06a ; Tyson10a and that the magnetic Mn3+ and lattices can have a different space symmetry.Wehrenfennig10a Yet, with very few exceptionsFabreges08a little is known about the – exchange interaction between moments occupying different Wyckoff positions, i.e., the 4b and 2a sites of the hexagonal unit cell (see inset of Fig. 3 (a) for a schematic illustration). A detailed knowledge, however, is indispensable for understanding the complex magnetic, multiferroic, and magnetoelectric coupling processes in h-MnO3. It becomes even more important in view of the current intensive studies addressing the domain wallsMeier12a ; Meier12b ; Wu12a ; Du11a and their magnetic properties.Geng12a Here, any statement about the local magnetic properties initially requires a precise knowledge of the global bulk spin structure. Consequently, the first goal is to develop a model explaining the magnetic phase diagram of the h-MnO3 series in general.
For our study we have chosen h-ErMnO3 — its magnetic Mn3+ phase diagram is similar to that of h-TmMnO3 and h-YbMnO3 which establishes it as a prototypical compound within the h-MnO3 series. Based on magnetoelectric and magnetization measurements a magnetic Er3+ order was proposedIwata98a ; Sugie02a but not verified or uniquely related to the coexisting Mn3+ order.
In this Report we clarify the spin structure of the Mn3+ and Er3+ sublattices and introduce a microscopic model coherently explaining the magnetic phase diagram of h-ErMnO3 that can be projected onto the h-MnO3 system in general. For this purpose we performed complementary magnetization, second harmonic generation (SHG), and neutron-diffraction measurements at temperatures down to 30 mK. Below the Néel temperature we find antiferromagnetic order of the Mn3+ moments triggering the magnetic order of the Er3+(4b) site according to the same representation () while the Er3+(2a) sites remain disordered. In contrast, the ground state toward 0 K is ferrimagnetic with all spins ordered according to the same representation (). The intermediary phase transition () occurs via a transient breakdown of the magnetic order on the Mn3+ and Er3+(4b) sites so that the highest possible symmetry is maintained. The study advances our understanding of the different roles the Mn3+, (2a), and (4b) moments play in establishing the magnetic phase diagram of the h-RMnO3 system.
II Experimental results
II.1 Temperature- and field-dependent magnetization measurements
In order to clarify the spin structure in h-ErMnO3 we scrutinized the magnetic phase diagram and extended it towards the milli-Kelvin regime to capture the actual ground state. Our magnetization measurements were performed at the LaMMB-MagLab of the Helmholtz-Zentrum Berlin using a h-ErMnO3 single crystal of 20 mg grown by the floating-zone technique. For measurements above 1.8 K a standard vibrating sample magnetometer was used, whereas cantilever magnetometry was applied to study magnetic transitions below 1.8 K.
Figure 1(a) shows magnetization data for taken with increasing temperature K/min after field cooling (). Note that identical curves were obtained for (not shown) indicating non-hysteretic behavior. For the remainder of this work we therefore restrict the discussion to measurements with .
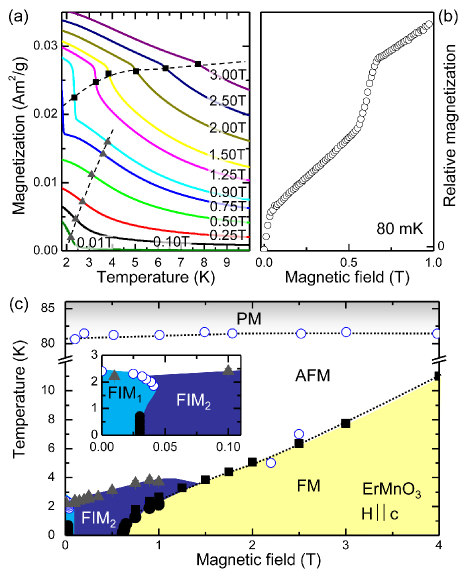
As seen in Fig. 1(a), at 0.01 T a magnetic moment of Am2/g is measured at 1.8 K. It decreases rapidly with increasing temperature showing a minimum in its derivative around 2.2 K. The result is in agreement with earlier publications where the magnetization was attributed to long range magnetic order in the Er3+ sublattice.Sugie02a For increasing magnetic fields the associated change in becomes less pronounced and the minimum in shifts to higher temperature (see gray triangles in Fig. 1(a)). The same trend is observed in magnetic torque measurements revealing a pronounced change in response between 1 K and 4 K (not shown). A second anomaly manifests at 0.75 T as a step-like increase in . This anomaly shifts continuously to higher temperatures when the magnetic field is increased further (see black circles in Fig. 1(a)). Figure 1(c) summarizes the results by showing the magnetic phase diagram in the temperature/magnetic-field plane. In order to trace the phase boundaries we investigated the magnetic-field dependence of the magnetization down to the milli-Kelvin range as exemplified by Fig. 1(b). All low-temperature magnetic-field scans clearly indicate two consecutive anomalies around 0.03 T and 0.6 T, respectively. Hence, based on our magnetization measurements we have to distinguish four different magnetically ordered states which are denoted as AFM, FIM1, FIM2, and FM in the phase diagram in Fig. 1(c).
The detailed analysis of the nature of these states, i.e. the corresponding spin structures and interactions, will be the topic of the following sections. We will distinguish four representations (magnetic space symmetries): (), (), (), and (). As we will see, lower symmetries like or do not have to be considered. For the sake of clarity we will first focus on the magnetic order of the Mn3+ lattice, followed by a study of the Er3+ order at the 4b and 2a sites. In the third part we will associate these spin structures to the magnetic phases identified in Fig. 1(c). An investigation of the intermediary transitions connecting the different magnetic phases follows. It will allow us to describe the sequence of magnetic phase transitions in a comprehensive model based on the coupling between the magnetic sublattices in the h-ErMnO3 system with an outlook to the h-MnO3 system in general.
II.2 SHG and neutron-diffraction study of the Mn3+ spin structure
The magnetic Mn3+ moments order antiferromagnetically at K.Koehler64a The resulting structure has been discussed for more than five decades. Based on the extensive literature on h-ErMnO3 the analysis and discussion can already be restricted to and as only possible magnetic representations for the Mn3+ order (see Fig. 4 for a schematic illustration).Fiebig02a ; Sekhar05a ; Park02a ; Lee06a In order to scrutinize the emergence of the magnetic order according to either of these representations we performed complementary experiments by optical SHG and by neutron diffraction on selected site-specific reflections. The neutron-diffraction experiments were performed at the E2 beamline of the Helmholtz-Zentrum Berlin. A h-ErMnO3 single crystal of mm3 (180 mg) was cut from the same batch as the crystal studied by magnetometry. The sample was mounted in a 3He/4He dilution insert and investigated in the plane at a wavelength of 2.39 Å. Since neutron-diffraction experiments alone prohibit a unique distinction between the two aforementioned space groups,Park02a SHG measurements were also conducted in order to uniquely determine the magnetic Mn3+ order. SHG is described by the equation . A light field at frequency is incident onto a crystal, inducing a dipole oscillation , which acts as source of a frequency-doubled light wave. The susceptibility couples incident light fields with polarizations and to a SHG contribution with polarization . The magnetic and crystallographic symmetry of a compound is uniquely related to the set of nonzero components and, therefore, allows to distinguish and .Fiebig05b Note that SHG has been applied earlier for investigating the magnetic structure of the Mn3+ sublattice in h-ErMnO3 but never before neutron diffraction and SHG were applied to the same sample and verified for the consistency of the two techniques.
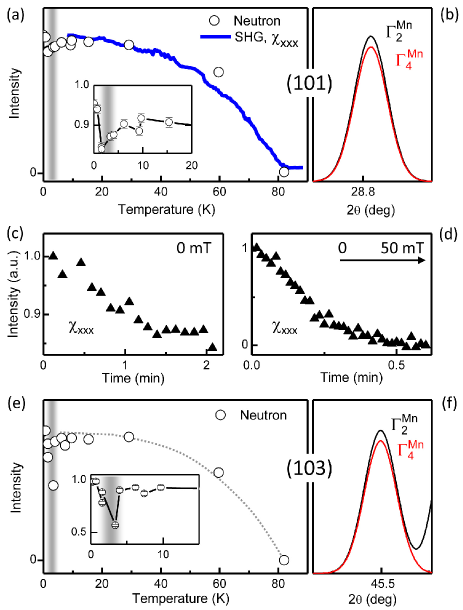
Figure 2(a) shows a comparison of temperature-dependent neutron-diffraction and SHG intensities, the former for the (101) reflection and the latter for the component of the nonlinear susceptibility tensor.Fiebig02a ; Park02a Both signals arise below and exhibit the same temperature dependence emphasizing that SHG is coupling to the antiferromagnetic order of the Mn3+ moments. The SHG measurement proves that the Mn3+ moments of h-ErMnO3 order according to the representation in the temperature range , clearly discarding the symmetry on the basis of selection rules: Only allows SHG from whereas does not.Fiebig05b ; Kordel09a
Below about 2 K the SHG intensity from begins to drop with time. According to Fig. 2(c) a decrease by 20% is obtained during the first 90 s after reducing the temperature from 5 to 1.8 K. The decrease slows down afterwards. Note that this behavior is reproducible and not caused by changes of the linear optical properties during cooling. A minuscule magnetic field accelerates the decrease of the SHG signal. Figure 2(d) shows that it steadily drops to zero within 30 s when a magnetic field is ramped from 0 to 0.05 T linearly with time. The gradual decrease of the component from its full value to zero is characteristic for a transition of the Mn3+ sublattice.Fiebig02a ; Wehrenfennig10a ; Fiebig00a ; Fiebig05c This is contrasted by only a minor dip in the neutron diffraction at the (101) peak between 1 K and 4 K. The persistence of the (101) reflection is expected as and representations lead to (101) peak intensities differing by only 7% (see also Fig. 2(b)).Park02a ; Lee06a The dip emerging at the intermediary transition, however, cannot be explained on the basis of symmetry.
We therefore verified its occurrence by repeating the temperature dependent measurement on a second magnetic reflection coupling to the Mn3+ order. For this purpose we chose the (103) reflection as SIMREF2.6 simulationsRitter99a (see Fig. 2(f)) reveal no intermixing with Er3+ contributions.footnote1 Figure 2(e) shows a dip between 1 K and 4 K that is even more pronounced compared to the one seen in Fig. 2(a). It points to a transient breakdown of the Mn3+ order that will be discussed in Section III. Note that the dip in the Mn3+-related intensity was not observed in earlier neutron measurements on the same sample where the base temperature of the experiment was limited to 1.8 K.Tomuta03a This emphasizes the importance of establishing a well-defined ground state, here by entering the milli-Kelvin regime, for performing an accurate analysis of the magnetic order in this strongly frustrated system.
II.3 Neutron-diffraction study of the Er3+ spin structure
Analogous to the case of the Mn3+ moments four different representations denoted to have to be distinguished for the Er3+ order.Fabreges08a ; Munoz00a ; Nandi08a ; Fiebig03a However, in contrast to the Mn3+ lattice no SHG contributions coupling to the rare-earth system were found so that our symmetry analysis is entirely based on neutron data.
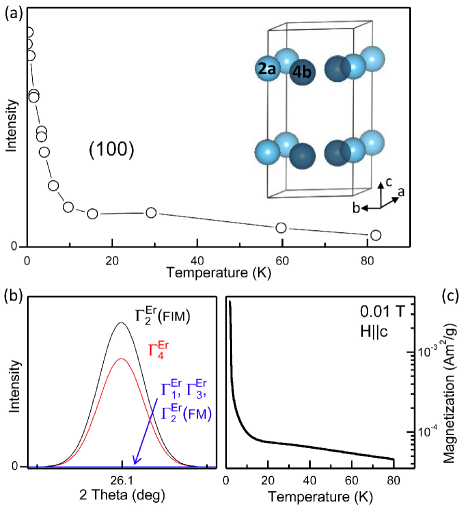
In Fig. 3(a) we present the temperature dependence of the (100) reflection of h-ErMnO3. Since neither order nor order allows Mn3+ contributions to the (100) peak, any contribution to this peak has to be attributed to the magnetic order of the Er3+ moments.Wehrenfennig10a The (100) peak emerges at 80 K. Its intensity increases monotonously with decreasing temperature down to about 10 K where a change of slope occurs. Thus, according to Fig. 3(a) the Er3+ sublattice does not order at 3 K as reported before,Sugie02a but already at . Yet, the temperature dependence of the Er3+-related signal is different from those related to Mn3+ in Fig. 2. This is reminiscent of the situation in h-DyMnO3 and h-YbMnO3 and indicates that the magnetic Er3+ order is related to the antiferromagnetic Mn3+ order by the magnetic triggering mechanism identified in Ref. Wehrenfennig10a, . The triggering mechanism describes a biquadratic order-parameter coupling between two subsystems of a compound. Ordering in one of them can induce ordering in the other at the same temperature whenever the associated coupling term lowers the ground state energy.Holakowsky73 Because of the biquadratic nature of the coupling the Er3+ and Mn3+ sublattices can order according to different magnetic space groups at . Thus, in spite of the known magnetic order of the Mn3+ system, the magnetic Er3+ system may order according to any of the four representations to .
Supplementary simulations by SIMREF2.6, however, reveal that for Mn3+ order according to the experimentally observed (100) reflection only arises if the Er3+ sublattice orders according to the or representation. In turn it is forbidden for and as shown by the simulations in Fig. 3(b). We further note that involves ferromagnetic order on the 2a and 4b sites and is therefore associated to a macroscopic magnetization which can be excluded for temperatures between 10 K and based on the magnetization measurement in Fig. 3(c). We therefore conclude “compatible” magnetic order of the Er3+ and Mn3+ sublattices according to the same representation, , at with an antiferromagnetically ordered Er3+(4b) site and a disordered Er3+(2a) site as sketched in Fig. 4 (AFM-phase). This is qualitatively the same scenario met in h-YbMnO3,Fabreges08a but different from h-DyMnO3,Wehrenfennig10a and h-HoMnO3.Lottermoser04a ; Vajk05a
Below 10 K the pronounced increase of the (100) peak intensity indicates a change in the magnetic Er3+ order. This change is matched by the increase in seen in Fig. 3(c). The only possible transition that is in accordance with the neutron-diffraction and the magnetization measurements is a transition of the Er3+ sublattices. First of all, as mentioned before, the (100) reflection exclusively occurs for the representations and . Regarding the two remaining representations only allows for the magnetization observed at low temperature. This narrows the number of possible magnetic structures down to two, having either an antiparallel () or parallel () alignment of the Er3+ moments on the 4b and 2a sites. The SIMREF2.6 simulations summarized in Fig. 3(b), however, clearly discard Er3+ order according to because in this case destructive interference of the Er3+(4b) and Er3+(2a) contributions suppress the (100) reflection. In contrast, constructive interference occurs for an antiparallel orientation of the Er3+(4b) and Er3+(2a) spins and explains the drastic increase of the (100) peak intensity seen in Fig. 3(a). We thus conclude that the ground state of the Er3+ order is ferrimagnetic, , with antiparallel orientation of the Er3+ moments on the 4b sites relative to the 2a sites (FIM-phase in Fig. 4). In terms of representations, the magnetic order of h-ErMnO3 at low temperature is again the same as in h-YbMnO3Fabreges08a and different from h-DyMnO3,Wehrenfennig10a and h-HoMnO3.Lottermoser04a ; Vajk05a
II.4 Microscopic magnetic structure of the Er3+ and Mn3+ sublattices
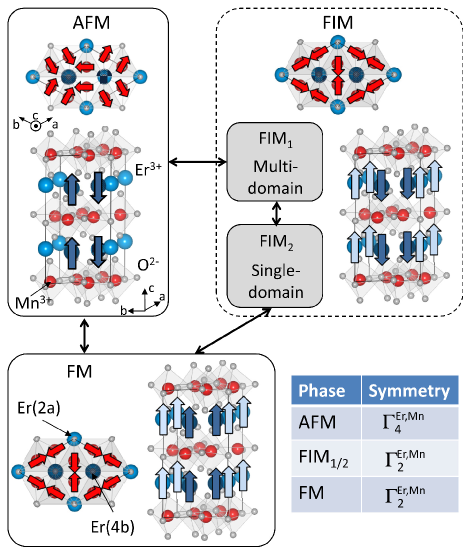
Based on the magnetization, SHG, and neutron-diffraction experiments we can now derive a coherent model describing the different magnetic states indicated in the phase diagram in Fig. 1(c). We have already seen that the Mn3+ moments and the Er3+ moments on the 4b sites order antiferromagnetically in the AFM-phase while the Er3+(2a) spins remain disordered. The order corresponds to the representation and is schematically depicted in Fig. 4. The FIM1 phase encountered toward 0 K in zero magnetic field is characterized by antiferromagnetic Mn3+ order and ferrimagnetic Er3+ order, both according to the representation.
Additional information on the nature of this phase can be extracted from the measurement presented in Fig. 1(b). The pronounced response to small magnetic fields ( T) points to the formation of a ferrimagnetic multi-domain state in zero magnetic field with an ratio of domains with and . Consequently, the FIM2 phase denotes the ferrimagnetic single-domain state with a coercive field of 0.03 T toward 0 K as boundary between the FIM1 and FIM2 states. The ferrimagnetic nature of this state is further reflected by the change in signal occurring at the FIM FM transition in Fig. 1(b). By linearly extrapolating the data gained within the two phases and comparing the corresponding values we find that the magnetization almost triples across the transition. This behavior can be understood in terms of a change from an antiparallel to a parallel arrangement of the Er3+(4b) spins with respect to the Er3+(2a) spins, i.e., a change of the magnetic moment per unit cell from (4-2) to (4+2). The transition to the ferromagnetic Er3+ order does not involve a change of magnetic symmetry and is therefore still described by the representation.
Note that earlier studies did not distinguish between the FIM1 and FIM2 region of the ferrimagnetic phase. In contrast, the ferrimagnetic rare-earth order was believed to be suppressed by small magnetic-fields of only 0.05 T which would misleadingly imply weak exchange between the Er3+ spins.Yen07a
After the unique determination of the microscopic magnetic structure of h-ErMnO3 we can now turn to the intermediary states encountered during the transitions between the AFM, FIM, and FM phases. These transitions will allow us to draw further conclusions about the coupling between the moments at the Er3+(2a) and Er3+(4b) sites and the moments of Mn3+.
II.5 Magnetic interaction of the Er3+ and Mn3+ sublattices
The comparison of Figs. 2 and 3(a) already revealed an interaction between the Mn3+ and Er3+(4b) sublattices: The former triggers the order in the latter at . Below 10 K the Er3+(2a) order supplements the Er3+(4b) order and additional transitions occur as seen in the phase diagram in Fig. 1(c). Figure 3(a) reveals that, unlike the Er3+(4b) order, the Er3+(2a) is not triggered by the Mn3+ order. The Er3+ spins at the 2a sites begin to order at higher temperature ( K) compared to the observed reorientation of the Mn3+ spins ( K). This precludes the triggering mechanism as it would require identical reorientation temperatures for the two sublattices.
Hence, we propose that here the Er3+(2a) order drives the reordering of the Mn3+ sublattice through non-biquadratic triggered (and thus linear) order-parameter coupling. This assumption is supported by three observations: (i) The magnetic rare-earth order continues to strengthen toward lower temperature whereas the Mn3+ order is already saturated. Therefore the Mn3+ order cannot be responsible for the Er3+(2a) order. (ii) The reordering of the Mn3+ sublattice “follows” the Er3+(2a) order at lower temperature. Therefore the latter order, which is continuously strengthening with decreasing temperature, must be guiding the reorientation. (iii) The Mn3+ sublattice adopts the emerging -like order of the Er3+(2a) sublattice by undergoing a transition.
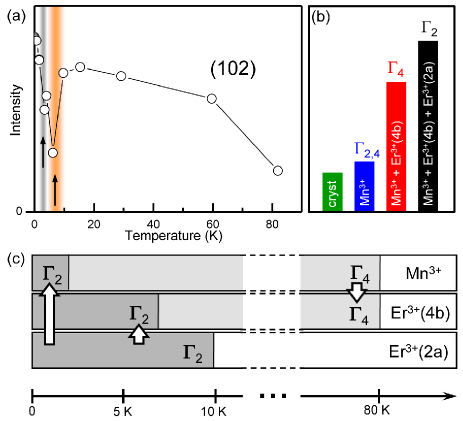
The data shown so far do not reveal the role of the Er3+(4b) in this interaction: Once the 2a site orders it dominates the (100) reflection in Fig. 3(a) to an extent that the response from the Er3+(4b) site is obscured. We therefore investigated various diffraction peaks by SIMREF2.6 simulation in order to identify other magnetic peaks with a similar weight of contributions from the Mn3+, the Er3+(2a), and the Er3+(2a) that would allow us to analyzing the interplay between Er3+ moments on the 2a and 4b sites. As revealed by Fig. 5(b), the (102) reflection fulfills this condition. We find that the intensity of the (102) reflection experiences striking breakdowns around 2.5 K and 7 K revealing magnetic reorientations with a transient breakdown of the magnetic order at these temperatures.Lonkai04a ; Helton11a The breakdown at 2.5 K is related to the Mn3+ sublattice because it is also observed in the (101) and (103) reflexes (see Fig. 2) which are entirely determined by the Mn3+ order. In turn, the additional breakdown at 7 K can only indicate a magnetic reorientation of the Er3+(4b) sublattice. We conclude that, like the Mn3+ order, the Er3+(4b) order toward 0 K is driven by the Er3+(2a) order because it follows the same criteria (i-iii) as the Mn3+ reordering.
In summary, toward 0 K h-ErMnO3 undergoes a transformation with a change of the representation according to . However, the phase is assumed at a different temperature for the Er3+(2a), the Er3+(4b), and the Mn3+ sublattices.
III Comprehensive model for the magnetic phase transitions of hexagonal ErMnO3
By combining the analysis of the magnetic phase diagram in Sections II.1 to II.4 and the analysis of the magnetic transitions between these phases in Section II.5 we are now able to present a comprehensive scenario of the magnetic interactions and the resulting phase transitions in h-ErMnO3 with a projection on the h-MnO3 series as a whole. We distinguish two fundamentally different temperature ranges as illustrated in Fig. 5(c):
Between the Néel temperature and K: In this range the magnetic structure is determined by the ordering of the Mn3+ sublattice. The Mn3+ spins order antiferromagnetically at and promote rare-earth ordering on the Er3+(4b) site. The Er3+(4b) order is induced at the same temperature, , via a triggering mechanism with biquadratic Mn3+–Er3+(4b) order-parameter coupling. Both the Mn3+ and Er3+(4b) lattice order according to the same representation, . However, because of the biquadratic coupling this compatibility is not mandatory. Indeed, Mn3+ and (4b) order according to different representations in h-DyMnO3. In any case, the Er3+(2a) site remains disordered in this temperature range.
Below K: In this range the magnetic structure is determined by the ordering of the Er3+(2a) sublattice. The spins arrange uniformly at K according to the representation with a macroscopic magnetization per domain and a nonzero net magnetization once the magnetic field lifts the degeneracy between oppositely oriented FIM domain states. When the Er3+(2a) order strengthens toward low temperature, the Er3+(2a) ordering at first induces reordering on the Er3+(4b) site ( K) followed by reordering of the Mn3+ sublattice ( K). The coupling to the Er3+(2a) sublattice is linear and therefore not guided by the triggering mechanism. This is evidenced by the difference between the (re-) ordering temperatures and the accordance of the representations describing the magnetic order in the different sublattices. The Er3+(2a) and Er3+(4b) sites maintain an antiparallel spin orientation that can be overcome in an external magnetic field in the order of magnitude of 1 T driving a transition from ferrimagnetic to ferromagnetic Er3+ order. A similar situation is met in all rare-earth h-MnO3 compounds except in h-HoMnO3 where the Ho3+ ground state is antiferromagnetic, yet with similar sublattice correlations as in the other h-MnO3 compounds.
IV Summary
In conclusion, the combination of magnetization, SHG, and neutron-diffraction experiments at temperatures down to the milli-Kelvin regime reveals important features in the magnetic phase diagram of h-ErMnO3. We identify the spin structure in the respective magnetic phases, the magnetic coupling between the Mn3+, Er3+(4b), and Er3+(2a) sublattices, and the resulting phase transitions establishing the phase diagram. We find a high-temperature range above 10 K where the Mn3+ sublattice induces magnetic Er3+ order and a low-temperature range below 10 K where the Er3+ sublattice induces magnetic Mn3+ order. Most of all, we find that the ordering on the 4b and 2a sites of the Er3+ sublattices play a strikingly independent and different role in establishing the magnetic order in h-ErMnO3. The comprehensive model for the phase diagram of the h-ErMnO3 developed in this work can be projected onto the other rare-earth h-MnO3 compounds with only small variations. Thus, we are now able to understand the complex magnetic phases of the h-MnO3 system on a universal basis.
D.M. acknowledges support by the Alexander von Humboldt Foundation and the NSF Science and Technology Center (E3S). M.F. thanks the DFG (SFB 608) for subsidy.
References
- (1) Email address: meier@berkeley.edu
- (2) T. Kimura, T. Goto, H. Shintani, K. Ishizaka, T. Arima, and Y. Tokura, Nature 426, 55 (2003).
- (3) N. Hur, S. Park, P. A. Sharma, J. S. Ahn, S. Guha, and S.-W. Cheong, Nature 429, 392 (2004).
- (4) M. Fiebig, J. Phys. D 38, 123 (2005).
- (5) S.-W. Cheong and M. Mostovoy, Nat. Mater. 6, 13 (2007).
- (6) Ph. Coeuré, P. Guinet, J. C. Peuzin, G. Buisson, and E. F. Bertaut, Proc. Int. Meet. Ferroelectr. 1, 332 (1966).
- (7) R. Pauthenet and C. Veyret, J. Phys. (Paris) 31, 65 (1970). (Curie temperatures are incorrectly listed due to a misprint.)
- (8) Y. Kumagai, A. A. Belik, M. Lilienblum, N. Leo, M. Fiebig, and N. A. Spaldin, Phys. Rev. B 85, 174422 (2012).
- (9) Th. Lottermoser, Th. Lonkai, U. Amann, D. Hohlwein, J. Ihringer, and M. Fiebig, Nature 430, 541 (2004).
- (10) S. Lee, A. Pirogov, M. Kang, K.-H. Jang, M. Yonemura, T. Kamiyama, S.-W. Cheong, F. Gozzo, N. Shin, H. Kimura, Y. Noda, and J.-G. Park, Nature 451 805 (2008).
- (11) M. Fiebig, Th. Lottermoser, D. Fröhlich, A. V. Goltsev, and R. V. Pisarev, Nature 419 818 (2002).
- (12) X. Fabrèges, I. Mirebeau, P. Bonville, S. Petit, G. Lebras-Jasmin, A. Forget, G. André, and S. Pailhès, Phys. Rev. B 78, 214422 (2008).
- (13) S. Harikrishnan, S. Rößler, C. N. Naveen Kumar, H. L. Bhat, U. K. Rößler, S. Wirth, F. Steglich, and S. Elizabeth, J. Phys.: Condens. Matter 21, 096002 (2009).
- (14) Th. Lonkai, D. Hohlwein, J. Ihringer, and W. Prandl, Appl. Phys. A, 74, S843 (2002).
- (15) H. Sugie, N. Iwata, and K. Kohn, J. Phys. Soc. Jpn. 71, 1558 (2002).
- (16) I. Munawar and S. H. Curnoe, J. Phys.: Condens. Matter 18, 9575 (2006).
- (17) T. A. Tyson, T. Wu, K. H. Ahn, S.-B. Kim, and S.-W. Cheong, Phys. Rev. B 81, 054101 (2010).
- (18) Ch. Wehrenfennig, D. Meier, Th. Lottermoser, Th. Lonkai, J.-U. Hoffmann, N. Aliouane, D. N. Argyriou, and M. Fiebig, Phys. Rev. B 82, 100414(R) (2010).
- (19) D. Meier, S. Seidel, A. Cano, K. Delaney, Y. Kumagai, M. Mostovoy, N. A. Spaldin, R. Ramesh, and M. Fiebig, Nature Mat. 11, 284 (2012).
- (20) D. Meier, M. Lilienblum, P. Becker, L. Bohatý, N. A. Spaldin, R. Ramesh, and M. Fiebig, Phase Transit., DOI:10.1080/01411594.2012.696116 (2012).
- (21) Weida Wu, Y. Horibe, N. Lee, S.-W. Cheong, and J. R. Guest, Phys. Rev. Lett. 108, 077203 (2012).
- (22) Y. Du, X. L. Wang, D. P. Chen, S. X. Dou, Z. X. Cheng, M. Higgins, G. Wallace, and J. Y. Wang, Appl. Phys. Lett. 99, 252107 (2011).
- (23) Y. Geng, N. Lee, Y. J. Choi, S.-W. Cheong, and W. Wu, arXiv:1201.0694.
- (24) N. Iwata and K. Kohn, Ferroelectrics 219, 161 (1998); J. Phys. Soc. Jap. 67 3318 (1998). (The results for ErMnO3 and HoMnO3 have to be exchanged.)
- (25) D. B. Litvin, Acta Cryst. A57, 729 (2001).
- (26) A. Muñoz, J. A. Alonso, M. J. Martínez-Lope, M. T. Casáis, J. L. Martínez, and M. T. Fernández-Díaz, Phys. Rev. B 62, 9498 (2000).
- (27) S. Nandi, A. Kreyssig, J. Q. Yan, M. D. Vannette, J. C. Lang, L. Tan, J. W. Kim, R. Prozorov, T. A. Lograsso, R. J. McQueeney, and A. I. Goldman, Phys. Rev. B 78, 075118 (2008).
- (28) M. Fiebig, Th. Lottermoser, and R. V. Pisarev, J. Appl. Phys. 93, 8194 (2003).
- (29) W. C. Koehler, H. L. Yakel, E. O. Wollan, and J. W. Cable, Phys. Lett. 9, 93 (1964).
- (30) M. Fiebig, C. Degenhardt, and R. V. Pisarev, Phys. Rev. Lett. 88, 027203 (2002).
- (31) M. C. Sekhar, S. Lee, G. Choi, C. Lee, and J.-G. Park, Phys. Rev. B 72, 014402 (2005).
- (32) J. Park, U. Kong, S.I. Choi, J.-G. Park, C. Lee, and W. Jo, Appl. Phys. A 74, 802 (2002).
- (33) S. Lee, and J.-G. Park, Neutron News 17 24, (2006).
- (34) M. Fiebig, V. V. Pavlov, and R. V. Pisarev, J. Opt. Soc. Am. B 22, 96 (2005).
- (35) T. Kordel, C. Wehrenfennig, D. Meier, Th. Lottermoser, and M. Fiebig, Phys. Rev. B 80, 045409 (2009)
- (36) M. Fiebig, D. Fröhlich, K. Kohn, St. Leute, Th. Lottermoser, V. V. Pavlov, and R.V. Pisarev, Phys. Rev. Lett. 84, 5620 (2000).
- (37) M. Fiebig, T. Lottermoser, T. Lonkai, A. Goltsev, and R. Pisarev, J. Magn. Magn. Mater. 290-291, 883 (2005).
- (38) Based on Section II.3 the SIMREF2.6 simulation was performed assuming Er3+ order according to the and representation.
- (39) D. G. Tomuta, PhD thesis (2003), Leiden University, The Netherlands.
- (40) H. Ritter, J. Ihringer, J. K. Maichle, W. Prandl, SimRef2.6 (1999), http://www.uni-tuebingen.de/uni/pki/simref/simref.html.
- (41) F. Yen, C. R. dela Cruz, B. Lorenz, E. Galstyan, Y. Y. Sun, M. M. Gospodinov, and C. W. Chu, J. Mater. Res. 22, 2163 (2007).
- (42) Th. Lonkai, PhD thesis (2004), Eberhard-Karls-Universität Tübingen, Germany.
- (43) O. P. Vajk, M. Kenzelmann, J. W. Lynn, S. B. Kim, and S.-W. Cheong, Phys. Rev. Lett. 94, 087601 (2005).
- (44) J. S. Helton, D. K. Singh, H. S. Nair, and S. Elizabeth, Phys. Rev. B 84, 064434 (2011).
- (45) J. Holakowský, phys. stat. sol. (b) 56, 615 (1973).